
Abstract
Several staining concepts and color combinations exist to perform successful double immunoenzyme staining on human tissue specimens. Most of these concepts are based on differences between both primary antibodies: animal species, mouse Ig isotype or IgG subclasses, conjugates, or concentrations. Traditionally, double immunoenzyme staining has used chromogens selected to provide maximum color contrast when observed with the unaided eye. Unfortunately, visually good color combinations always include at least one diffuse chromogen, because of the paucity of appropriate chromogen colors. This situation is drastically changed with the use of spectral imaging, where multicolor microscopy can be unmixed in individual images based on their spectral characteristics. Spectral unmixing can be performed even up to quadruple immunoenzyme staining. This work contains practical suggestions for immunoenzyme double staining procedures for some frequently encountered primary antibody combinations: rabbit–mouse, goat–mouse, mouse–mouse, and rabbit–rabbit. The suggested protocols are all suitable for a classical red-brown color combination plus blue nuclear counterstain that is composed of peroxidase activity (diaminobenzidine tetrahydrochloride), alkaline phosphatase activity (Liquid Permanent Red), and hematoxylin, respectively. Although the red and brown chromogens do not contrast very well visually, they both show a crisp localization and can be perfectly unmixed by spectral imaging.
T
Traditionally, when using the unaided eye or any type of RGB camera for observation of double staining results, a good visual contrast between the two enzymatic reaction products plays an essential role. If two antigens are localized at the same cellular structure (=colocalization), a mixed-color is present that needs to have a good contrast with the two basic colors. To accomplish this, one needs to compromise with the chromogen selection regarding the sensitivity/efficiency and microscopic resolution of the colored reaction products.
Spectral imaging with the ability to unmix multiplexed images is only marginally applied for fluorescence microscopy (Tsurui et al. 2000; Siboni et al. 2001; Greenbaum et al. 2002; Weier et al. 2005). Papers describing spectral imaging of bright field tissue samples are rare (Ornberg et al. 1999; Ornberg 2001; Levenson and Mansfield 2006). On introduction of spectral imaging of bright field microscopical specimens, the whole concept of contrasting basic colors and mixed color is drastically changed. Based on the spectral characteristics of the reaction products, spectral imaging offers the great advantage of unmixing the double staining patterns into two single staining images, and visual contrast is no longer a requirement (de Boer et al. 2007a, b; Hoozemans et al. 2007; Scheper et al. 2007).
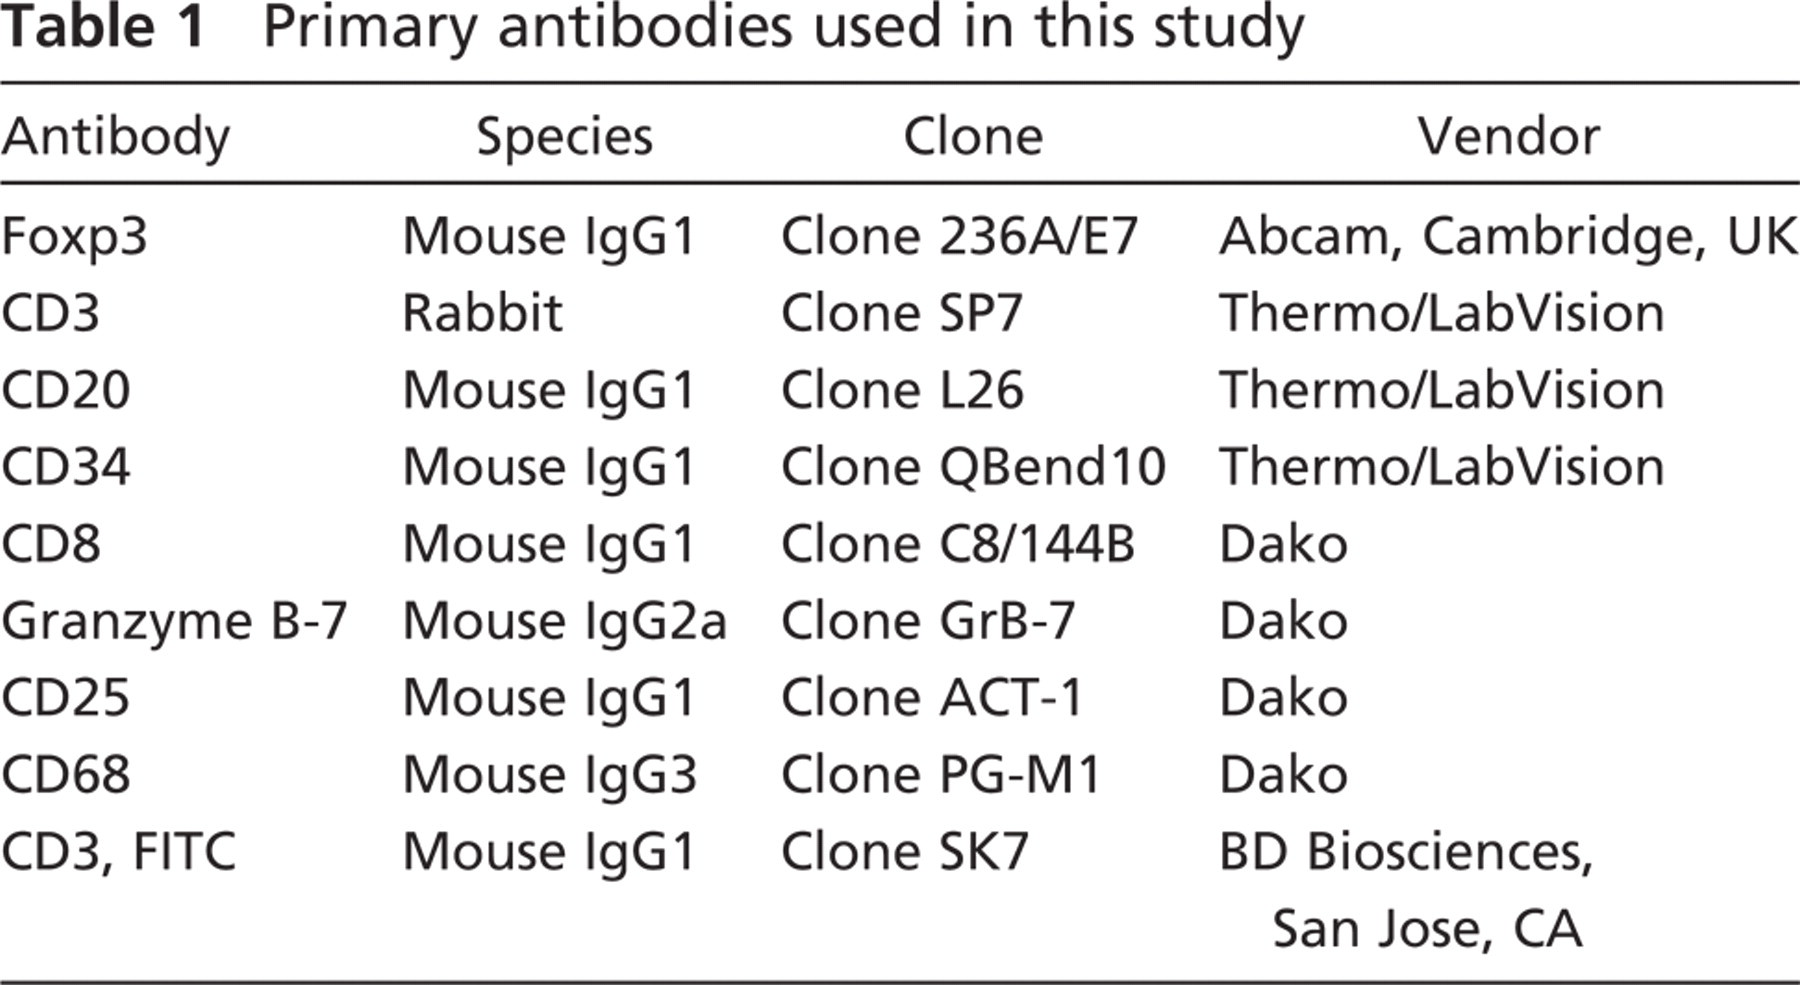
Primary antibodies used in this study
Secondary steps, other immunoreagents, and chromogens used in this study
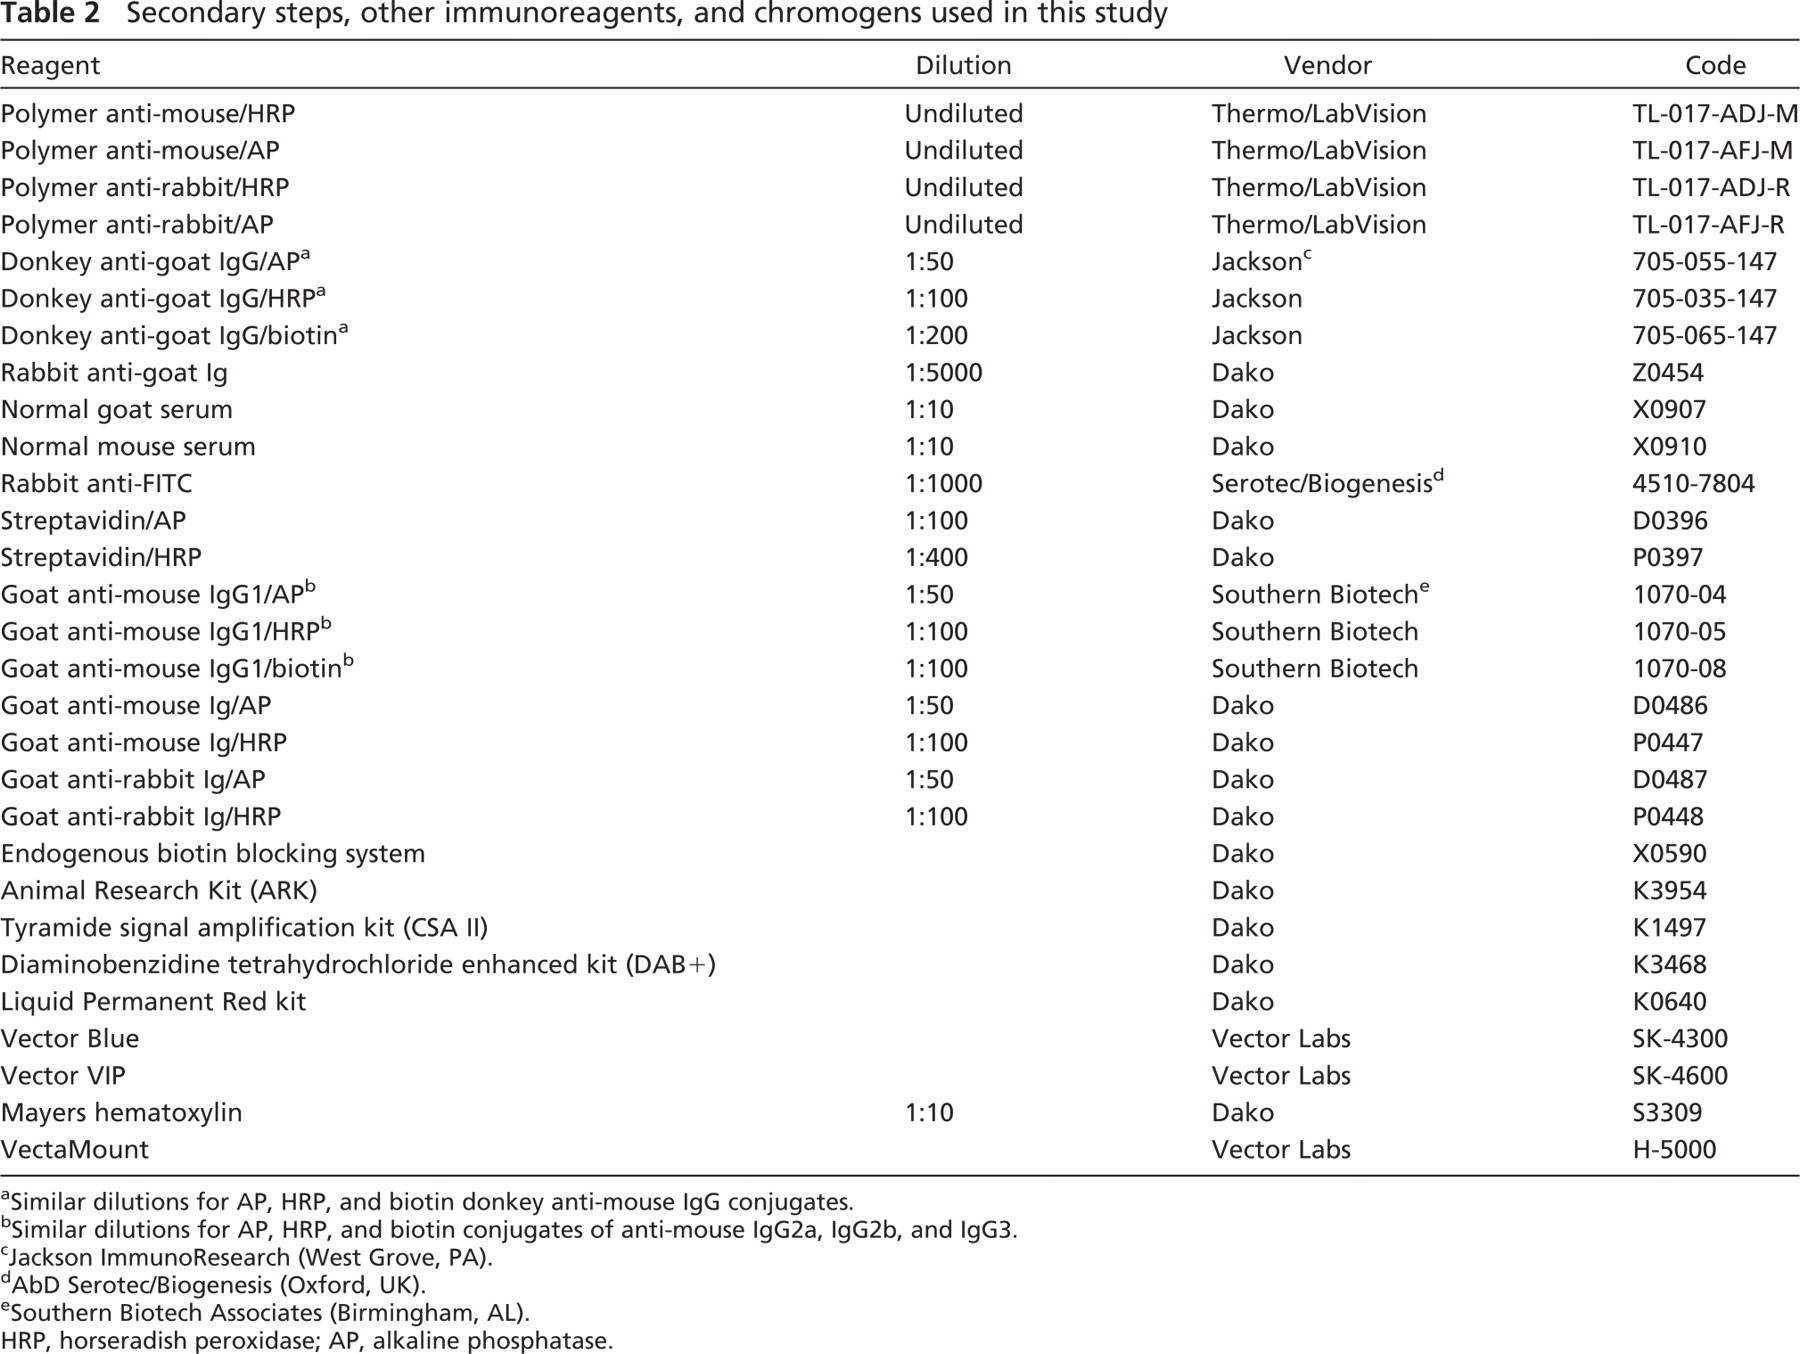
a Similar dilutions for AP, HRP, and biotin donkey anti-mouse IgG conjugates.
b Similar dilutions for AP, HRP, and biotin conjugates of anti-mouse IgG2a, IgG2b, and IgG3.
c Jackson ImmunoResearch (West Grove, PA).
d AbD Serotec/Biogenesis (Oxford, UK).
e Southern Biotech Associates (Birmingham, AL).
HRP, horseradish peroxidase; AP, alkaline phosphatase.
Traditional Chromogen Combinations for Double Staining
When observing double staining results with the unaided eye, the chromogen combination is of essential importance because visual contrast is the key requirement. Especially when the observation of colocalization is the maintarget, there needs to be an optimal contrast between the two basic colors and the mixed component. During the history of IHC, many different chromogen combinations for double staining have been proposed (van der Loos 1999), but only two have proven to be suitable for the direct visual observation of both the individual chromogens and a mixed color at sites of colocalization: red–blue (with a brown–purple intermediate color) and turquoise–red (with a blue–purple intermediate color).
The red–blue colorcombination is composed of alkaline phosphatase (AP) activity in blue using Fast Blue BB/Napthhol-AS-MX-phosphate and horseradish peroxidase (HRP) activity in red with 3-amino-9-ethyl-carbazole (Boorsma 1984; van der Loos 1999). Both reaction products dissolve in organic mounting media, and therefore, aqueous mounting is needed here. Alternatively, two commercially available chromogens from Vector Laboratories (Burlingame, CA) can be applied: Vector Blue and Vector NovaRed (van der Loos 2005). Aqueous mounting for Vector Blue and NovaRed is not possible (NovaRed disappears over time!), but organic mounting after complete drying of the specimens using an alcohol- and xylene-free mountant (Vecta-Mount) yields excellent microscopical results with both cryostat and paraffin tissue sections. A counterstain in combination with the red–blue color combination needs to be tested per antibody combination. The most obvious choice is methyl green (0.1% in acetate buffer, pH 5.5), yielding weakly green nuclei. However, methyl green appears to bind to the red reaction product, shifting its color to brown. As such, this lowers the color contrast, hampering the observation of co-localization by mixed colors. In some instances, a weak eosin counterstain (dip in eosin solution for 30 sec, rinse in running tap water, and check microscopically until an optimal result is obtained) or weak Nuclear Red counterstain may suffice and give a faint image of unstained tissue elements. The problem in the red–blue combination is that blue AP reaction products (Fast Blue, Vector Blue) are relatively insensitive and rather diffusely localized compared with the peroxidase reaction product. Visualizing AP activity with nitro blue tetrazolium/5-bromo-4-chloro-3-indolyl-phosphate yields a dark blue purple–colored reaction product that does not allow the observation of a mixed color.
Mouse–rabit double staining.
Goat–mouse indirect double staining.
Goat–mouse multistep double staining.
Mouse–mouse sequential double staining.
The turquoise–red color combination is composed of β-galactosidase (β-GAL) activity in turquoise and AP activity in red (van der Loos et al. 1993). β-GAL activity is visualized using 5-bromo-4-chloro-3-indolyl β-galactoside (X-gal) with ferro-ferri iron cyanide salts (Bondi et al. 1982). This reaction product is very stable and does not dissolve in alcohols or other organic liquids. AP activity can be visualized in red using Fast Red TR, Fast Red Violet LB/Naphthol-AS-MX-phosphate (Boorsma 1984; van der Loos 1999), or other commercially available red AP visualization methods. Sensitive and elegantly in use (one can prepare the exact amount of reagent needed!) is Liquid Permanent Red (LPR) from Dako (Carpinteria, CA), which also allows organic mounting after skipping the dehydration in alcohols (dry specimens at hot plate and coverslip organically). A weak blue hematoxylin counterstain contrasts fairly well with the basic colors but is nearly identical in color with the blue–purple intermediate color at sites of colocalization. The problem in the turquoise– red combination is β-GAL activity being certainly far less sensitive/efficient and more diffusely localized compared with HRP reaction products or AP activity in red.
Alternatively, a red–green combination can be obtained from green HRP activity visualized with 3,3′,5,5′-tetramethylbenzidine (TMB)/dioctyl sodium sulphosuccinate (Buckel and Zehelein 1981) and AP activity in red (van der Loos et al. 1988). The turquoise/green reaction product is pretty accurate and very sensitive/efficient; however, it is not very stable after aqueous mounting (Speel et al. 1994). Because of the extreme sensitivity/efficiency of these chromogens, a careful titration of primary and secondary reagents is strongly recommended. Generally, TMB-based visualization of HRP activity, including the commercially available chromogens TrueBlue (Kirkegaard and Perry, Gaithersburg, MD) and Vector TMB are considered “difficult” and do not seem to work well with every antibody in each situation. A scientific explanation for these inconsistent and variable results is lacking thus far.
Mouse–mouse double staining, different IgG subclasses.
As we saw here, both red–blue and turquoise–red color combinations have the drawback of containing one diffusely localized and rather insensitive/inefficient chromogen: Fast Blue BB, Vector Blue in the red–blue combination, and X-gal in the turquoise–red combination. This drawback makes it necessary to re-titrate primary antibodies for double staining situations and makes it impossible to perform successful double staining with antibodies that show obscure and weak staining by nature or staining of tiny cellular constituents.
The red–brown color combination is composed of HRP activity with diaminobenzidine tetrahydrochloride (DAB) in brown and AP activity with Dako's LPR in red. This chromogen combination ensures two sensitive/efficient enzymatic visualization procedures both with a crisp microscopical appearance. Nuclear counterstain with hematoxylin is optional. For observation with the unaided eye, this color combination has been applied for decades by many investigators (Nakane 1968; Malik and Daymon 1982) and is used in several commercially available double staining kit systems. The red–brown color combination combined with visual observation is only useful in showing two different cell populations or constituents without any overlap. Visualization of colocalization, however, is not possible with this color combination because a visually distinct red–brown mixed color is lacking (van der Loos 1999).
Color Combinations for Spectral Imaging
Because of the ability of spectral imaging system to separate chromogens that are visually nearly indistinguishable, the visual color of a reaction product is no longer important. Therefore, chromogens can be selected now for multiple staining that are sensitive/efficient, have a crisp localization pattern, and that can be mounted organically, best fitting with paraffin tissue sections rather than for their visual assessment properties. The double staining protocols in this work are based on the brown–red color combination: HRP activity in brown by an enhanced version of DAB (DAB+; Dako) and AP activity in red by LPR (Dako) with a nuclear counterstain in blue using hematoxylin. To show the power of spectral unmixing, it is shown here that even quadruple IHC can be unmixed into four individual images. Quadruple IHC is performed sequentially combining two double staining procedures with a heat-induced epitope retrieval (HIER) step in between for removing all immunoreagents from the first staining sequence (Lan et al. 1995). In the second staining sequence, AP activity in blue with Vector Blue and HRP activity in purple with Vector VIP (Vector) are used. Although the visual contrast after multiple staining is rather poor and colocalization by a mixed color is easily missed with the unaided eye, these enzymatic reaction products serve as an exquisite basis for analysis of multiple staining by spectral imaging.
Mouse–mouse double staining, combining high-sensitive tyramide amplification and low-sensitive indirect staining.
Materials and Methods
Tissue samples (tonsil, rejected kidney transplant) were routinely fixed with buffered 4% formalin for at least 48 hr and routinely processed to paraffin blocks. Five-μm sections were cut and mounted on coated slides and dried overnight at 37C. Slides were dewaxed in xylene and hydrated using graded alcohols to tap water. Endogenous peroxidase activity in formalin-fixed, paraffin-embedded (FFPE) sections was blocked with 0.3% peroxide in methanol (20 min, room temperature). Ensuring a well-preserved tissue morphology during HIER, this step was performed in the PreTreatment Module (PTModule; Thermo Scientific/Lab-Vision, Fremont, CA) (Gray et al. 2006) for 20 min at 98C with a cool-down to 65C. For optimizing the staining results of all antibodies involved in double staining, four HIER solutions were tested (Shi et al. 1997): citrate pH 6.0, EDTA pH 8.0, Tris-HCl+ EDTA pH 9.0, and Tris-HCl pH 10.0 (Thermo Scientific/LabVision). After washing with running tap water, a non-serum protein block was applied for 15 min at room temperature (Ultra V Block; Thermo Scientific/LabVision).
Fresh tonsil tissue was snap-frozen in liquid nitrogen and stored at −80C. Five-μm cryostat tissue sections were dried overnight at room temperature, fixed with cold acetone (10 min), and air dried (2 min). Endogenous peroxidase activity in cryostat tissue sections was blocked with Tris-HCl–buffered saline (TBS) + 0.3% peroxide and 0.1% sodium azide (10 min, room temperature) (Li et al. 1987). After washing with TBS, a non-serum protein block was applied for 15 min at room temperature (Ultra V Block; Thermo Scientific/LabVision). Primary antibodies used in this study are listed in Table 1. All other immunoreagents fitting into the general protocols in Figures 1–8 are listed in Table 2.
Antibodies and conjugates were diluted in TBS + 1% BSA (Sigma, St. Louis, MO), and TBS was used as washing buffer for all further steps (three times for 3 min). From here on, a double staining protocol including enzymatic visualization was performed as described under Double Staining Protocols and schematically represented in Figures 1–8. Double stained specimens were counterstained using 1:10 diluted hematoxylin (in tap water) ensuring a moderate, but essentially transparent nuclear staining. Specimens were dried on a hot plate (50C) and organically (without alcohol or xylene) coverslipped with VectaMount (Vector).
Specimens were observed with a Leica BM5000 microscope (Leica Microsystems; Wetzlar, Germany) with a Nuance VIS-FL Multispectral Imaging System (Cambridge Research Instrumentation; Woburn, MA) connected using a standard 1× c-mount. Spectra were acquired from 460 to 660 nm at 10-nm intervals. Nuance software version 2.4 was used for analysis.
Mouse–mouse/FITC indirect-direct multistep double staining.
Double Staining Protocols
The protocol for a double staining procedure is highly dependent on the primary antibody combination with respect to animal species, Ig isotype, mouse IgG subclass, or direct labeling. Usually investigators perform single staining first and then select the best antibody combinations for double staining. This strategy means that a double staining protocol needs to be composed of primaries that have been optimized for single staining before. Consequently, a double staining procedure has to be designed based on the characteristics of the primary antibodies. The following section discusses the advantages, disadvantages, and problems with regularly encountered primary combinations of mouse–rabbit, mouse–goat, mouse–mouse, and rabbit–rabbit.
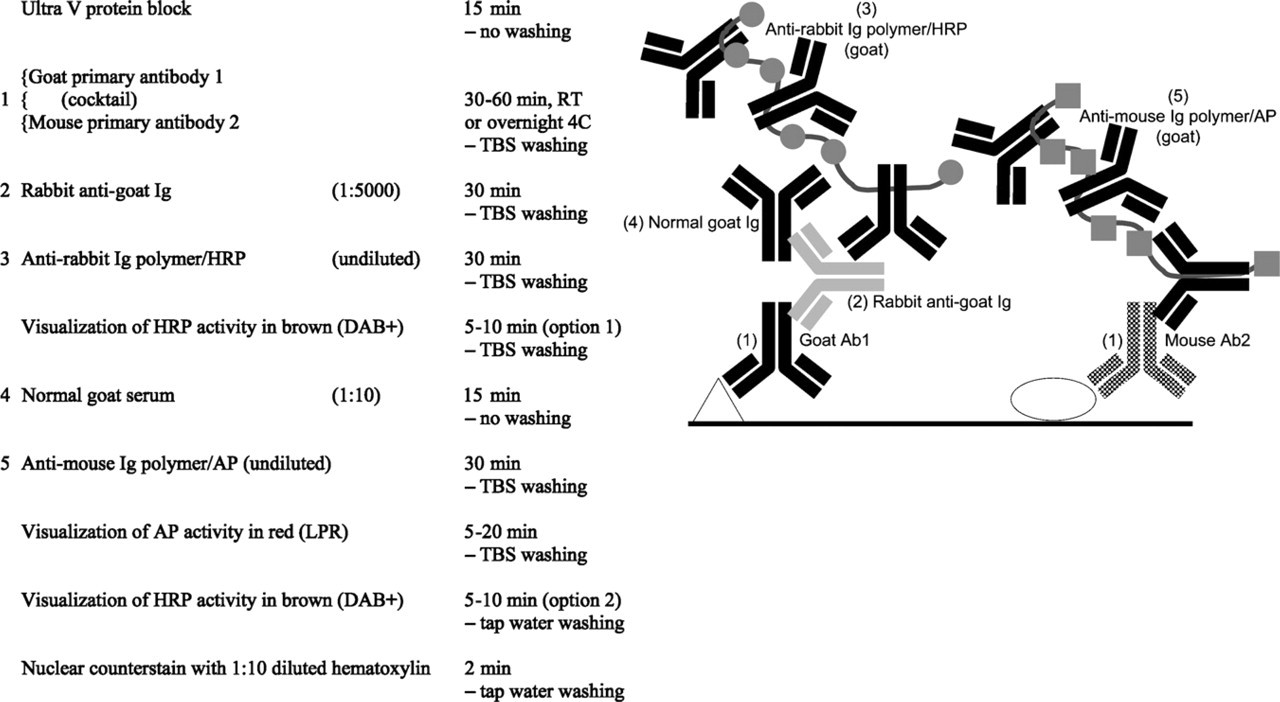
Mouse–Rabbit Combination
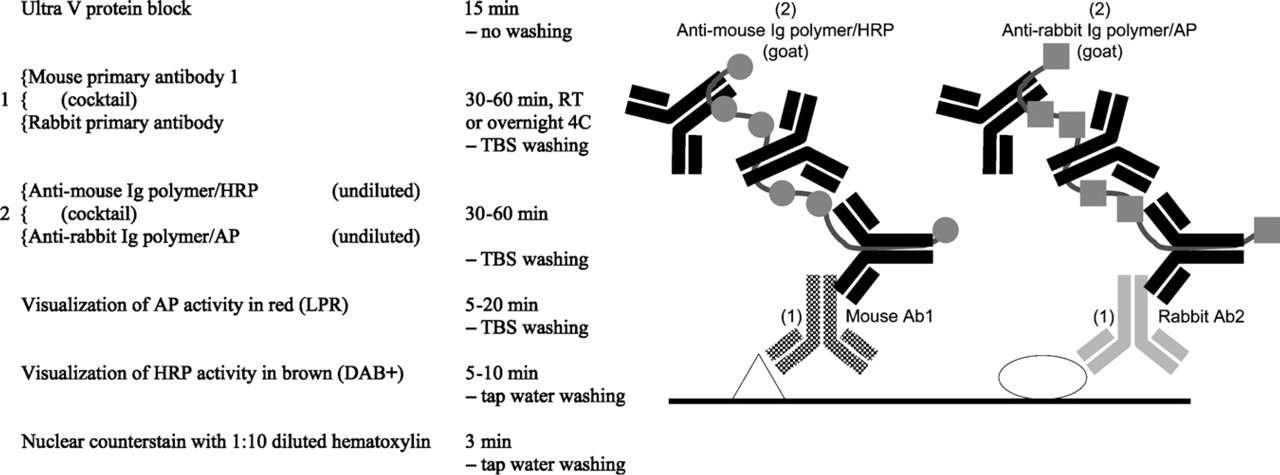
The mouse–rabbit primary antibody combination is the easiest double staining procedure to perform technically. A cocktail of both primary antibodies and then both secondary antibodies followed by the subsequent visualization of AP activity and HRP activity makes it a short and user-friendly procedure. In the fall of 2007, the MultiVision kit system for staining a rabbit–mouse primary antibody combination including red and blue chromogens was introduced by Thermo Scientific/LabVision. Many double staining combinations can be composed of any mouse monoclonal antibody combined with either a classical rabbit polyclonal antibody or one of the recently introduced commercially available rabbit monoclonal antibodies (Rossi et al. 2005). A biotin-free detection system is applied using single species anti-mouse and anti-rabbit polymers attached with either HRP or AP enzymes (Sabattini et al. 1998). Because all anti-mouse, anti-rabbit polymers contain a secondary antibody of goat origin, there is no inter-species cross-reaction problem. Figure 1 shows a general protocol and schematic diagram. The step numbers in the schematic diagram refer to the step number in the protocol.
Mouse–mouse/Animal Research Kit (ARK)-biotin indirect-direct multistep double staining after ARK-biotin labeling.
Mouse–Goat Combination
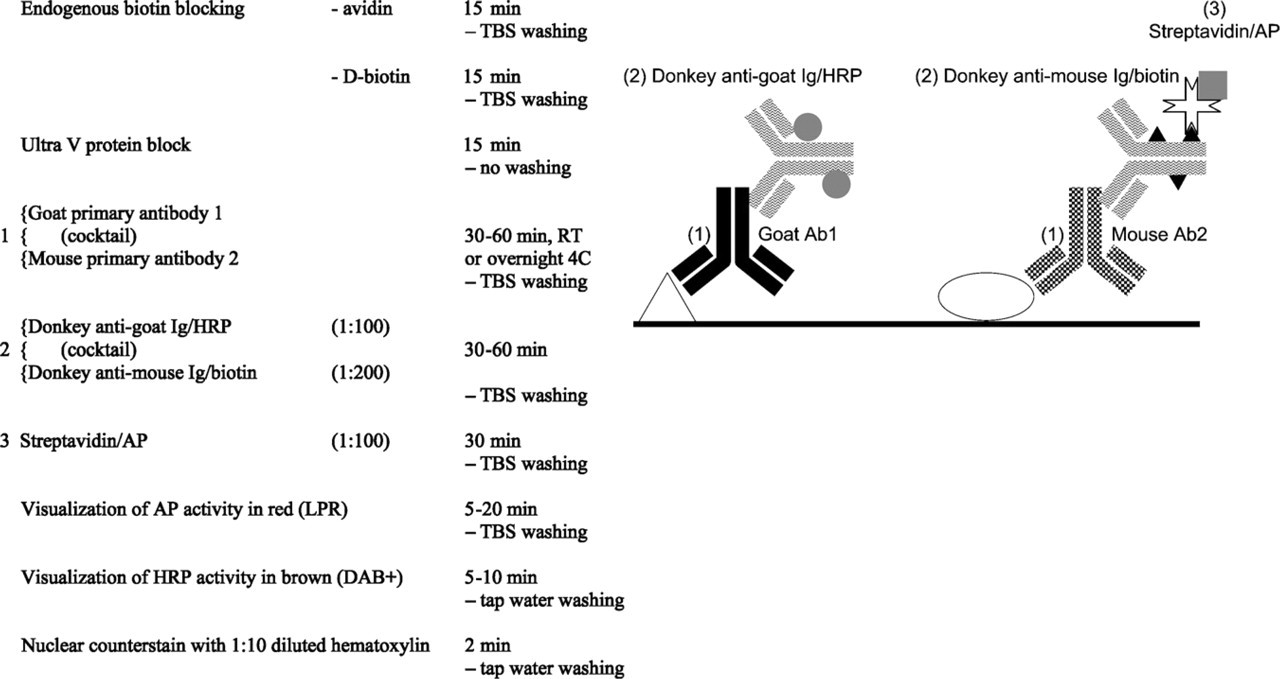
Basically, the combination of mouse and goat primary antibodies is similar to the mouse–rabbit situation: two primaries of different species. When no problems with endogenous biotin are expected and the higher staining sensitivity/efficiency of polymers is not needed, one may use traditional conjugates raised in donkey as secondary antibodies against mouse or goat directly labeled with AP, HRP, or biotin (Jackson; West Grove, PA) (Figure 2). Care should be taken to block endogenous biotin when using biotin-conjugated antibodies (Wood and Warnke 1981). However, blocking of endogenous biotin in some tissues (liver, kidney, spleen) after HIER using Tris-EDTA pH 9.0 may be unsuccessful (Vyberg and Nielsen 1998). A special problem is encountered when a biotin-free polymer detection system is needed for more sensitivity/efficiency. Because all anti-mouse polymers contain an antibody raised in goat, cross-reaction with the anti-goat detection system is very obvious. Alternatively, a multistep approach with a blocking step in between can be applied successfully (Figure 3). In this multistep protocol, HRP activity can be developed after step 3 (option 1) or as a last chromogen step (option 2). Option 2 is preferred, but this may lead to a weak or even negative HRP staining result.
To date, there are anti-goat polymers available, but it is undisclosed what species the anti-goat antibody is raised in (Invitrogen/Zymed; Carlsbad, CA and BioCare; Concord, CA). Without the proper knowledge of the host, these polymers may cross-react unexpectedly with other species involved in the staining sequence and are therefore not useful for this type of double staining.
Mouse–Mouse or Rabbit–Rabbit Combinations
Because many antibodies are of murine monoclonal origin, it is obvious that a mouse–mouse combination is regularly needed. Several successful double staining procedures have been published dealing with the main problem of cross-reaction between the two anti-mouse detection systems.
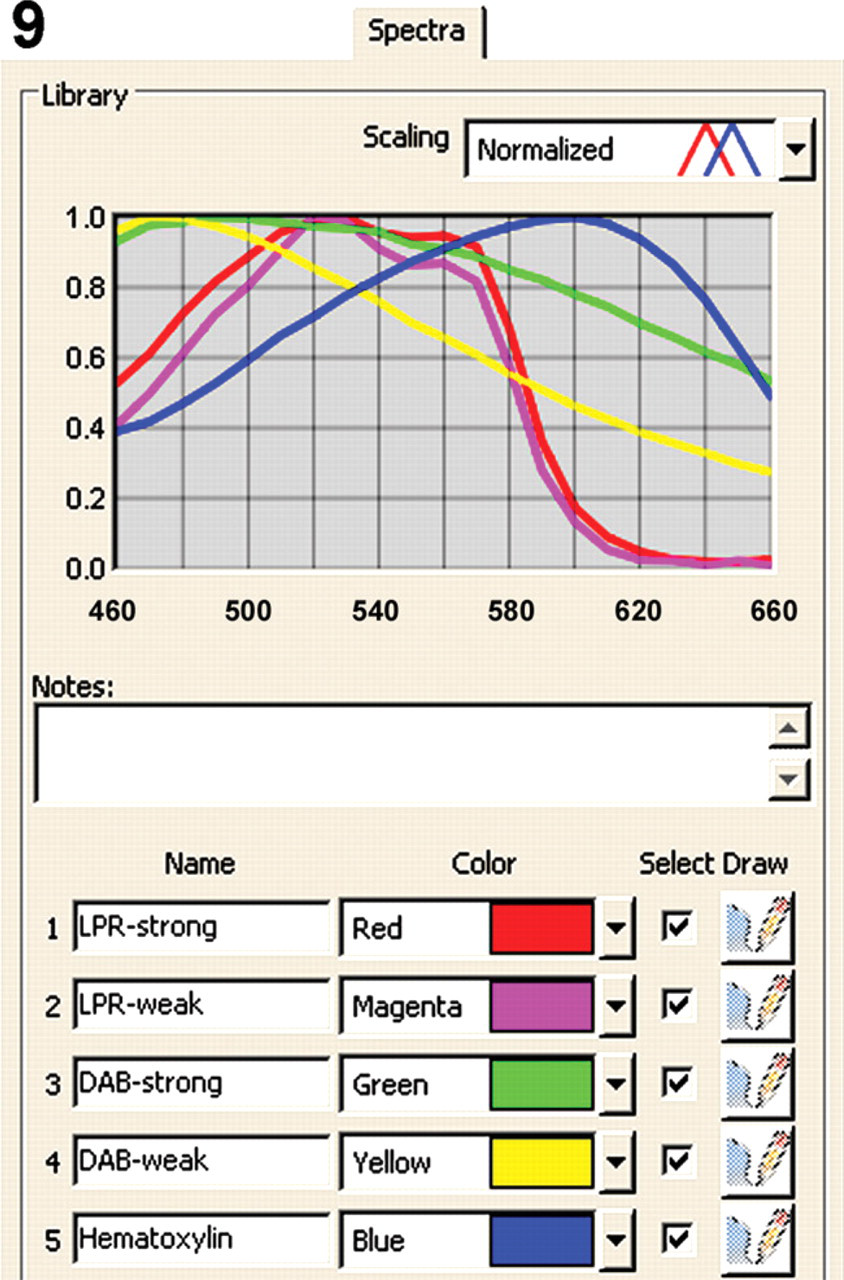
Spectra tab from the Nuance software (version 2.4) showing the individual spectra of Liquid Permanent Red (LPR)-strong (red), LPR-weak (magenta), diaminobenzidine tetrahydrochloride (DAB)-strong (green), DAB-weak (yellow), and hematoxylin (blue) from 460 to 660 nm. Note the distinct difference between the spectra of DAB-strong reaction product and DAB-weak, whereas there is minimal difference between LPR-strong and LPR-weak.
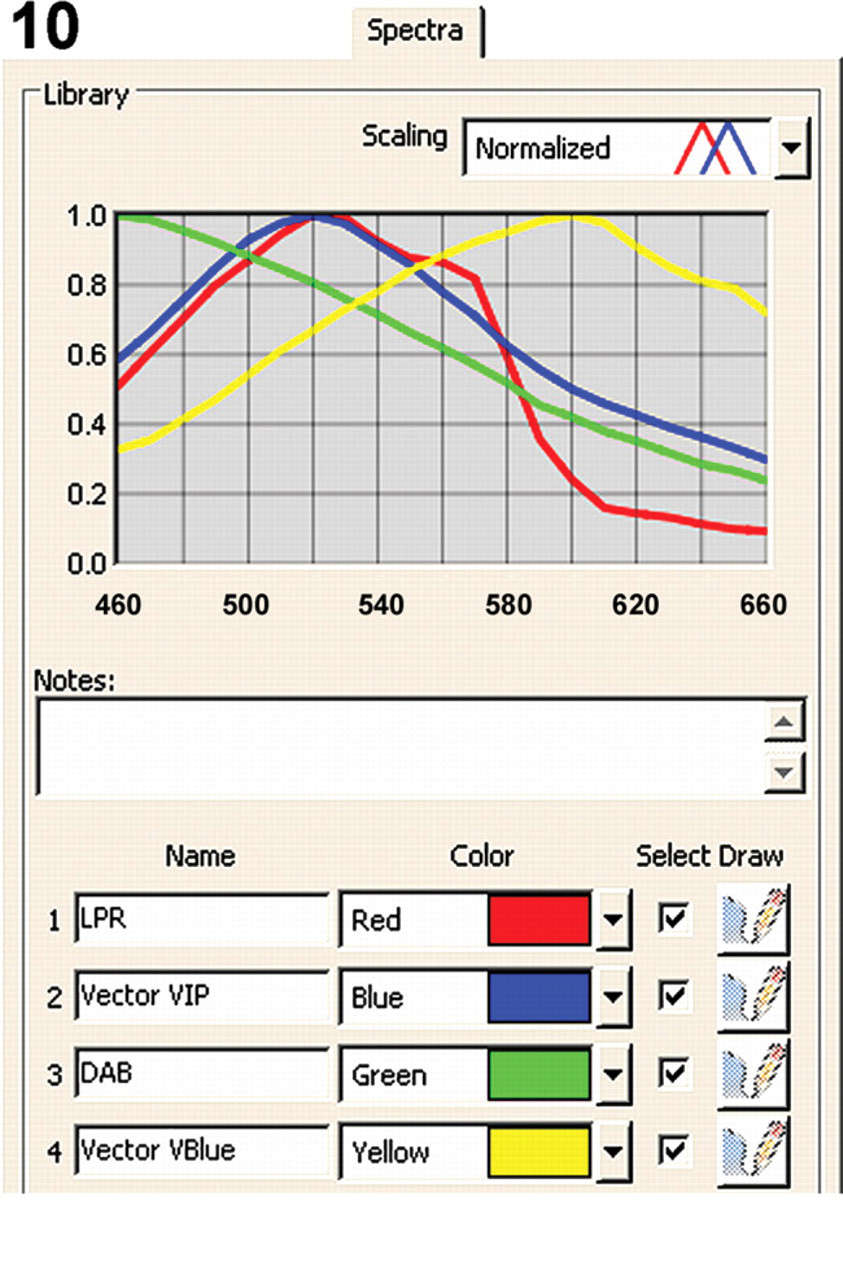
Spectra tab from the Nuance software (version 2.4) showing the individual spectra of LPR (red), DAB (green), Vector Blue (yellow), and Vector VIP (blue) from 460 to 660 nm.
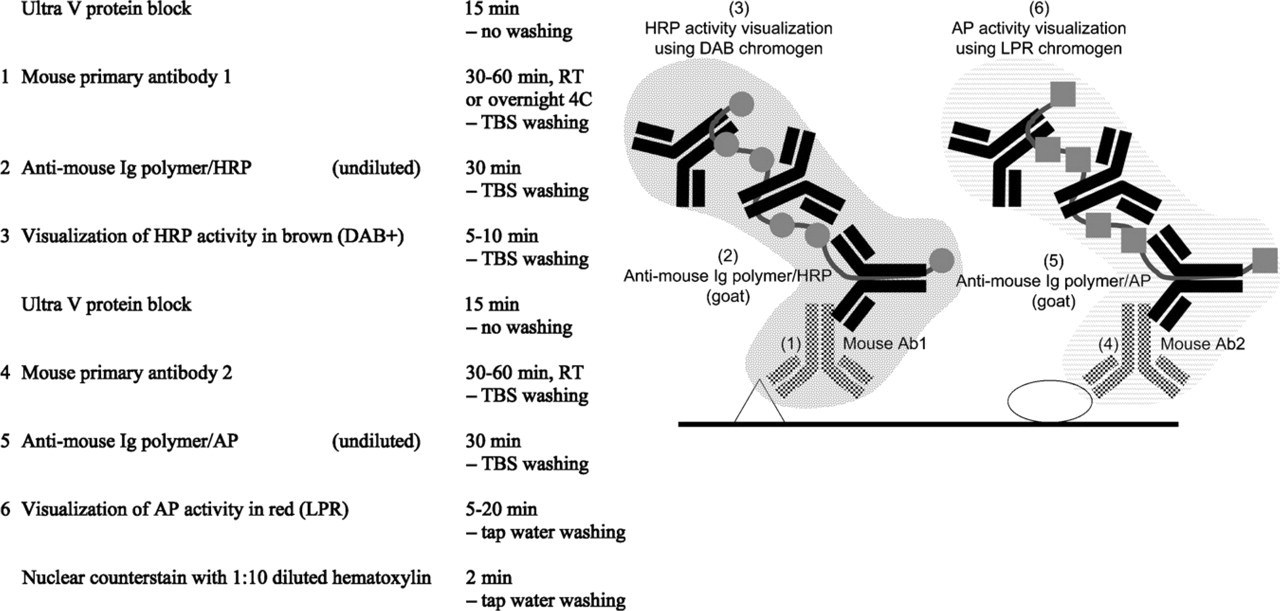
1. Sequential double staining combining two unlabeled mouse or rabbit antibodies in two separate detection sequences (Figure 4). To prevent cross-reaction between the two staining sequences, investigators initially removed the immunoreagents from the first staining sequence by low pH buffers. This step leaves the colored reaction product intact (Nakane 1968). Several methods have been suggested for this removal (extreme pH buffers, high salt, electric current), but none of them was successful in removing high-affinity primary antibodies (Tramu et al. 1978). Subsequently, it was shown that cross-reaction between reagents used in the first and second staining sequence is prevented by using DAB as chromogen after the fist staining sequence. It is claimed that the brown DAB reaction product is the only known chromogen that effectively covers immunoreagents from the first staining sequence and therefore prevents cross-reactions (Sternberger and Joseph 1979). However, in case both antigens are in close proximity, the effective sheltering by the DAB reaction product may also shelter the second antigen as well (Valnes and Brandtzaeg 1984). Titration of the first primary antibody has proven to be an important key factor for the successful performance of sequential double staining. A too high concentration of the first primary antibody may result in incomplete sheltering by DAB reaction product, leading to unwanted cross-reactions with the second staining sequence (van der Loos, unpublished data). Generally, sequential double staining is applied for the identification of two different cell types or cell constituents. It is not recommended for the observation of colocalization by mixed colors. Control experiments are indispensable for the safe performance of this type of double staining.
2. Sequential double staining with a HIER step in between the two staining sequences is described by Lan et al. (1995). This heating step has been proven to be effective even for the removal of high-affinity primary antibodies and can be combined with any type of chromogen that survives the heating step. This enables chromogen combinations of one's own choice and may circumvent the use of DAB.
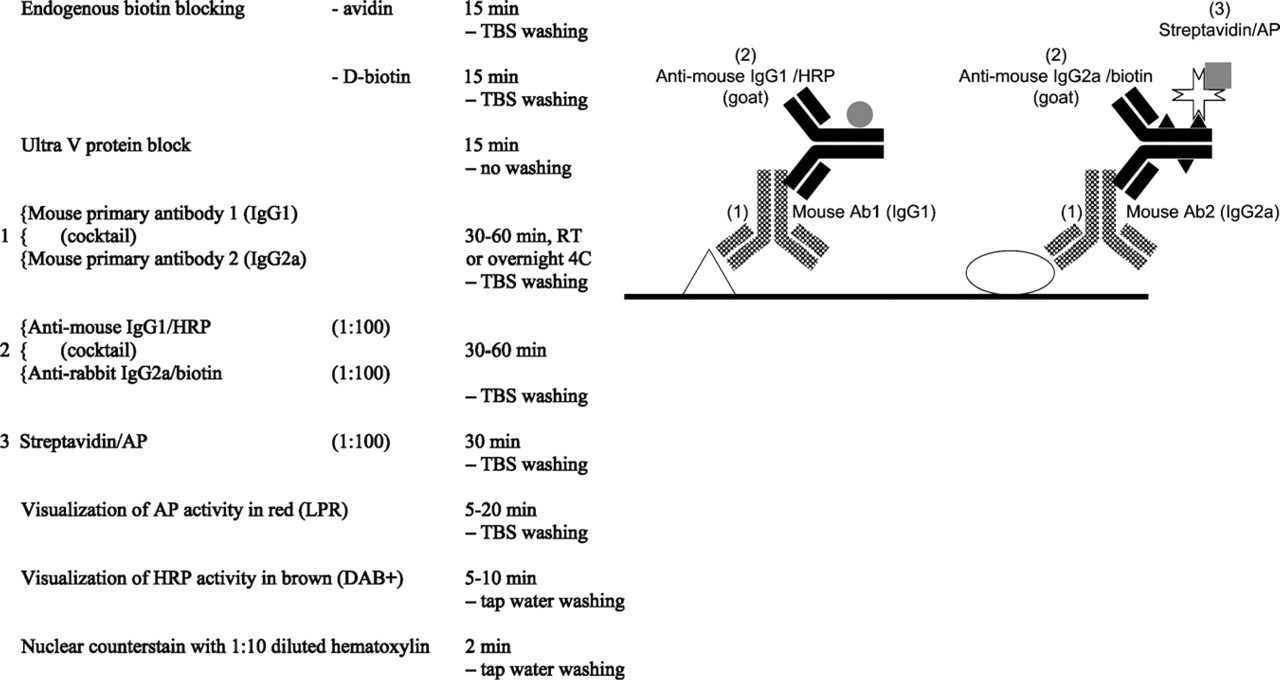
3. Indirect/indirect protocol based on two mouse monoclonal primary antibodies of different Ig type (IgG–IgM) or different IgG subclass (IgG1, IgG2a, IgG2b, IgG3; Figure 5) (Tidman et al. 1981). Because nearly 90% of all mouse monoclonal antibodies are of IgG1 subclass, this indirect/indirect double staining protocol can be only rarely applied. High-quality mouse IgG isotype–specific second step reagents labeled with different enzymes, fluorochromes, or biotin can be found at Southern Biotech Associates (Birmingham, AL). As with indirect/indirect double staining using antibodies of different animal species, this type of double staining can also be performed by applying a cocktail of two primary antibodies and a cocktail of two secondary antibodies. To date, no polymers are available for this type of detection.
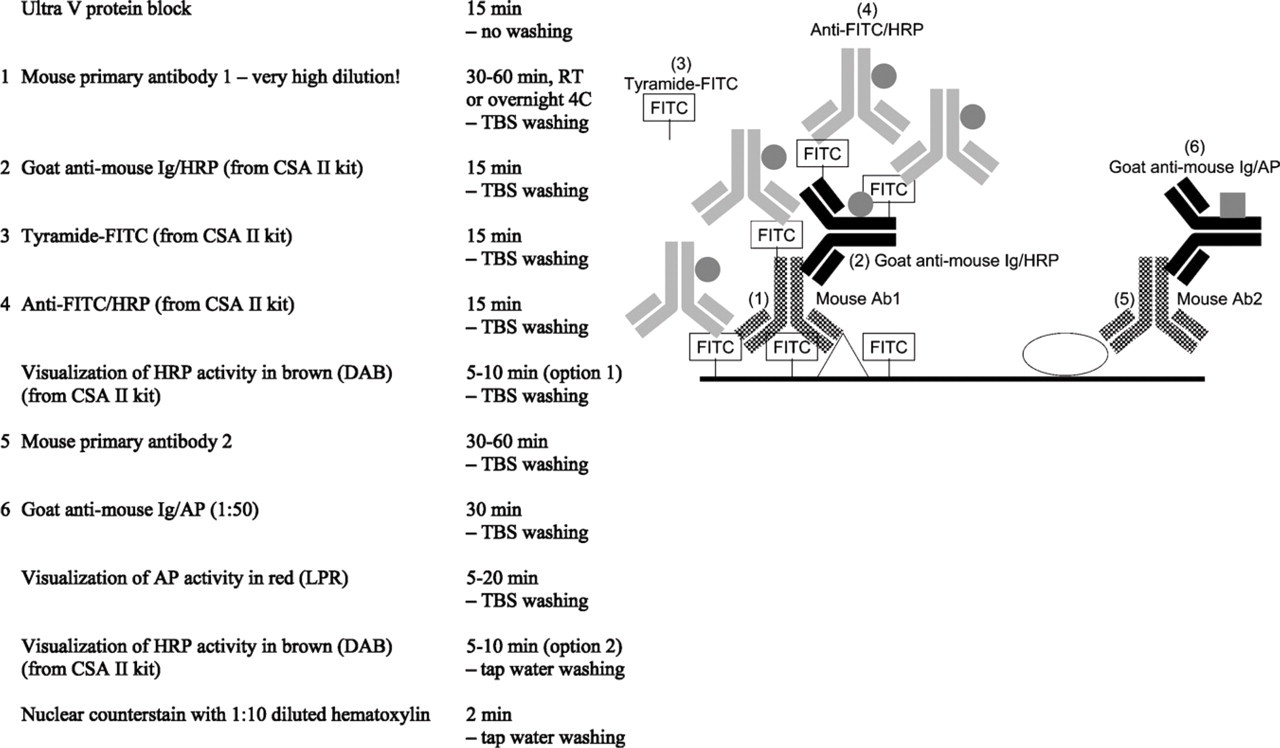
4. Performance of a first unlabeled primary antibody at a very high dilution followed by the highly sensitive/efficient tyramide amplification and a second unlabeled primary antibody visualized by a relatively low-sensitive/efficient IHC detection protocol. The high dilution of the first primary prohibits cross-reaction with the second detection system. If any component of the second detection system attaches to components of the first detection system, it remains below detection level and will not visible. This method was first described with fluorochromes (Brouns et al. 2002) and recently with enzymatic markers (van der Loos 2006) (Figure 6). Obviously, control experiments are needed for the safe interpretation of results obtained with this type of double staining.
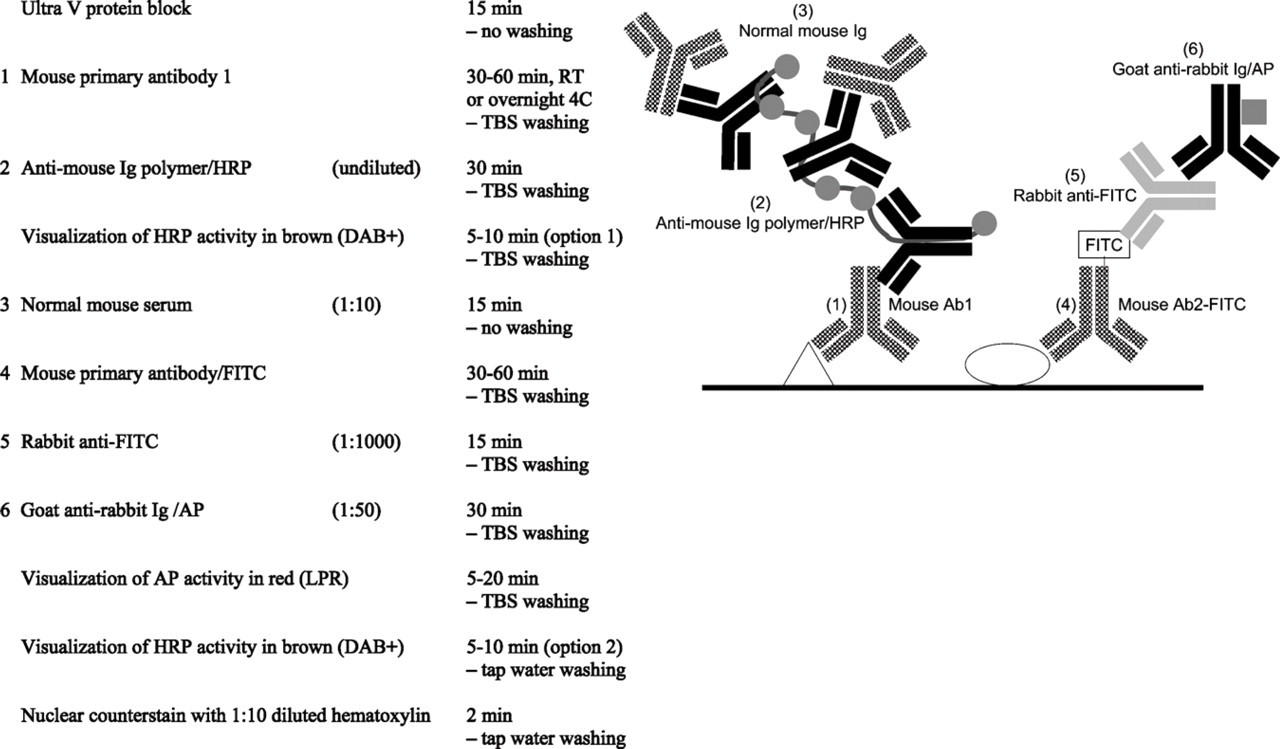
5. Indirect/direct multistep protocol combining an unlabeled mouse primary antibody with a second mouse primary antibody that is directly conjugated (fluorochrome, hapten, biotin, or enzyme). The multistep procedure starts with the unlabeled primary antibody, for example, detected with an enzyme-labeled anti-mouse polymer. Next, a normal mouse serum blocking step is applied to saturate all anti-mouse binding sites. After the directly conjugated second mouse primary antibody, subsequent detection is performed with an (indirect) enzyme labeled anti-fluorochrome or hapten or enzyme-labeled streptavidin (Figure 7) (van der Loos et al. 1989; van der Loos 1999). As such, directly labeled primary antibodies are commercially available mainly for fluorescent cell sorter system purposes, and many of those fluorochrome conjugates may also work in IHC. Applicability of this multistep double staining procedure has been valuable in several publications from our group (Naruko et al. 1996; de Boer et al. 1997; Hosono et al. 2003).
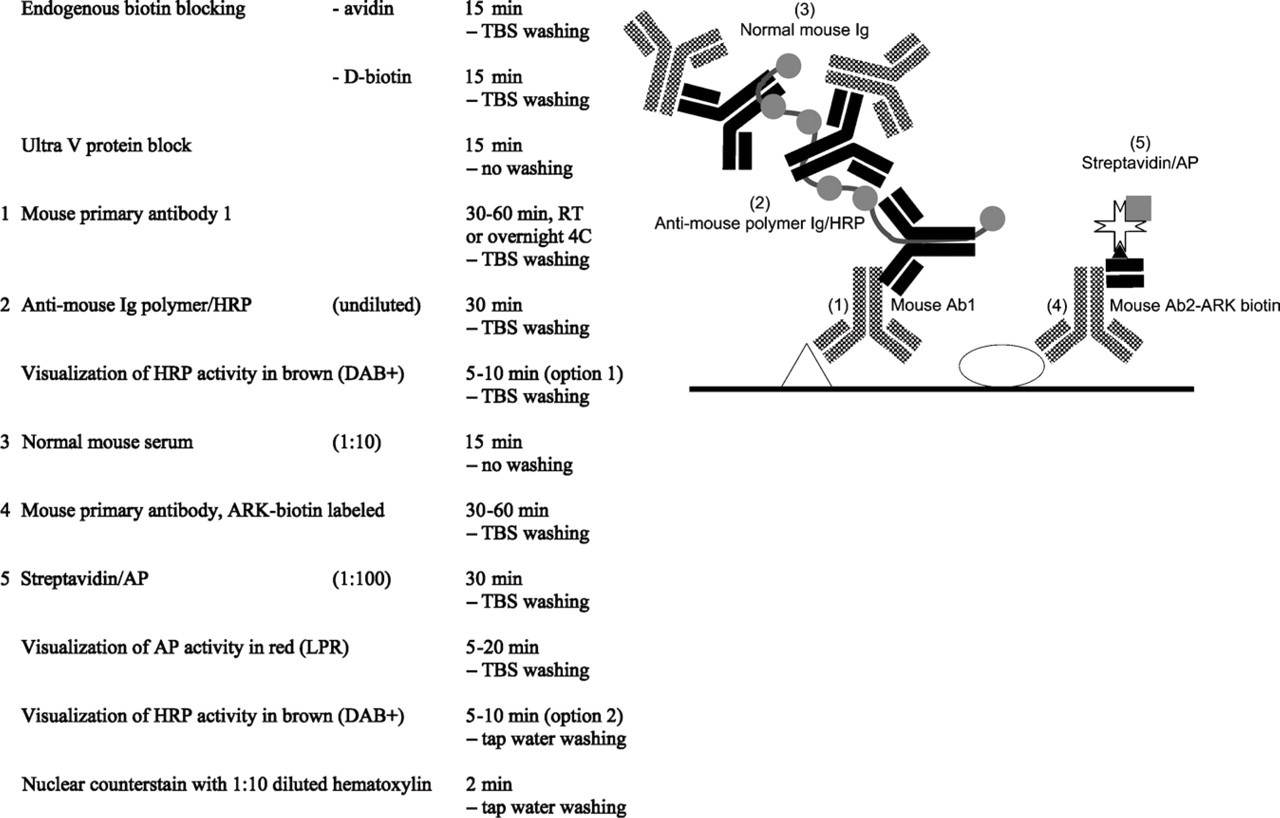
6. Whenever no directly conjugated mouse primary antibody is available, one may adopt the Animal Research Kit (ARK) in vitro labeling system. The ARK provides a biotinylated anti-mouse IgG Fab-fragment (biotinylation reagent) that is in vitro mixed with the primary antibody (15 min, room temperature). After blocking the unbound biotinylation reagent with normal mouse IgG (5 min, room temperature), a ready-to-use biotinylated primary antibody can be applied in the multistep indirect/direct protocol as described above (van der Loos and Göbel 2000) (Figure 8). Because the ARK contains an anti-mouse Fab fragment, this option is not available for primaries raised in other species.
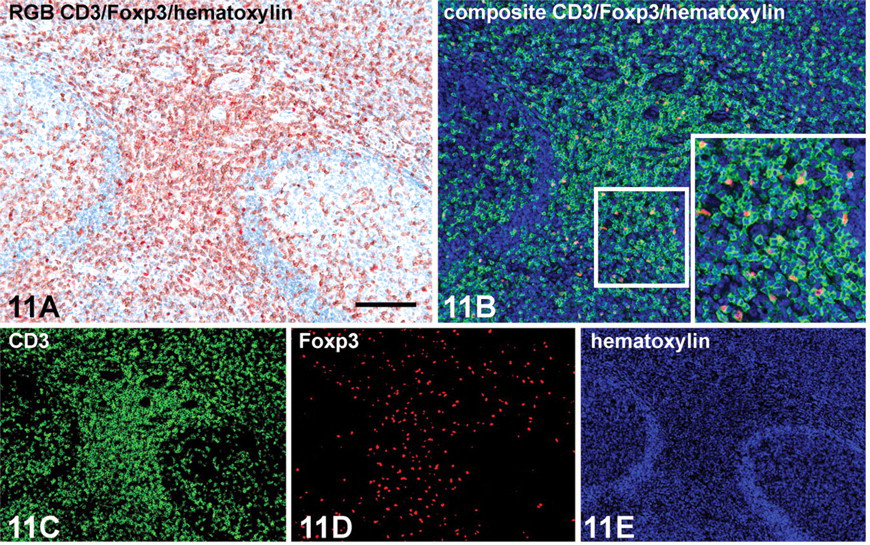
Microscopic detail of a hyperplastic tonsil (human) showing double immunoenzyme staining with CD3 (rabbit monoclonal SP7) and Foxp3 (mouse clone 236A/E7) antibodies on a formalin-fixed, paraffin-embedded (FFPE) tissue section. Indirect/indirect double staining protocol is based on primary antibodies of different animal species (Figure 1). (
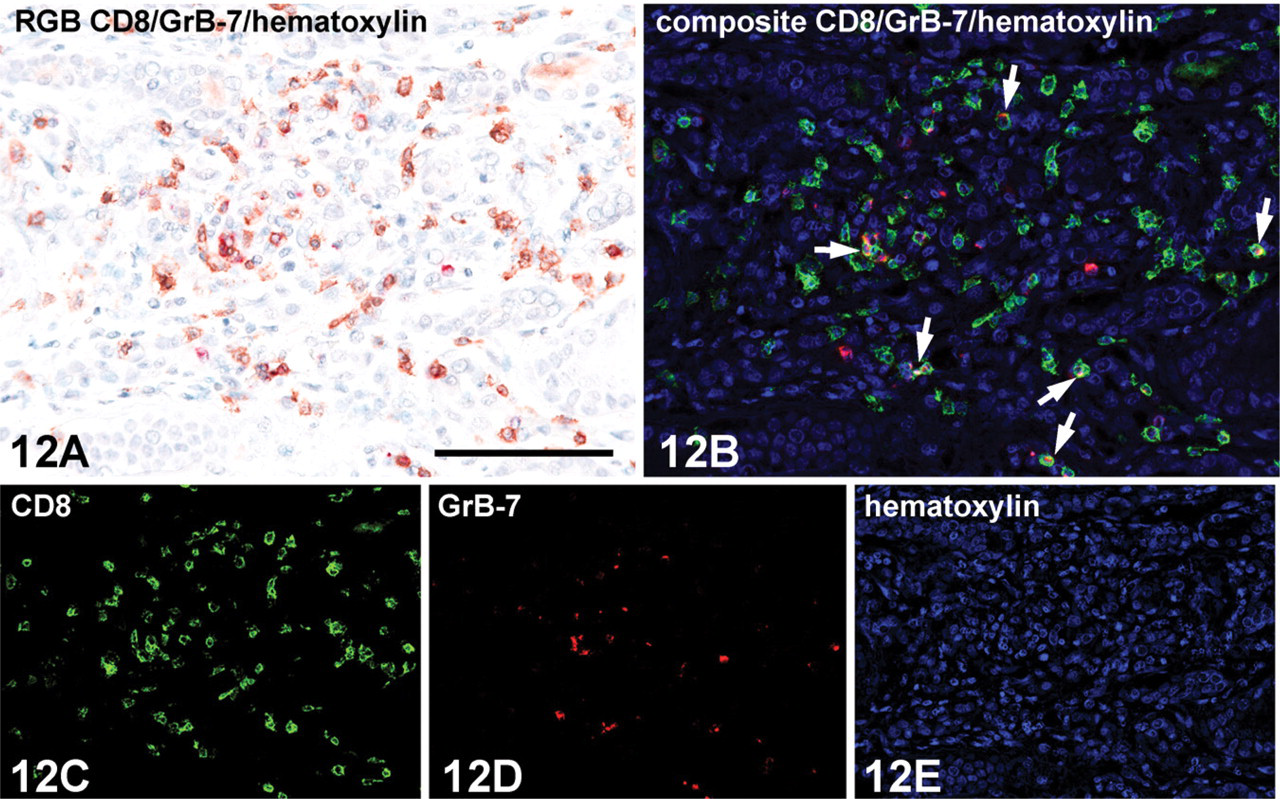
Microscopic detail of a rejected kidney transplant (human) showing double immunoenzyme staining with CD8 (mouse clone C8/144, IgG1) and Granzyme B-7 (mouse clone GrB-7, IgG2a) antibodies on an FFPE tissue section. Indirect/indirect double staining protocol is based on mouse IgG subclass difference (Figure 5). (
Expanding to Triple or Quadruple IHC
Any combination of suitable double staining combinations described above can be applied to set up quadruple IHC. A first staining sequence ends with development of HRP activity with DAB+ in brown and AP activity with LPR in red. To remove all immunoreagents involved with the first staining sequence, the specimens were subjected to a second HIER treatment (Lan et al. 1995) using a buffer of choice best fitting the second pair of primary antibodies. Obviously, this second HIER treatment only fits with FFPE sections and not with acetone-fixed cryostat tissue sections. A HIER treatment of 10 min at 98C was found to be sufficient to remove all antibodies. Remaining AP activity does not survive the second HIER treatment, and remaining HRP activity was blocked with 3% peroxide in TBS. The second double staining procedure involved the staining of AP activity in blue (Vector Blue) and HRP activity in purple (Vector VIP), in that order. For triple IHC staining, only Vector VIP is applied. Control experiments to monitor potential cross-reaction between the two double staining procedures consisted of a complete quadruple IHC staining procedure but omitting the second pair of primary antibodies.
Results
After double staining, the brown and red reaction products from HRP (DAB+) and AP (LPR) activities did not contrast visually. Colocalization by mixed color is exceptionally difficult to recognize. Control experiments replacing one or both primary antibodies by nonimmune Ig of the same species, Ig isotype, IgG subclass, and concentration yielded consistent negative results. These “half double staining” specimens served as a control sample for obtaining the individual spectra by the Nuance spectral imaging system. The individual spectra of DAB+, LPR, and hematoxylin from 460 to 660 nm acquired from these single stained samples and used as a spectral library are depicted in Figures 9 and 10. After loading this spectral library, the Nuance software is used to unmix spectral data cubes acquired from double stained specimens into three individual monochrome grayscale images, each of which shows the distribution and abundance of one of the chromogens. A pseudo-colored composite image is depicted in a simulated fluorescence mode for optimal visual contrast. As such, this unmixing was performed with three antibody combinations plus a nuclear counterstain as depicted in Figures 11–13.
Expanding double IHC staining into quadruple staining can be performed using LPR and DAB+ in the first staining sequence, followed by a second HIER step. Both LPR and DAB reaction products survive the heating step completely unchanged. After completing the quadruple staining with Vector Blue and Vector VIP chromogens, the four reaction products can be spectrally unmixed using the spectral library depicted in Figure 10. From Figure 14, it is clear that quadruple staining with CD3, CD20, CD68, and CD34 exclusively shows T cells, B cells, macrophages, and endothelial cells, respectively. Spectral imaging does not reveal any overlap between these four antibodies as is not expected for those four different cell types in a hyperplastic tonsil. Controls involving all steps of the quadruple IHC procedure with omission of the second pair of primary antibodies did not yield any staining with Vector Blue and Vector VIP. As such, this indicates no remaining AP or HRP activity and no cross-reactivity between the two double staining procedures.
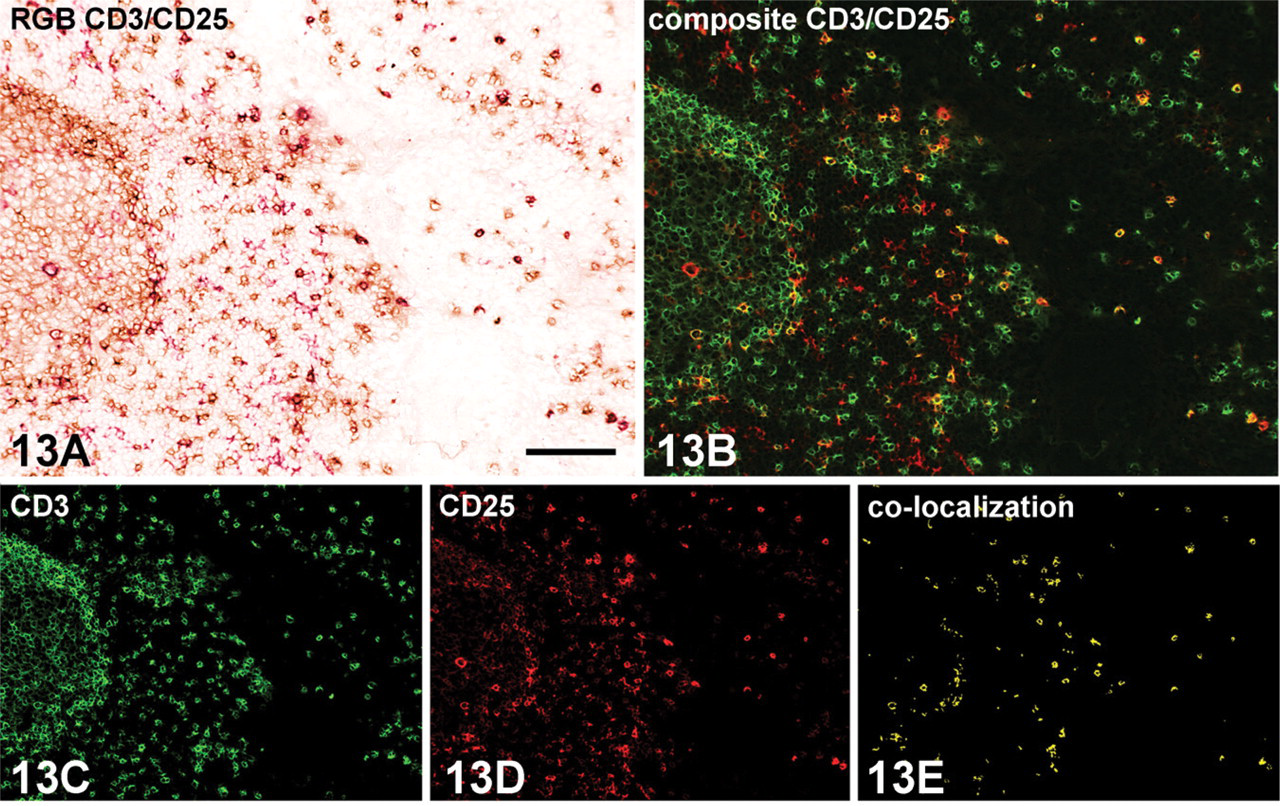
Microscopic detail of hyperplastic tonsil (human) showing a double immunoenzyme staining with CD25, interleukin-2 receptor (mouse clone ACT-1), and FITC-conjugated CD3 (mouse monoclonal SK7) on an acetone-fixed cryostat tissue section. Indirect/direct multistep double staining protocol is based on one unlabeled primary and one FITC-conjugated primary antibody (Figure 7). (
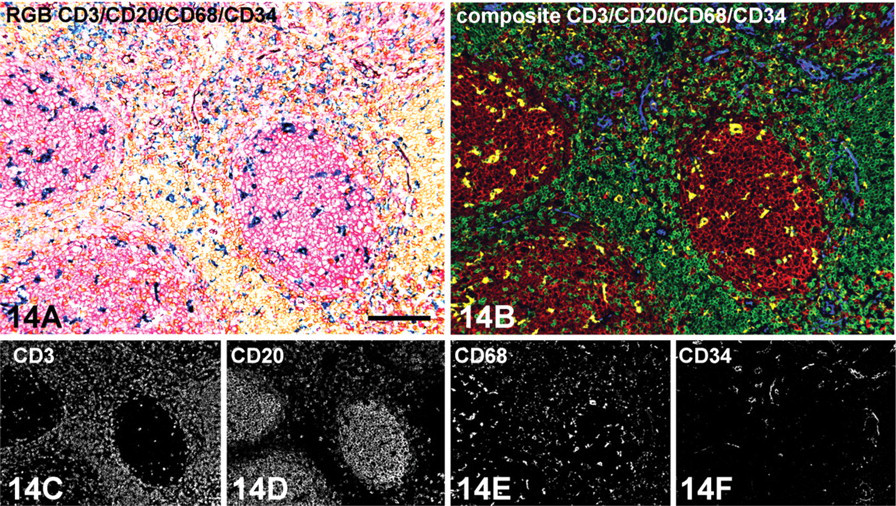
Microscopic detail of hyperplastic tonsil (human) showing a quadruple immunoenzyme staining with CD3 (rabbit monoclonal SP7), CD20 (mouse clone L26), CD68 (mouse clone PG-M1, IgG3), and CD34 (mouse clone QBend10, IgG1) antibodies on an FFPE tissue section. First, an indirect/indirect double staining protocol is performed based on primary antibodies of different animal species (Figure 1) with CD3 and CD20. Next, the section is subjected to a second heat-induced epitope retrieval procedure to remove immunoreagents from the first double staining procedure. Subsequently, a second indirect/indirect double staining protocol is performed based on mouse IgG subclass difference (Figure 5) with CD68 and CD34. (
Discussion
As expected, the brown–red color combination composed of the crisp reaction products from HRP (DAB+) and AP (LPR) activity plus hematoxylin nuclear counterstain is not useful for the observation of colocalization using the unaided eye. However, this color combination is a good basis for successful double staining using spectral imaging because the visual color contrast is no longer important. Based on the different spectral characteristics of both chromogens and the nuclear counterstain, it is possible to spectrally unmix the original observation into three different images, each displaying the distribution and abundance of the individual chromogen. The software facilitates the visualization of these different images by creating a composite image in different layers that can be shut on and off independently. In addition, this composite image can be displayed in a simulated fluorescence mode, which can aid visual assessment. This seems to be helpful for studying colocalization. In this context, it is also possible to show colocalization using either the Multiple Marker Molecular plug-in within the Nuance 2.4 software or import two individual images after unmixing into advanced imaging software (such as Image-Pro Plus, version 5.0; Media Cybernetics, Bethesda, MD) and perform a thresholded Boolean “AND-operation.” The resulting new image (Figure 13E) exclusively displays those pixels that show colocalization, whereas single staining is unseen here (de Boer et al. 2007a).
The success of unmixing the DAB and LPR reaction products is dependent on the staining intensities of the colored reaction products. An absolute prerequisite for successful spectral imaging is a relative transparency (or low optical density) of the colored reaction products. This is especially true for DAB, whose reaction product suffers from the problem that it clogs at high staining intensities, yielding a dark brown deposit. This dark brown reaction product has different spectral characteristics compared with the transparent yellow–brown reaction product. For example, dark DAB deposits will be “missed” after unmixing using a spectrum created from a moderate yellow–brown DAB deposit. Moreover, spectra from any dark chromogen deposit tend to be similar and will therefore “bleed” into other chromogen layers after spectral unmixing.
The brown DAB reaction product is not a true absorber of light, but a scatterer of light, and has a very broad, featureless spectrum (Figure 9). This means that DAB does not follow the Beer-Lambert law, which describes the linear relationship between the concentration of a compound and its absorbance, or optical density. As a consequence, darkly stained DAB has a different spectral shape than lightly stained DAB. In addition, this type of spectrum is sometimes hard to discriminate from other spectra of light-scattering materials using the Nuance software. For example, the spectrum of DAB is similar to that of melanin, and the two can hardly be unmixed (van der Loos, unpublished data). In contrast, the LPR reaction product is a true absorber of light and follows the Beer-Lambert law.
Having different spectra at different staining intensities of the chromogen also creates a potential problem with quantification of the immunostaining results. In this respect, the DAB chromogen is less suitable for quantification than, for example, LPR, which shows very similar spectra at high and low staining intensities (Figure 9), as is expected from a compound that follows the Beer-Lambert law.
The concerns about the DAB reaction product mentioned above certainly do not exclude DAB from a double staining application unmixed by spectral imaging. Its crisp reaction product is ideal for a good microscopic resolution, and dark brown staining intensities can be simple avoided by diluting the primary antibody of interest. Furthermore, it is observed that other HRP chromogens (3-amino-9-ethylcarbazole, Vector NovaRed) share similar problems as seen with the DAB reaction product (van der Loos, unpublished data).
In this study, three different chromogens (DAB, LPR, hematoxylin) could simply be unmixed by spectral imaging. This therefore raises the question of whether spectral unmixing would work for combinations of four or five colors. Because the enzymatic reaction products are visualized one by one, layering of more chromogens may lead to a generalized “darkening” of the specimen. As such, this does not fit with the concept described above that spectral imaging works ideally with transparent chromogens. However, surprisingly, the first tests with quadruple IHC, composed of LPR and DAB+ (in the first sequence) and Vector Blue and Vector VIP (in the second sequence) showed that spectral unmixing is feasible when moderate staining intensities of the individual chromogens have been applied. However, the set-up of triple and quadruple IHC staining protocols inherits many technical problems (van der Loos 1999). Most promising seems a sequential multi-staining technique in which the immunoreagents from the first double staining procedure are removed by a HIER step (Lan et al. 1995; Van den Brink et al. 2000) and continue with either single staining (for triple IHC) or another double staining procedure (for quadruple IHC). Figure 14 shows that, although antibodies from the same species are involved in the first and second double staining sequence, no overlapping staining patterns were found because of cross-reactivity.
In conclusion, spectral imaging is a true asset for the analysis of immunoenzyme multiple staining specimens. Whenever chromogens are applied ensuring moderate staining intensities, multiple staining can be perfectly unmixed in individual TIF images. These individual images can be subjected to standard imaging procedures and colocalization can be exclusively visualized using a Boolean “AND” operation. Good multiple staining methods, up to four different markers, inconcert with spectral imaging analysis, opens the way to understand the more complex relationships in all kinds of cellular processes.
Footnotes
Acknowledgements
The author thanks Alton D. Floyd, PhD (Edwardsburg, MI), and Jim R. Mansfield (CRi, Woburn, MA) for helpful suggestions and critical reading of this manuscript.