
Abstract
Formalin-fixed paraffin-embedded tissue (FFPET), which is the most widely used pathology archive, usually has low-quality DNA and RNA due to extensive nucleic acid crosslinking. RNA fluorescence in situ hybridization (RNA-FISH) has been increasingly utilized in research and clinical settings to diagnose disease pathology. In this study, the effect of RNA degradation over archival time on RNA-FISH signals in FFPET and fresh frozen tissue (FFT) was systematically assessed. RNAscope multiplex fluorescent assay with the four house-keeping-gene (HKG) probes UBC, PPIB, POLR2A, and HPRT1 was performed on 62 archived breast cancer samples (30 FFPETs and 32 FFTs). As expected, the number of RNAscope signals in FFPETs is lower than in FFTs in an archival duration-dependent fashion. The RNA degradation in FFPETs is most pronounced in high-expressor HKGs, UBC and PPIB, than in low-to-moderate expressors POLR2A and HPRT1 (p<0.0001). Analysis of RNA expression over time showed that PPIB, which has the highest signal, was the most degraded in both adjusted transcript and H-score quantification methods (R2 = 0.35 and R2 = 0.33, respectively). This proves that although the RNAscope probes are designed to detect fragmented RNA, performing a sample quality check using HKGs is strongly recommended to ensure accurate results:
Introduction
Formalin-fixed, paraffin-embedded tissue (FFPET) is the most common type of archived tissue in routine pathology practice. 1 This archival method allows long-term preservation of tissue histomorphology. FFPET can be used to perform immunostaining for molecular pathological diagnosis.1,2 However, formalin fixation causes cross-linking and fragmentation of DNA and RNA, leading to a lower quality of nucleic acids isolated from FFPET.3,4 Formalin fixation in FFPET can induce spontaneous C: G>T:A changes due to cytosine deamination. 5 Another archival method is fresh frozen tissue (FFT) biobanking by using liquid nitrogen (snap frozen) or Optimal Cutting Temperature (OCT) cryo-gel.6,7 Although biobanking with FFT can preserve nucleic acids better than FFPET, it requires extremely low-temperature storage, such as −80C freezer or liquid nitrogen tank, making it more expensive than FFPET.2,6,7 FFT is also more cumbersome to handle compared with FFPET.
In clinical practice, immunostaining, such as immunohistochemistry (IHC), is commonly used alongside routine staining like hematoxylin and eosin (H&E) or Wright-Giemsa to aid in diagnostic and treatment decisions. 8 However, the reliability of immunostaining can be affected by the lack of standardization across different centers, leading to potential false positives or false negatives. 9 Protein expression is also influenced by post-transcriptional and post-translational modifications, meaning a negative result may not rule out a disease.10,11 To address this problem, RNA expression assays on tissue sections, such as RNA in situ hybridization (RNA-ISH), can serve as a companion diagnostic option. Quantitative RNA-ISH can be used to confirm ambiguous IHC results, such as when determining equivocal HER2 status in breast cancer. 12 Unlike other molecular techniques, such as RT-qPCR and next-generation sequencing (NGS) that analyze bulk tissue samples, RNA-ISH can be performed while retaining tissue morphology. 13 This method incorporates spatial information into RNA expression data; therefore, one can more comprehensively understand biological functions and disease pathology.13,14 This is because pathological changes can vary by cell type and location in distinct tissues and organs. 14 Spatial transcriptomics has increasingly been applied to cancer and neurological disease research.15–18 RNA-ISH is a targeted spatial transcriptomics method for detecting RNA at a single-cell level on tissue sections, allowing quantifiable in situ visualization. 19 Fluorescent labeling of in situ hybridized RNA (RNA-FISH) enhances assay sensitivity, as demonstrated in the RNAscope assay.20,21 RNAscope is a non-radioactive method that improves sensitivity and specificity over conventional RNA-ISH techniques. 20 Studies using RNAscope have been conducted in various cancers, including breast and lung, HPV-related oropharyngeal carcinoma, COVID-19, and neurological conditions involving human brain tissue.12,21–26 The RNAscope probe for HPV detection is now approved by the European Conformity as companion diagnostic (Conformité Européenne-in vitro diagnostics; CE-IVD) for head and neck cancer. 27
Despite its advantages, RNA-FISH application in research and clinical settings, particularly with archived pathology tissues like FFPET, can be hindered by low RNA quality. 28 Therefore, RNA-FISH assays, such as RNAscope, require protocol standardization, including methods to quantify and analyze results with minimal bias. Besides, tissue quality should be checked by running an assay with known house-keeping genes (HKGs) as reference when performing RNAscope. 29
Three major pre-analytical factors contribute to protein integrity and RNA quality in FFPET samples: ischemia, formalin fixation (time and buffer), and tissue processing.30,31 RNA is better preserved with shorter ischemia, optimal fixation time (12–24 hr), and longer tissue processing. 30 Apart from these factors, RNA quality in FFPET is also influenced by surgical protocols, specimen transport, archival duration, and conditions such as temperature and humidity.32–34 Furthermore, tissue types and their anatomical locations have been shown to affect RNA quality. 35 Some of these factors, such as ischemia time, may not be routinely recorded in clinical practice. However, breast cancer tissue generally has more controlled cold ischemic times and fixation durations compared with other tumor types because of the negative effect of these factors on HER2 testing. 36 Therefore, breast cancer tissue serves as a good model to assess the influence of other pre-analytical factors, such as archival duration, on the RNA quality of archived samples.
In this study, RNA-FISH targeting four HKGs, namely UBC, PPIB, POLR2A, and HPRT1, was performed on human breast cancer FFPET and FFT samples using the RNAscope multiplex fluorescent v2 assay to assess the quality of RNA-FISH signals in archival FFPET and FFT samples over time.
Materials and Methods
Clinical Samples
This is a retrospective study that utilized archived tissues from breast cancer patients. The research protocol was approved by the Human Research Ethics Committee, Faculty of Medicine, Ramathibodi Hospital, Mahidol University (COA. No. MURA 2024/492). A total of 30 breast cancer FFPETs, archived between 2013 and 2020 at the Department of Pathology, Faculty of Medicine, Ramathibodi Hospital, Mahidol University, were used. In addition, 32 breast cancer FFTs collected between 2014 and 2021 at the Ramathibodi Comprehensive Tumor Biobank (COA. No. MURA2018/58) were included. Informed consent was obtained from all patients involved. Among these samples, there were eight cases with matched FFPETs and FFTs. FFPET blocks were prepared by the Department of Pathology following the protocol recommended by the College of American Pathologists (CAP), using 10% NBF as a fixative and the standard fixation time for breast cancer. 36 FFPET fixation time was not controlled in this study. The ischemic time was not recorded, and the blocks were stored at room temperature. Available FFPET blocks and FFT samples were selected after their respective H&E-stained slides were reviewed by a pathologist, with the criterion that the tissues must contain more than 50% cancer cells to minimize selection bias. Two slide sections for each FFPET or FFT block were prepared, with tissue thicknesses of 4 and 7 µm, respectively. The section thickness for FFT samples was optimized before the RNAscope experiments. All tissue sections were mounted onto Superfrost Plus slides (VWR, Radnor, PA, Cat. No. 48311-703).
RNA Extraction and Integrity Assay
For FFT samples, additional trimmed tissues were collected for RNA extraction. Total RNA was isolated from FFT using RNeasy Mini Kit (Qiagen, GmbH, Hilden, Cat. No. 74104) according to the manufacturer’s protocol. RNA purity and concentration were assessed using the NanoDrop2000 (Thermo Fisher Scientific), while RNA integrity assay was evaluated using the TapeStation 2000 (Agilent Technologies).
RNAscope Multiplex Fluorescent v.2 Assay
This study used the RNAscope Multiplex Fluorescent v2 kit (Advanced Cell Diagnostics, Newark, CA, Cat. Nos. 323100 and 323120) to perform RNA-FISH on tissue slides. Different pre-treatment steps were applied to tissue sections, depending on the sample type, before the RNAscope assays. 21 FFPET slides preparation began by baking the slides using HybEZ II Oven (Advanced Cell Diagnostics, Newark, CA, Cat. No. 321720), while FFT began with tissue fixation using 4% paraformaldehyde (PFA). The fixation conditions for FFT slides (4% PFA at room temperature for 20 min) were optimized before performing the RNAscope experiments (Appendix Fig. 1A-C). FFPET samples also required additional antigen retrieval procedures conducted at 98C–102C, as recommended in the protocol. 21
Following pre-treatment, RNAscope multiplex fluorescence assays were performed according to the manufacturer’s protocol using four HKGs (UBC, PPIB, POLR2A, and HPRT1) as positive targets and bacterial dapB as a negative control. 37 These genes exhibit different mRNA expression levels, which serve as standards for multiplex RNA-FISH qualification. 29 UBC and PPIB are high expressors, while POLR2A and HPRT1 are moderate to low expressors.29,38 This was followed by probe hybridization, signal amplification, fluorescence staining, and signal development. Four fluorophores were used to label hybridized probes, including Opal 520, 570, 620, and 690 (Akoya Biosciences, Marlborough, MA, Cat. No. FP1487001KT, FP1488001KT, FP1495001KT, and FP1497001KT, respectively). ProLong Gold antifade reagent (Invitrogen, Eugene, OR, Cat. No. P36930) was used to mount coverslips.
Image Scanning and Field Acquisition by Vectra Polaris and Phenochart
Image acquisition of RNAscope multiplex fluorescent slides was performed within 2 weeks after completing the RNAscope assays, using the Vectra Polaris Automated Quantitative Pathology Imaging System (Akoya Biosciences, Marlborough, MA). Tissues were visualized at 20× to 40× magnification and assessed for tissue and cell morphology. According to the ACD guideline for RNAscope, 1 dot per 10 cells displaying dapB negative control staining (background) at 20× magnification is acceptable. The Vectra Polaris acquisition protocol was established using negative control slides and positive targets of four HKGs in each channel, namely DAPI, Opal 520, 570, 620, 690, and autofluorescence. The optical lens for scanning was set to 40× magnification, and RNAscope slides were scanned in batches. Focus points were automatically determined for each slide before scanning. The Vectra Polaris scanning system excluded tissue autofluorescence from the sample signals. Scanned image files from Vectra Polaris were loaded into Phenochart software (ver. 1.1.0, Akoya Biosciences, Marlborough, MA) and three to five regions of interest (ROIs) per sample were captured at 40× magnification for subsequent analysis. Separate images of each channel were captured for each ROI.
Image Processing and Analysis With CellProfiler
CellProfiler software (ver. 4.2.1, Broad Institute, Harvard-MIT) was used to analyze multiplex fluorescent ROI images obtained from Phenochart. Two in-house pipelines were developed, based on a previously published RNAscope multiplex fluorescent pipeline by Erben et al., and tailored to assess FFPET and FFT samples.21,39 For FFT samples, the analysis pipeline was divided into two types, clumped and non-clumped, to address the challenge of crowded and overlapping cells. Five fluorescent channels corresponding to five captured Phenochart images (DAPI, 520, 570, 620, and 690) were assigned using the NamesAndTypes module. ColorToGray modules were used to convert all signals to grayscale. IdentifyPrimaryObject modules were used to identify nuclei and puncta (by channel) as primary objects. All channels were labeled according to the corresponding genes assigned in the RNAscope experiment. IdentifySecondaryObject modules were used to define cellular parameters as secondary objects. FilterObjects and RelateObject modules were used to assign puncta to primary or secondary objects for subsequent measurements, quantifications, and data export.
Data Processing
Data processing and analysis were performed to assess the number of cells and mRNA signals, represented as punctate (dots). RNA expression levels were determined using two approaches: total transcript count adjusted to 1000 cells and the ACD H-score. 40 ACD H-scores were calculated by categorizing the transcript count per cell for each gene into bin 0 to 4 (0, 1–3, 4–9, 10–15, and >15 transcripts/cell, respectively). The percentage of each bin was multiplied by predefined weighted values (0, +1, +2, +3, and +4 for bins 0–4, respectively). H-scores were calculated as the sum of all weighted values across four genes (Appendix Table A1).
Principal Component Analyses (PCA)
PCA was performed using R package “stats” (version 4.4.1) with function on the normalized transcript count of all samples to see if the data could be separated by sample type. RNAscope results were categorized by the three archival times, 0–3, 4–7, and ≥8 years, to assess the effect of archival duration on mRNA expression.
RNA In Situ Degradation Rate Analysis
RNA expression profiles detected on tissue sections were compared with those from a breast cancer cohort in the TCGA Pan-Cancer Atlas (https://www.cbioportal.org, last accessed November 13, 2022). 41 The TCGA Pan-Cancer Atlas data used in this study were derived from high-quality breast cancer FFTs with an RNA integrity number (RIN) > 7 and generated using RNA sequencing. 42 Stability evaluations of mRNA expression in FFPET and FFT samples were assessed using the online in silico NormFinder algorithm (http://blooge.cn/RefFinder/?type=reference, last accessed August 9, 2022). 43 The correlation between RNAscope results and RINs was assessed for FFT samples.
Statistical Analyses
Statistical tests were performed using R (ver. 4.2.1). Descriptive statistics included data distribution and normality tests for both FFPET and FFT samples. RNA expression levels between sample types were compared using an unpaired Wilcoxon rank-sum test. Correlation of RNA expression in matched FFPET and FFT samples was assessed using the Spearman correlation test. Statistical significance was defined as p≤0.05. p values were displayed as ns, *, **, ***, and ****, denoting p>0.05, ≤0.05, ≤0.01, p≤0.001, and ≤0.0001, respectively.
Data Availability
The raw RNAscope multiplex fluorescent quantitative data for this study are available in the Supplementary Data (Appendix Table A2).
Results
RNA-FISH Signal Assessment on Archived FFPETs and FFTs
A total of 62 archived human breast cancer samples were processed using the RNAscope Multiplex Fluorescent v.2 Assay (Fig. 1A). The assay was able to detect the four HKG mRNAs in 86.7% (26/30) of FFPET samples and 100% (32/32) of FFT samples. Optimization of FFT section thickness demonstrated that 7 µm provided better RNA-FISH signal clarity than 10 µm (Fig. 1B-C). Analysis of at least five random ROIs, each with an area of 0.1275 mm2, indicated no significant difference in cell numbers between the 10- and 7-µm FFT sections (p=0.43) (Fig. 1B-C). Dot quantification revealed that PPIB signals, the highest expressor in the FFT cohort, were better separated in the 7-µm section, allowing for more accurate counting (p=0.032) (Fig. 1C). The difference in thickness between FFT (7 µm) and FFPET (4 µm) also did not result in a significant difference in cell counts (p=0.73) (Fig. 1D-E).
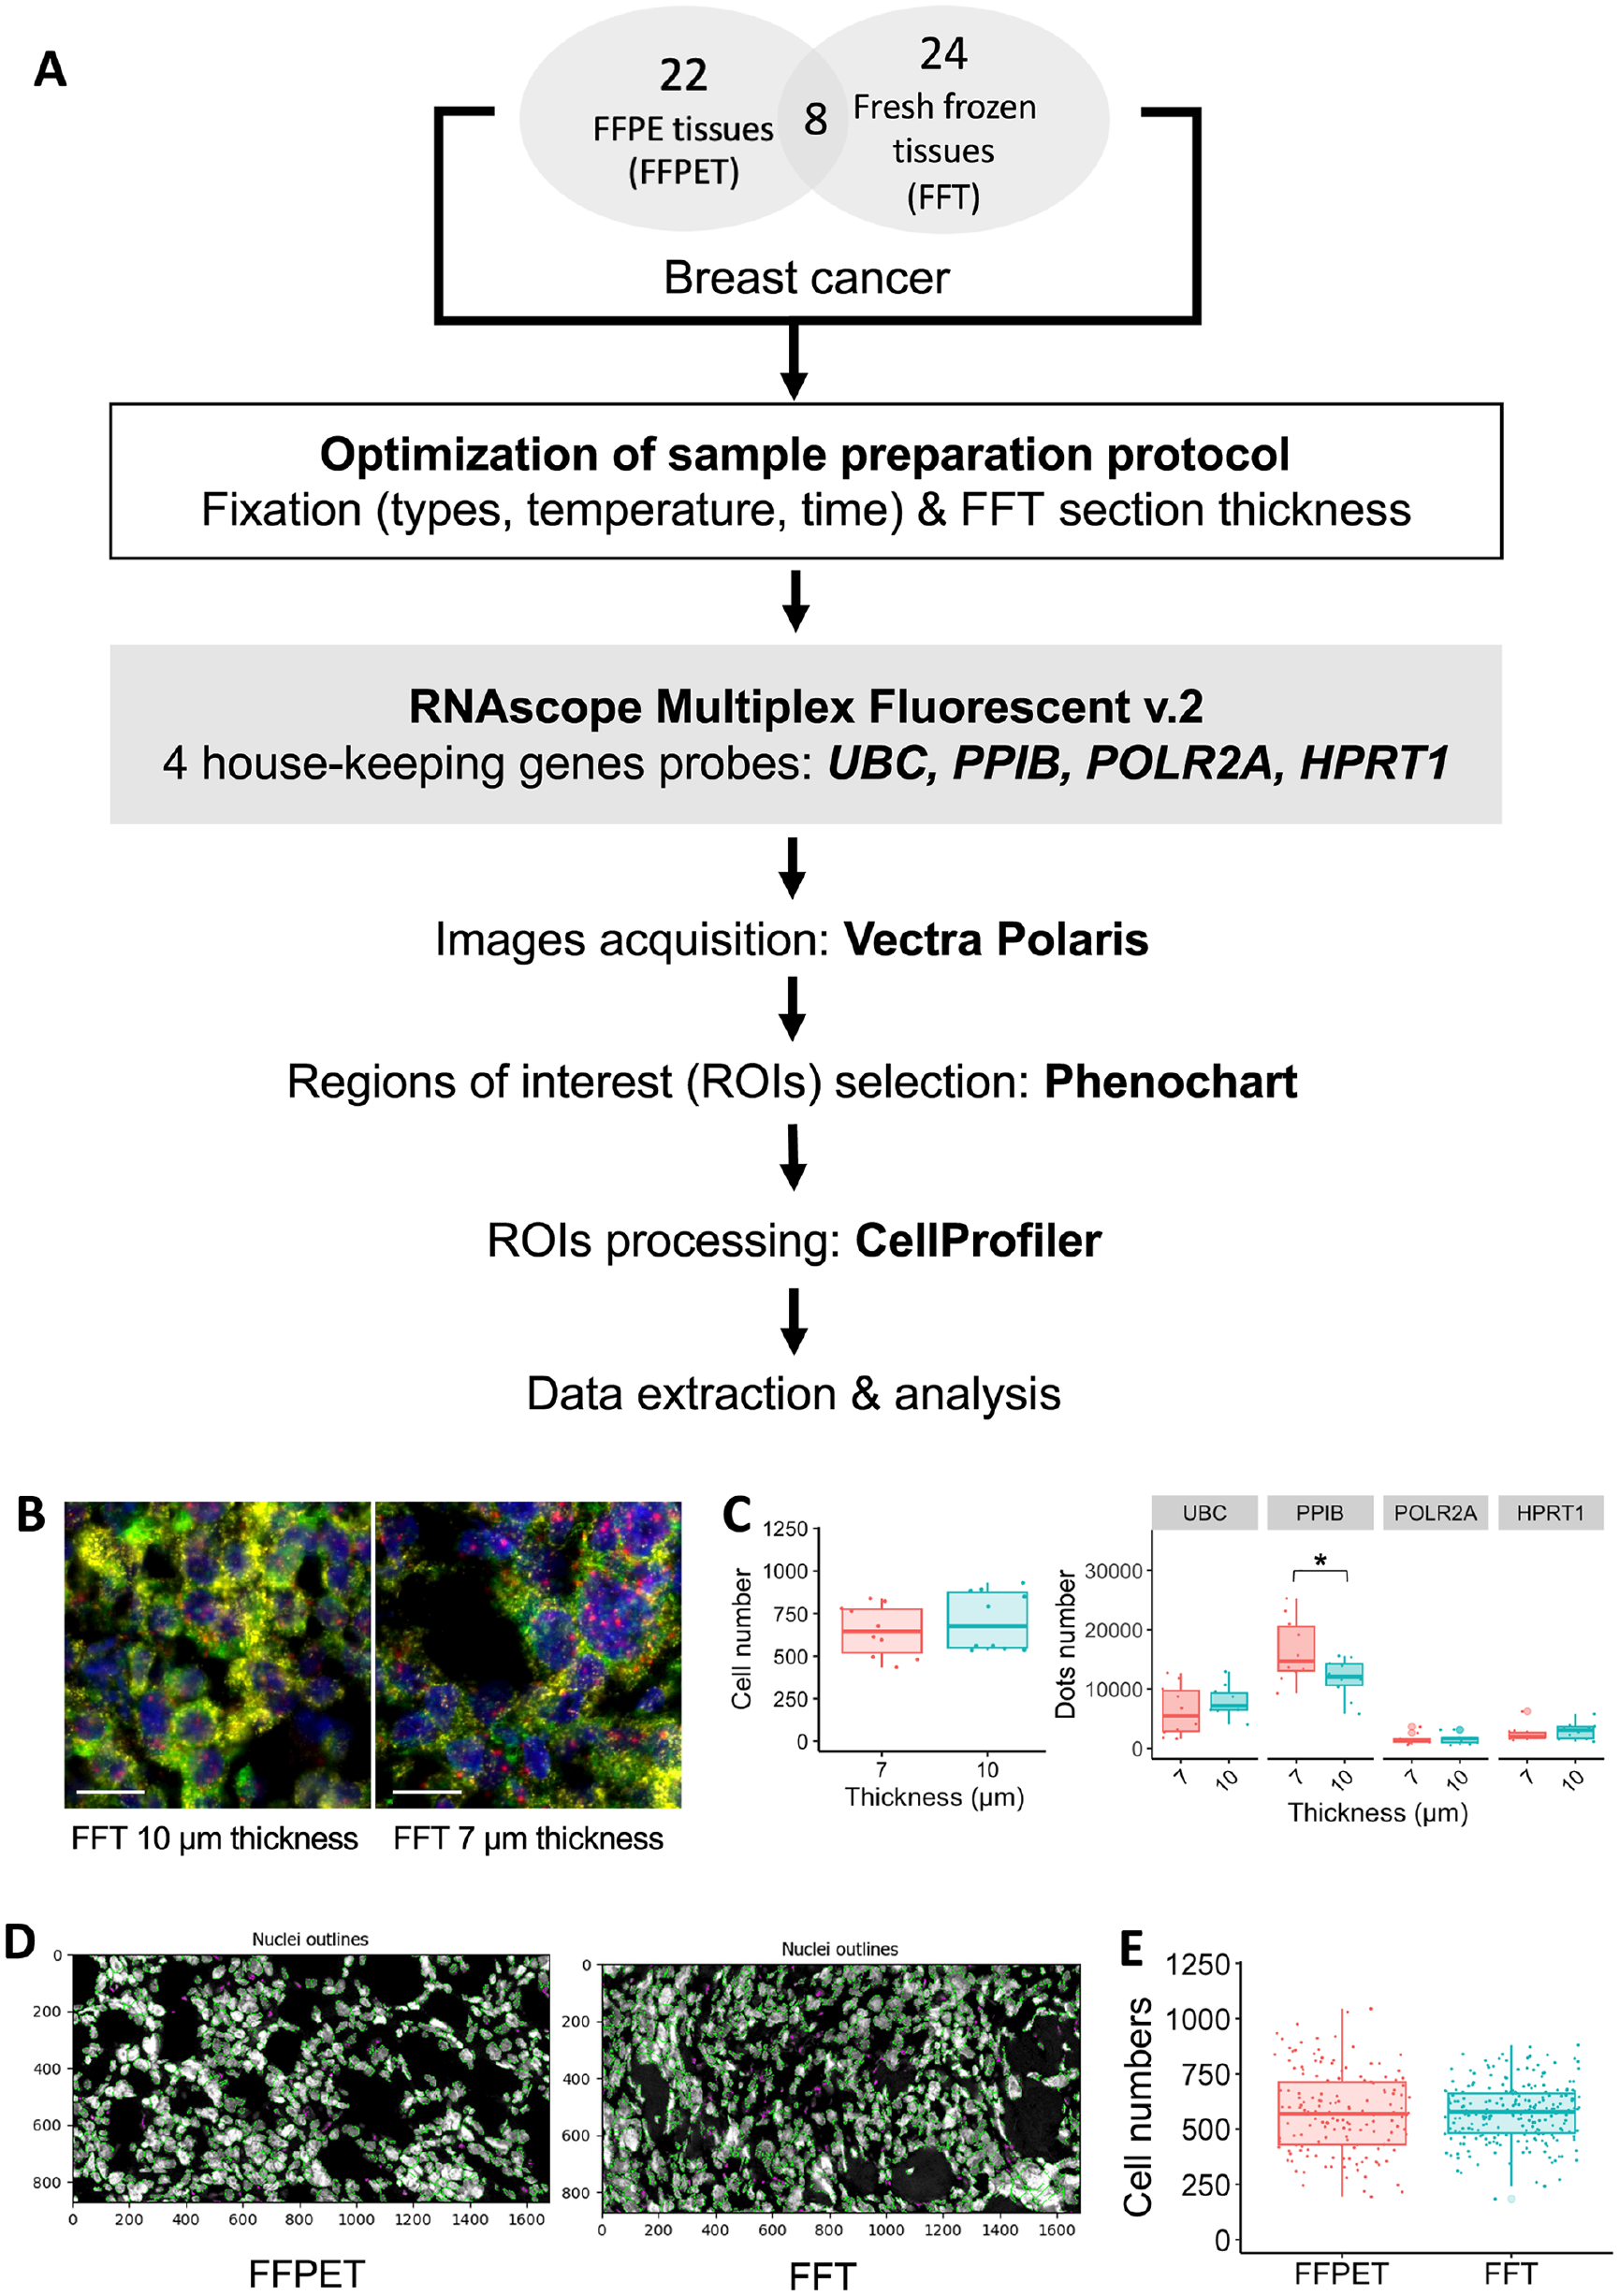
Multiplex RNA Fluorescent In Situ Hybridization (RNA-FISH) using RNAscope assays on human breast cancer tissues. (A) Overall research workflow. (B-C) Section thickness optimization in FFT samples (10 and 7 µm): representative fluorescent images of each thickness (B) and quantification of cell number and dot counts (C) Scale bar = 20 µm. (D-E) Cellularity analysis of the FFT compared with FFPET sections: nuclei identification by CellProfiler (D) and quantification of cell number in both sample types (E).
RNAscope multiplex fluorescent images from FFPET samples showed sharper signals than FFTs (Fig. 2A), likely because the FFT tissues were sectioned thicker. The adjusted total transcript count for all HKGs in Fig. 2B indicated that RNA expression detected in FFTs was higher than in FFPETs (p<0.0001). When classified into five bins, FFPET had a higher percentage of bin 0 for all four genes compared with FFT (p<0.0001) (Fig. 2C). The H-scores for each gene in FFT were also higher than in FFPET (p<0.0001) (Fig. 2D).
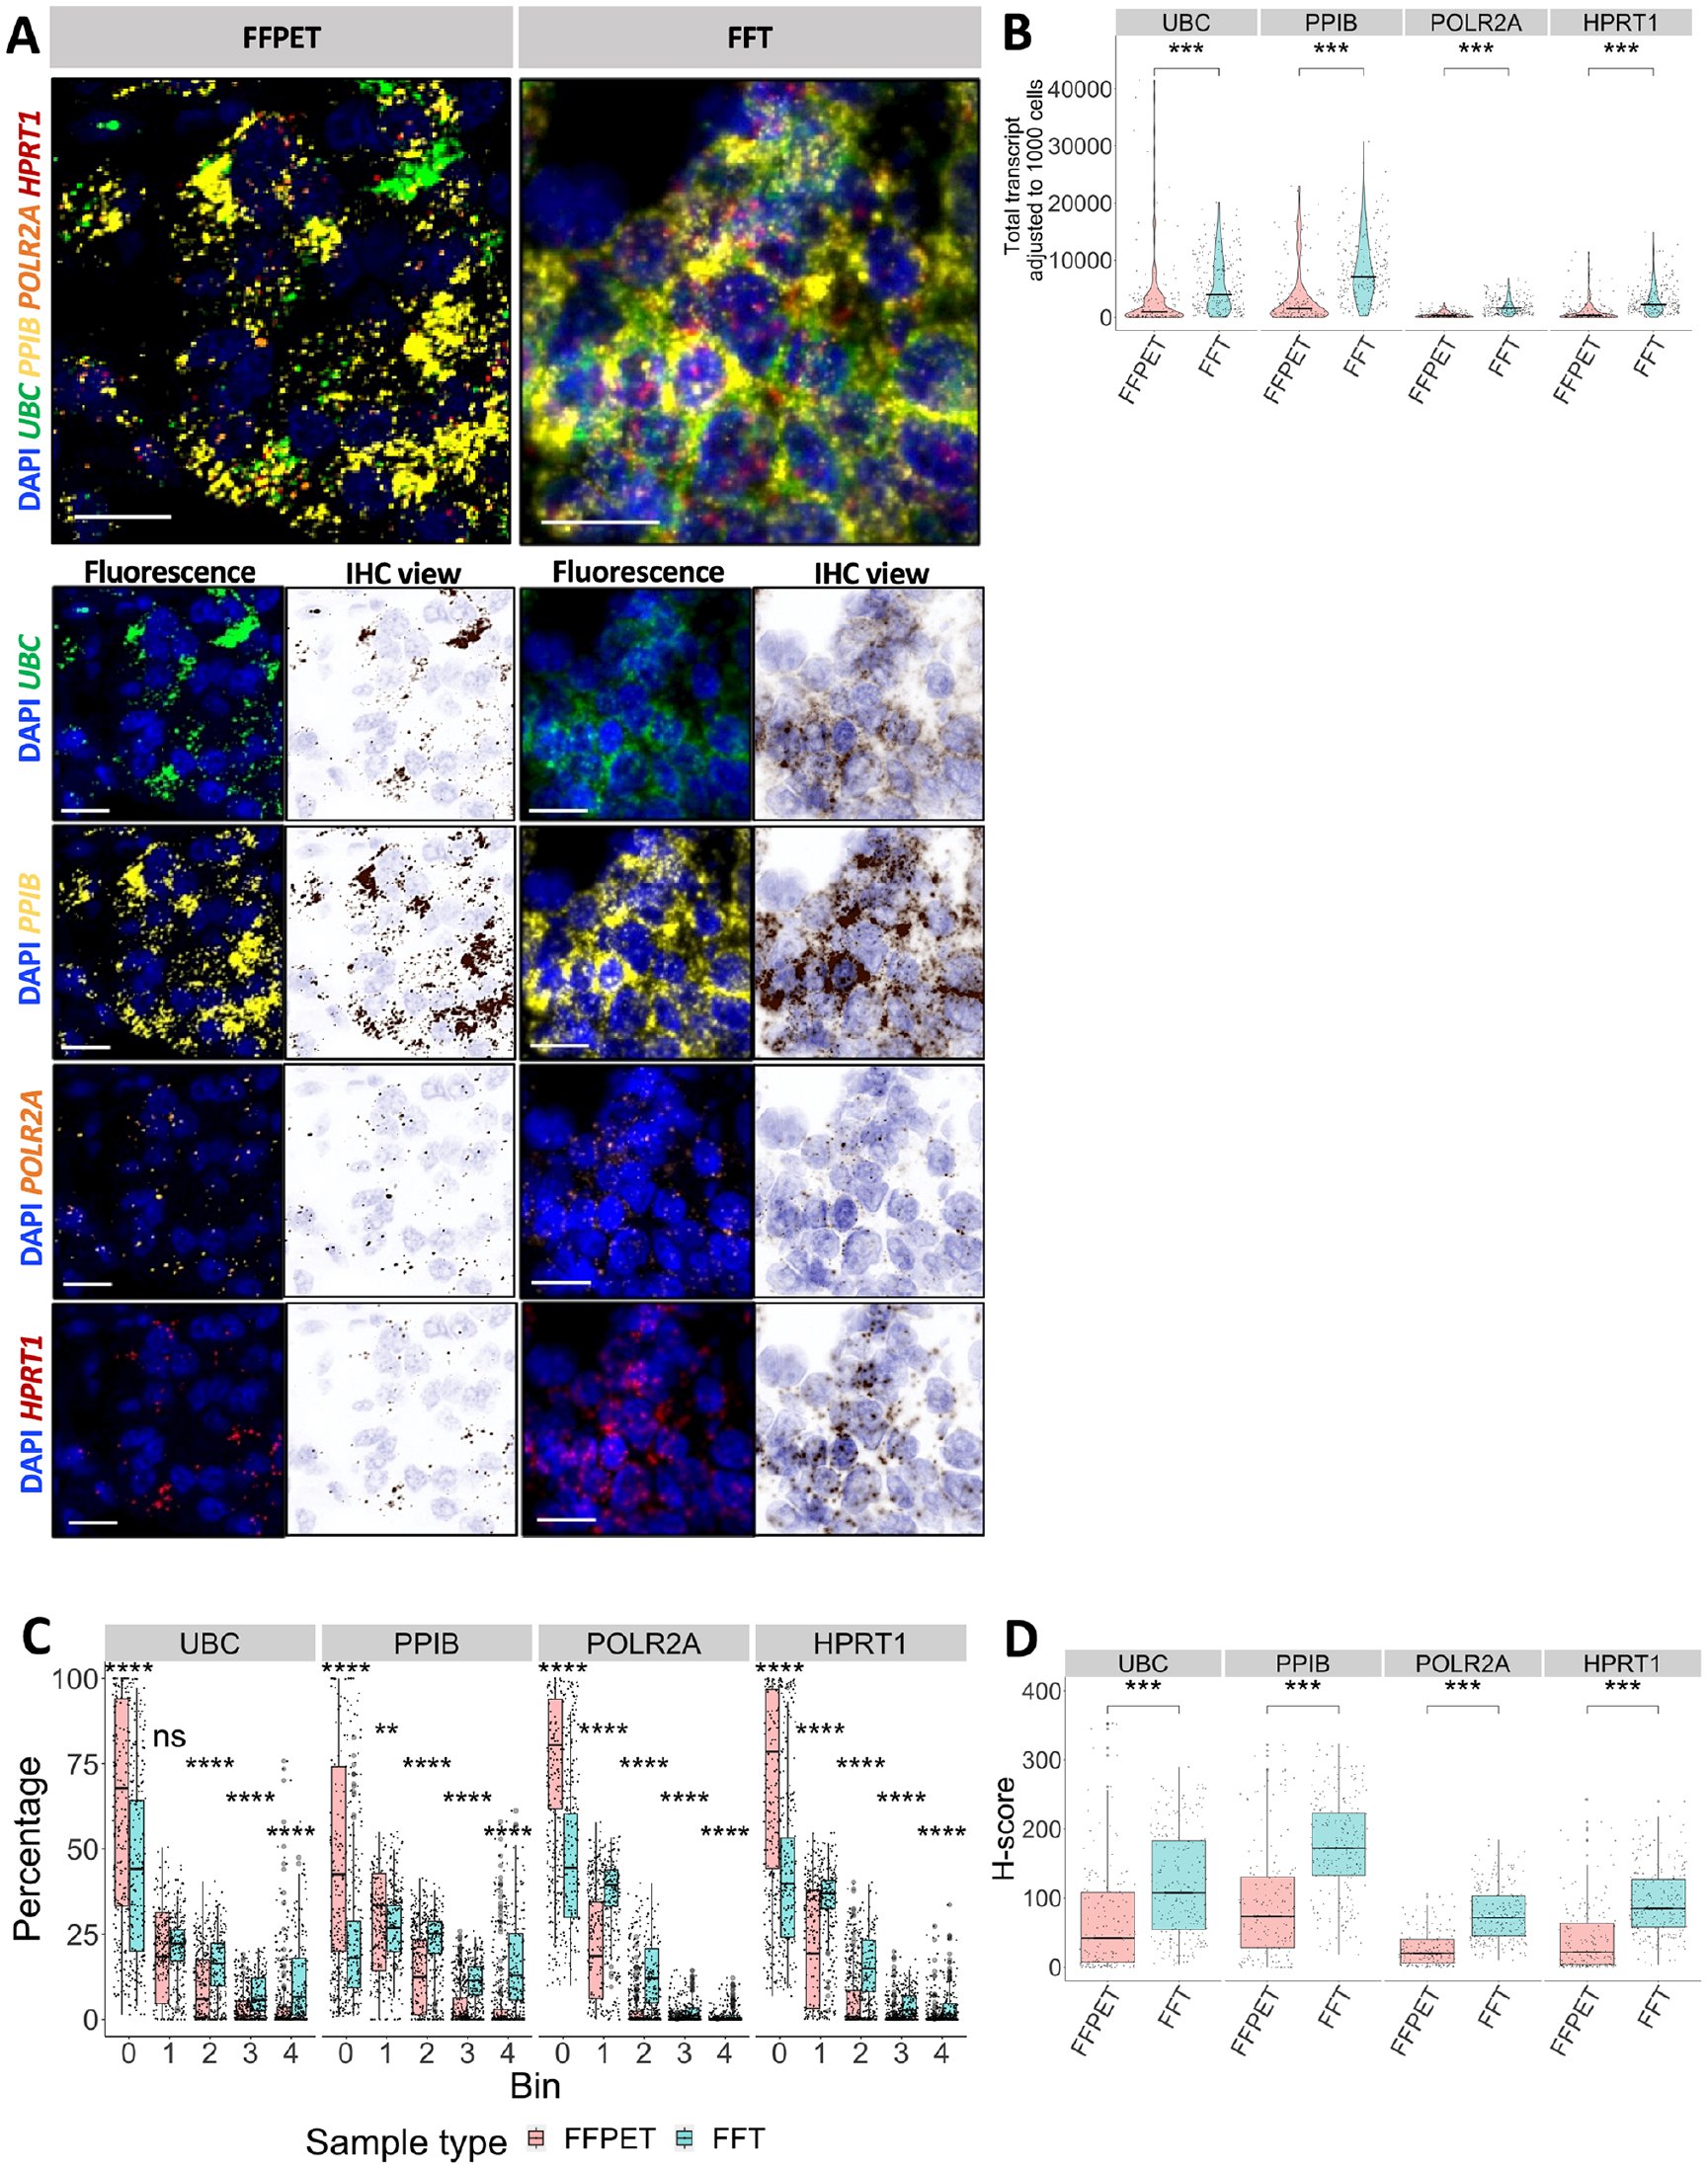
Quantification of the detected RNAscope signals in FFPET and FFT samples. (A) Images acquired from Vectra Polaris and visualized by Phenochart, showing in situ expression of the four house-keeping genes (HKGs): UBC, PPIB, POLR2A, and HPRT1. FFPE tissues (FFPETs) are shown on the left, and fresh frozen tissues (FFTs) on the right. For each gene channel, fluorescence and IHC mode views are shown. RNA expression is represented by punctate (1 punctate = 1 transcript). Scale bar = 20 µm. (B) Violin plots of the HKG expression levels as normalized total transcript counts (adjusted to 1000 cells) in both sample types: FFPET (n=30) and FFT (n=32). The low number of transcripts is more commonly seen in FFPETs than FFTs. Black crossbars = medians. (C) The proportion of binned groups according to ACD criteria 36 used to calculate H-score. FFPET has a higher bin 0 proportion than FFT. (D) Box plots of gene expression in H-score. Jitter represents individual region of interest (ROI). p values were determined by unpaired Wilcoxon rank-sum test.
Further comparison of in situ RNA expression between FFPET and FFT was conducted using eight pairs of matched samples in the two cohorts. This analysis aimed to minimize inter-individual differences in gene expression, as the matched samples came from the same patients preserved using two different methods (FFPET and FFT). Considering the tissue archival durations, Fig. 3A showed that fluorescent signals detected in FFTs were generally brighter than those in FFPETs. However, while older FFT samples generally showed higher transcript counts for the four HKGs compared with FFPETs with the same archival duration, the most recent samples (2 years of archival duration) showed no significant difference in expression between FFPETs and FFTs (Fig. 3B). In addition, the strongest correlations in HKG expression levels observed between the two sample types were also found in the 2-year group (correlation coefficient 0.824 and 0.857) (Fig. 3C).
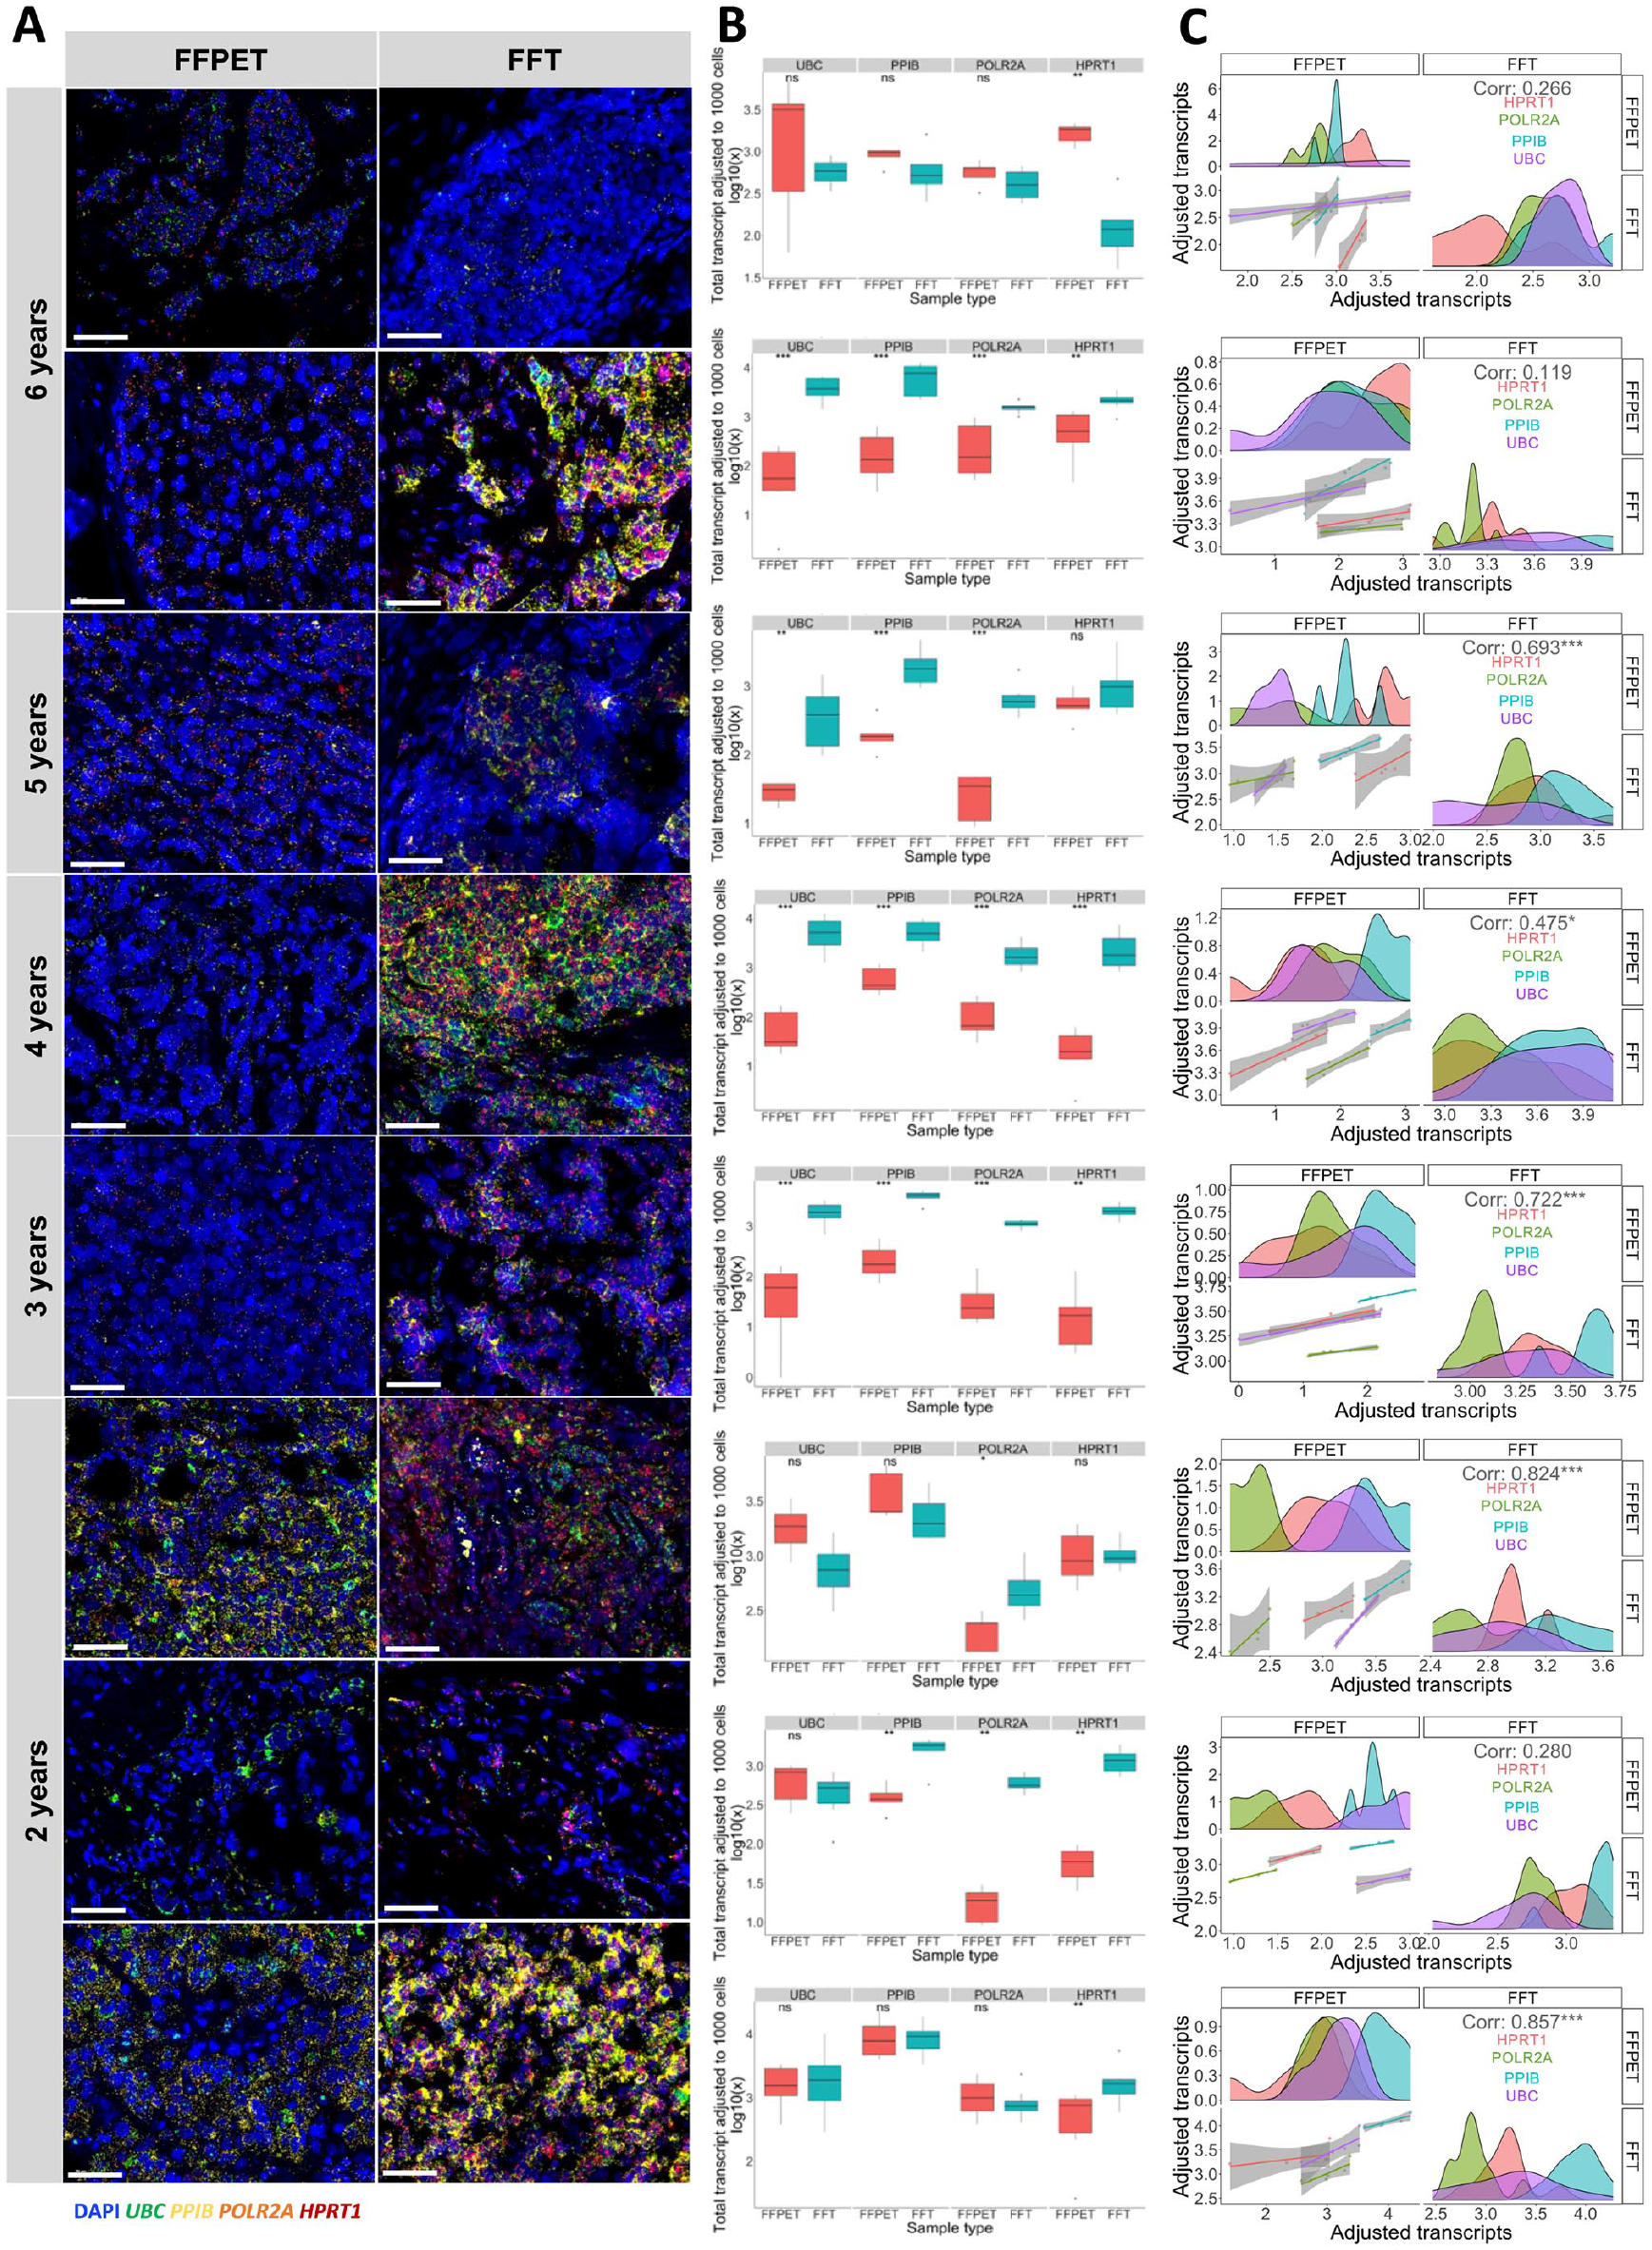
mRNA expression of the four house-keeping genes (HKGs) in the eight pairs of FFPETs and FFTs from the same patients by order of tissue archival duration ranging from 2 to 6 years. (A) Representative images from each sample pair, with FFPET shown in the left column and FFT shown in the right column. Scale bar = 50 µm. (B) Comparison of adjusted total transcripts between each pair of FFPETs and FFTs. (C) Spearman correlation of HKG expressions between each pair of FFPETs and FFTs. The top left and bottom right panels show the distribution of each HKG expression in FFPET and FFT, respectively, and the bottom left shows the fitted linear correlation. Genes were separated in different colors: HPRT in red, POLR2A in green, PPIB in blue, and UBC in purple. ns = p>0.05, *p<0.05, **p<0.01, ***p<0.001, ****p<0.0001.
In situ mRNA Expression Profiles of the Four HKGs
In this study, we utilized the 4-plex probes targeting common human HKGs: UBC, PPIB, POLR2A, and HPRT1 for RNA quality control (QC). These genes represent various levels of RNA expression and serve as the standard qualification for multiplex RNA-FISH in the assay. 29 Among the four HKGs, UBC and PPIB are the representatives of high expressors, while POLR2A and HPRT1 are the moderate to low expressors.29,38 To see whether our HKG profiles aligned with other breast cancer studies, we compared our HKG signals (Fig. 4A) with the bulk RNASeq data of the invasive breast carcinoma cohort in TCGA Pan-Cancer Atlas (Fig. 4B). 41 In situ RNA expression of the four HKGs in our samples was calculated as the total transcript count in the ROIs, treated as pseudo-bulk (Fig. 4A). High expressors, UBC and PPIB, showed significantly higher mRNA levels (p<0.001) than moderate to low expressors, POLR2A and HPRT1, both in pseudo-bulk (Fig. 4A) and bulk measurements (Fig. 4B). This pattern was consistent across both FFPET and FFT cohorts. Given the frequent use of these four HKGs as reference genes, we next assessed their in situ RNA expression stability using a web-based software program, RefFinder (http://blooge.cn/RefFinder/?type=reference). 43 The NormFinder algorithm revealed that HPRT1 was the most stable gene across all samples, regardless of sample type (Fig. 4C).
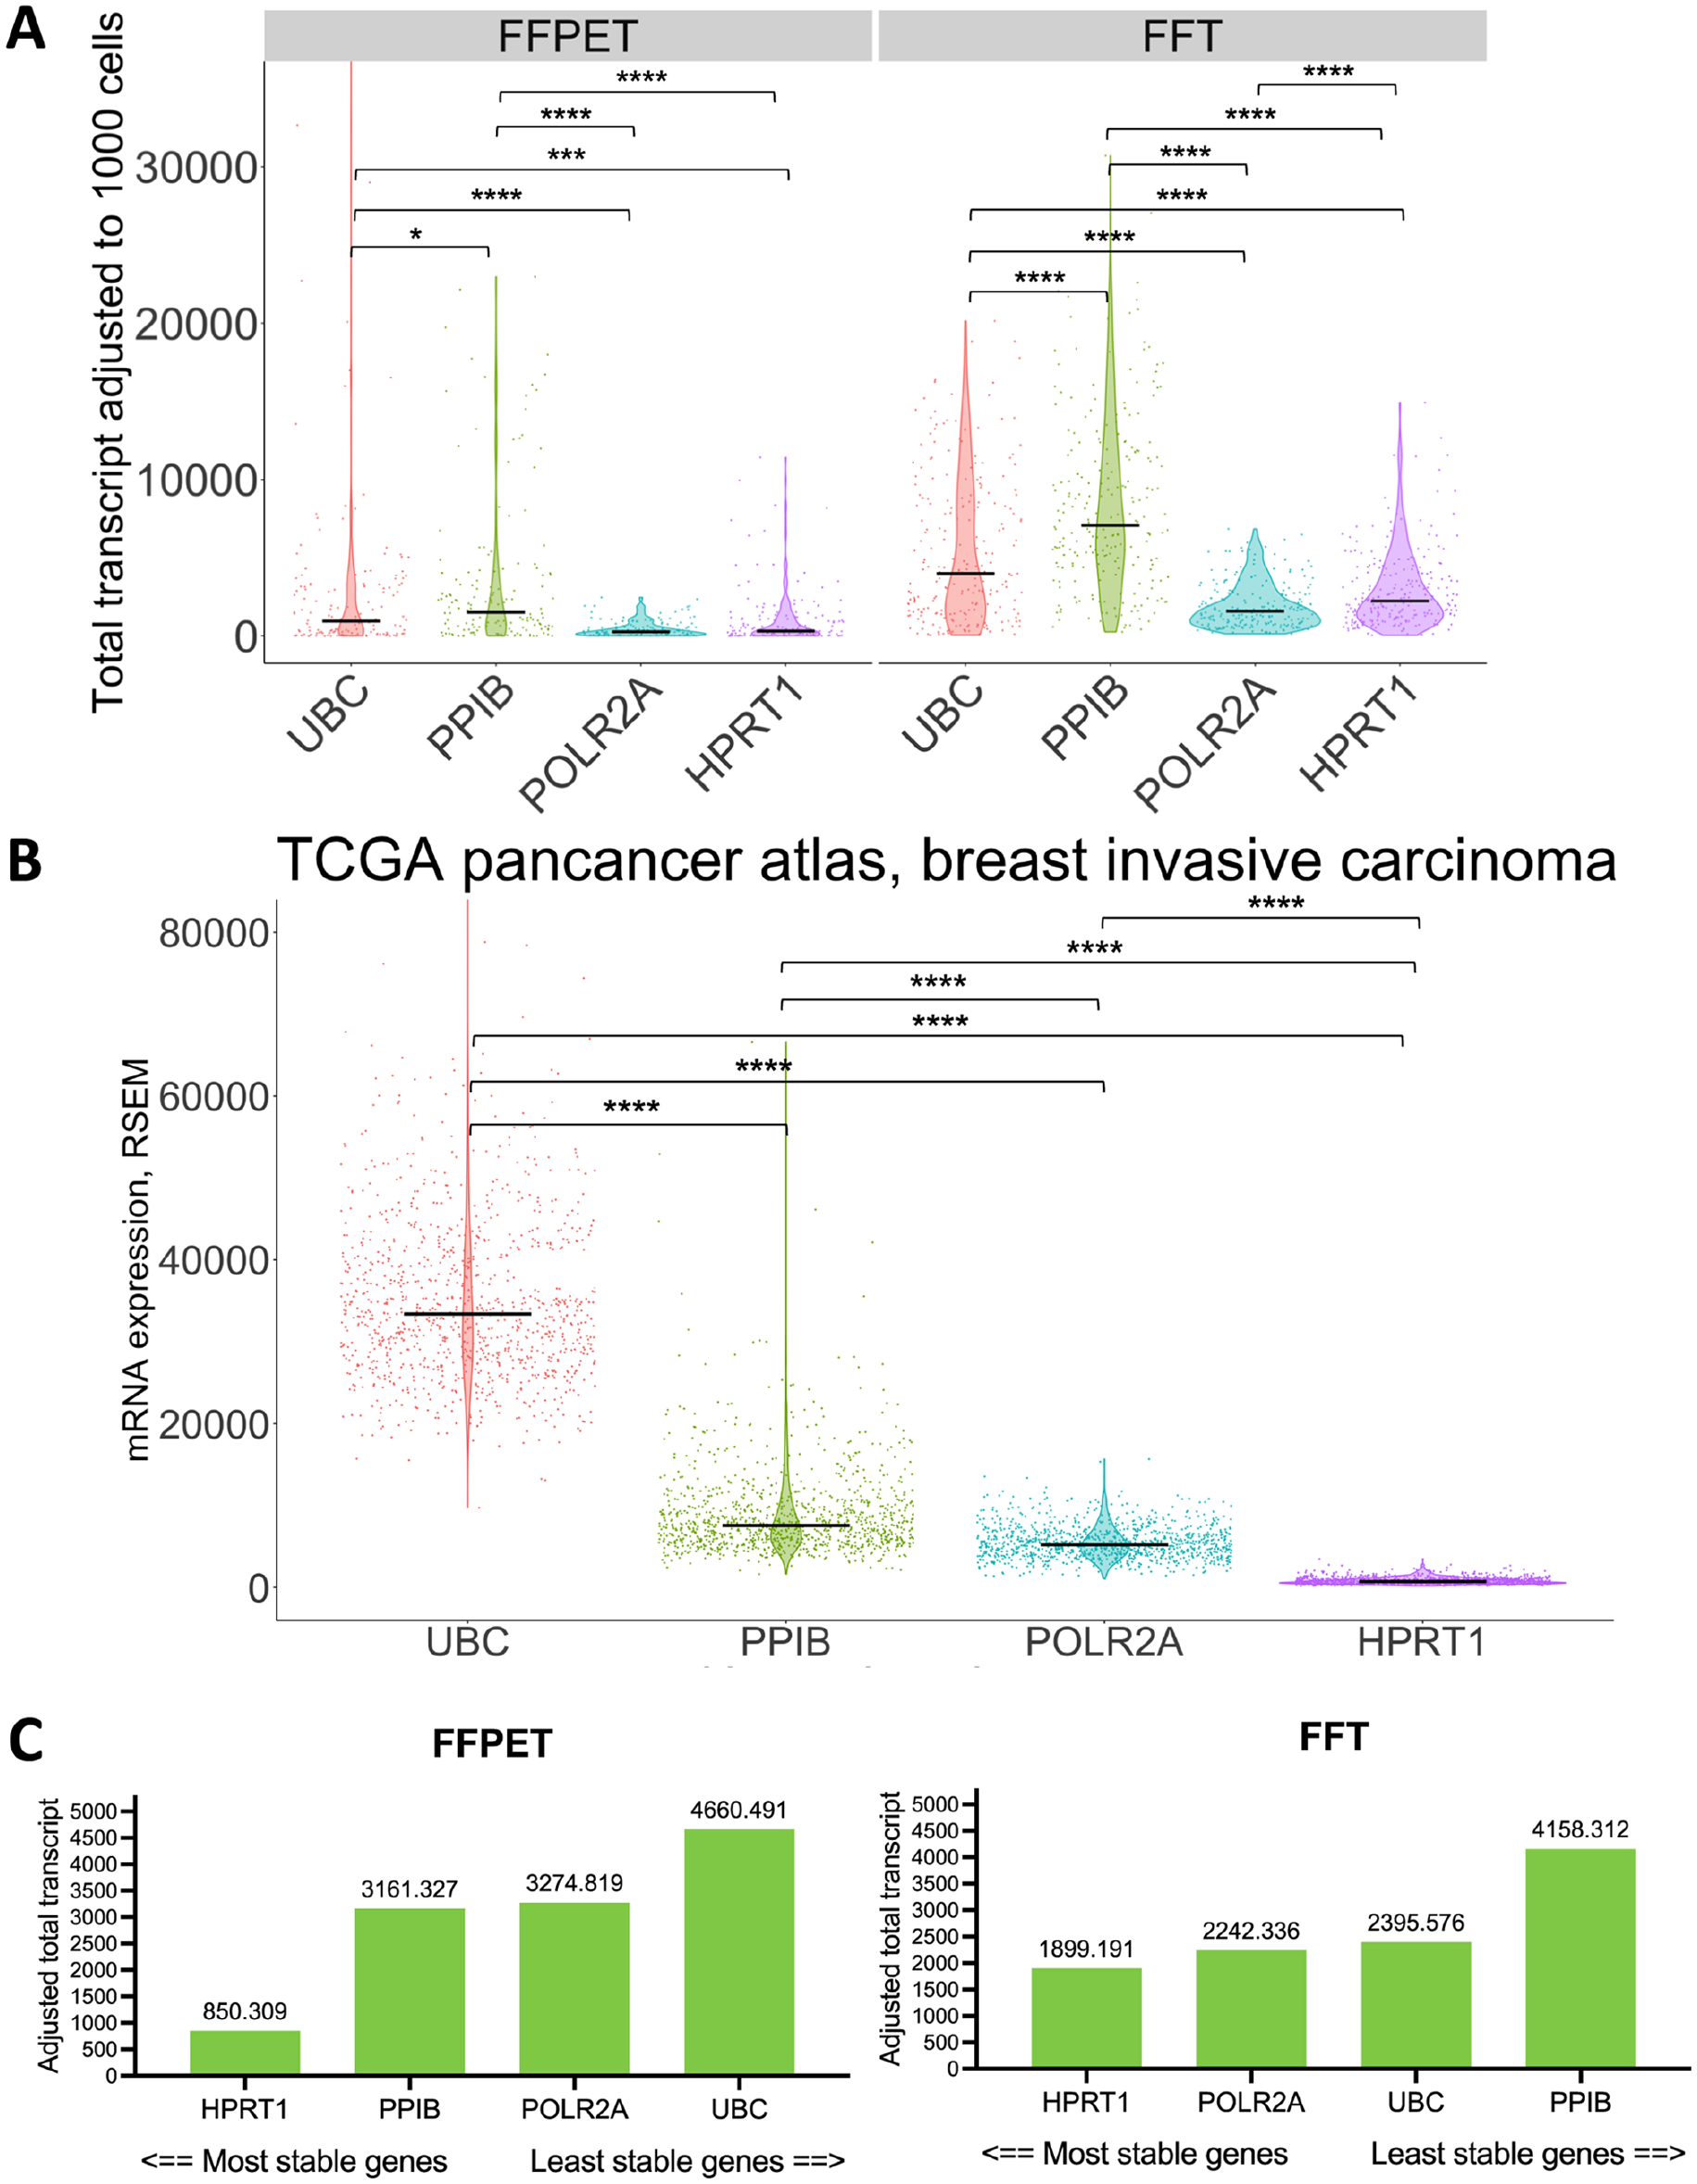
mRNA expression profiles of the four house-keeping genes (HKGs) in our and the TCGA Pan-Cancer cohort. (A) Comparison of the average mRNA expression level of each HKG detected in situ in both FFPET and FFT cohorts (n=62). RNAscope signals in each cell were analyzed using the pseudo-bulk method. (B) Comparison of the four HKG mRNA expression levels in the invasive breast carcinoma cohort (n=1084) of TCGA Pan-Cancer atlas (https://www.cbioportal.org, last accessed on November 13, 2022). RSEM; RNA-Seq by Expectation-Maximization. Black crossbars show the median level of expression. (C) Gene stability evaluation using normFinder 38 algorithm across FFPET and FFT cohorts. ns = p>0.05, *p<0.05, **p<0.01, ***p<0.001, ****p<0.0001.
In situ HKG mRNA Expression in Association With Tissue Archival Duration
Principal Component Analysis (PCA) was conducted to examine whether HKG expression levels could be grouped by sample type. The analysis showed that HKG expression largely clustered by sample type, FFPET or FFT, although the two groups partially overlapped (Fig. 5A). To further explore whether the archival duration was associated with the in situ HKG mRNA expression, RNA-FISH results were compared across three tissue archival time periods: 0–3 years, 4–7 years, and ≥8 years. In FFPET samples, a PCA plot showed gene expression clustering somewhat separately according to the 3 time periods, with tissues archived for ≥8 years forming a distinct cluster at the far-left corner, likely due to uniformly low mRNA levels (Fig. 5B, left panel). By contrast, FFT samples did not display clearly separated clusters of gene expression by archival time periods, as the data largely overlapped (Fig. 5B, right panel). Appendix Fig. 2 displays PCA plots grouped by each archival year in FFPETs and FFTs (Appendix Fig. 2A) and PCA plots of each of the four HKGs grouped by archival time periods in FFPETs (Appendix Fig. 2B). RNAscope image analysis of samples from each archival time period (Fig. 5C-E) revealed that fluorescence signals of each HKG in FFPET samples were compromised in the older tissues (4–7 years) compared with the newer ones (0–3 years), with HPRT1 being the least affected. The signals became even more negative in samples that were archived for ≥8 years (p<0.0001). On the contrary, no significant differences in gene expression were detected in FFT samples across different archival time periods (Fig. 5C, F, and G). These observations suggest that HKG mRNA expression reduced over archival time in FFPETs, but not in FFTs.
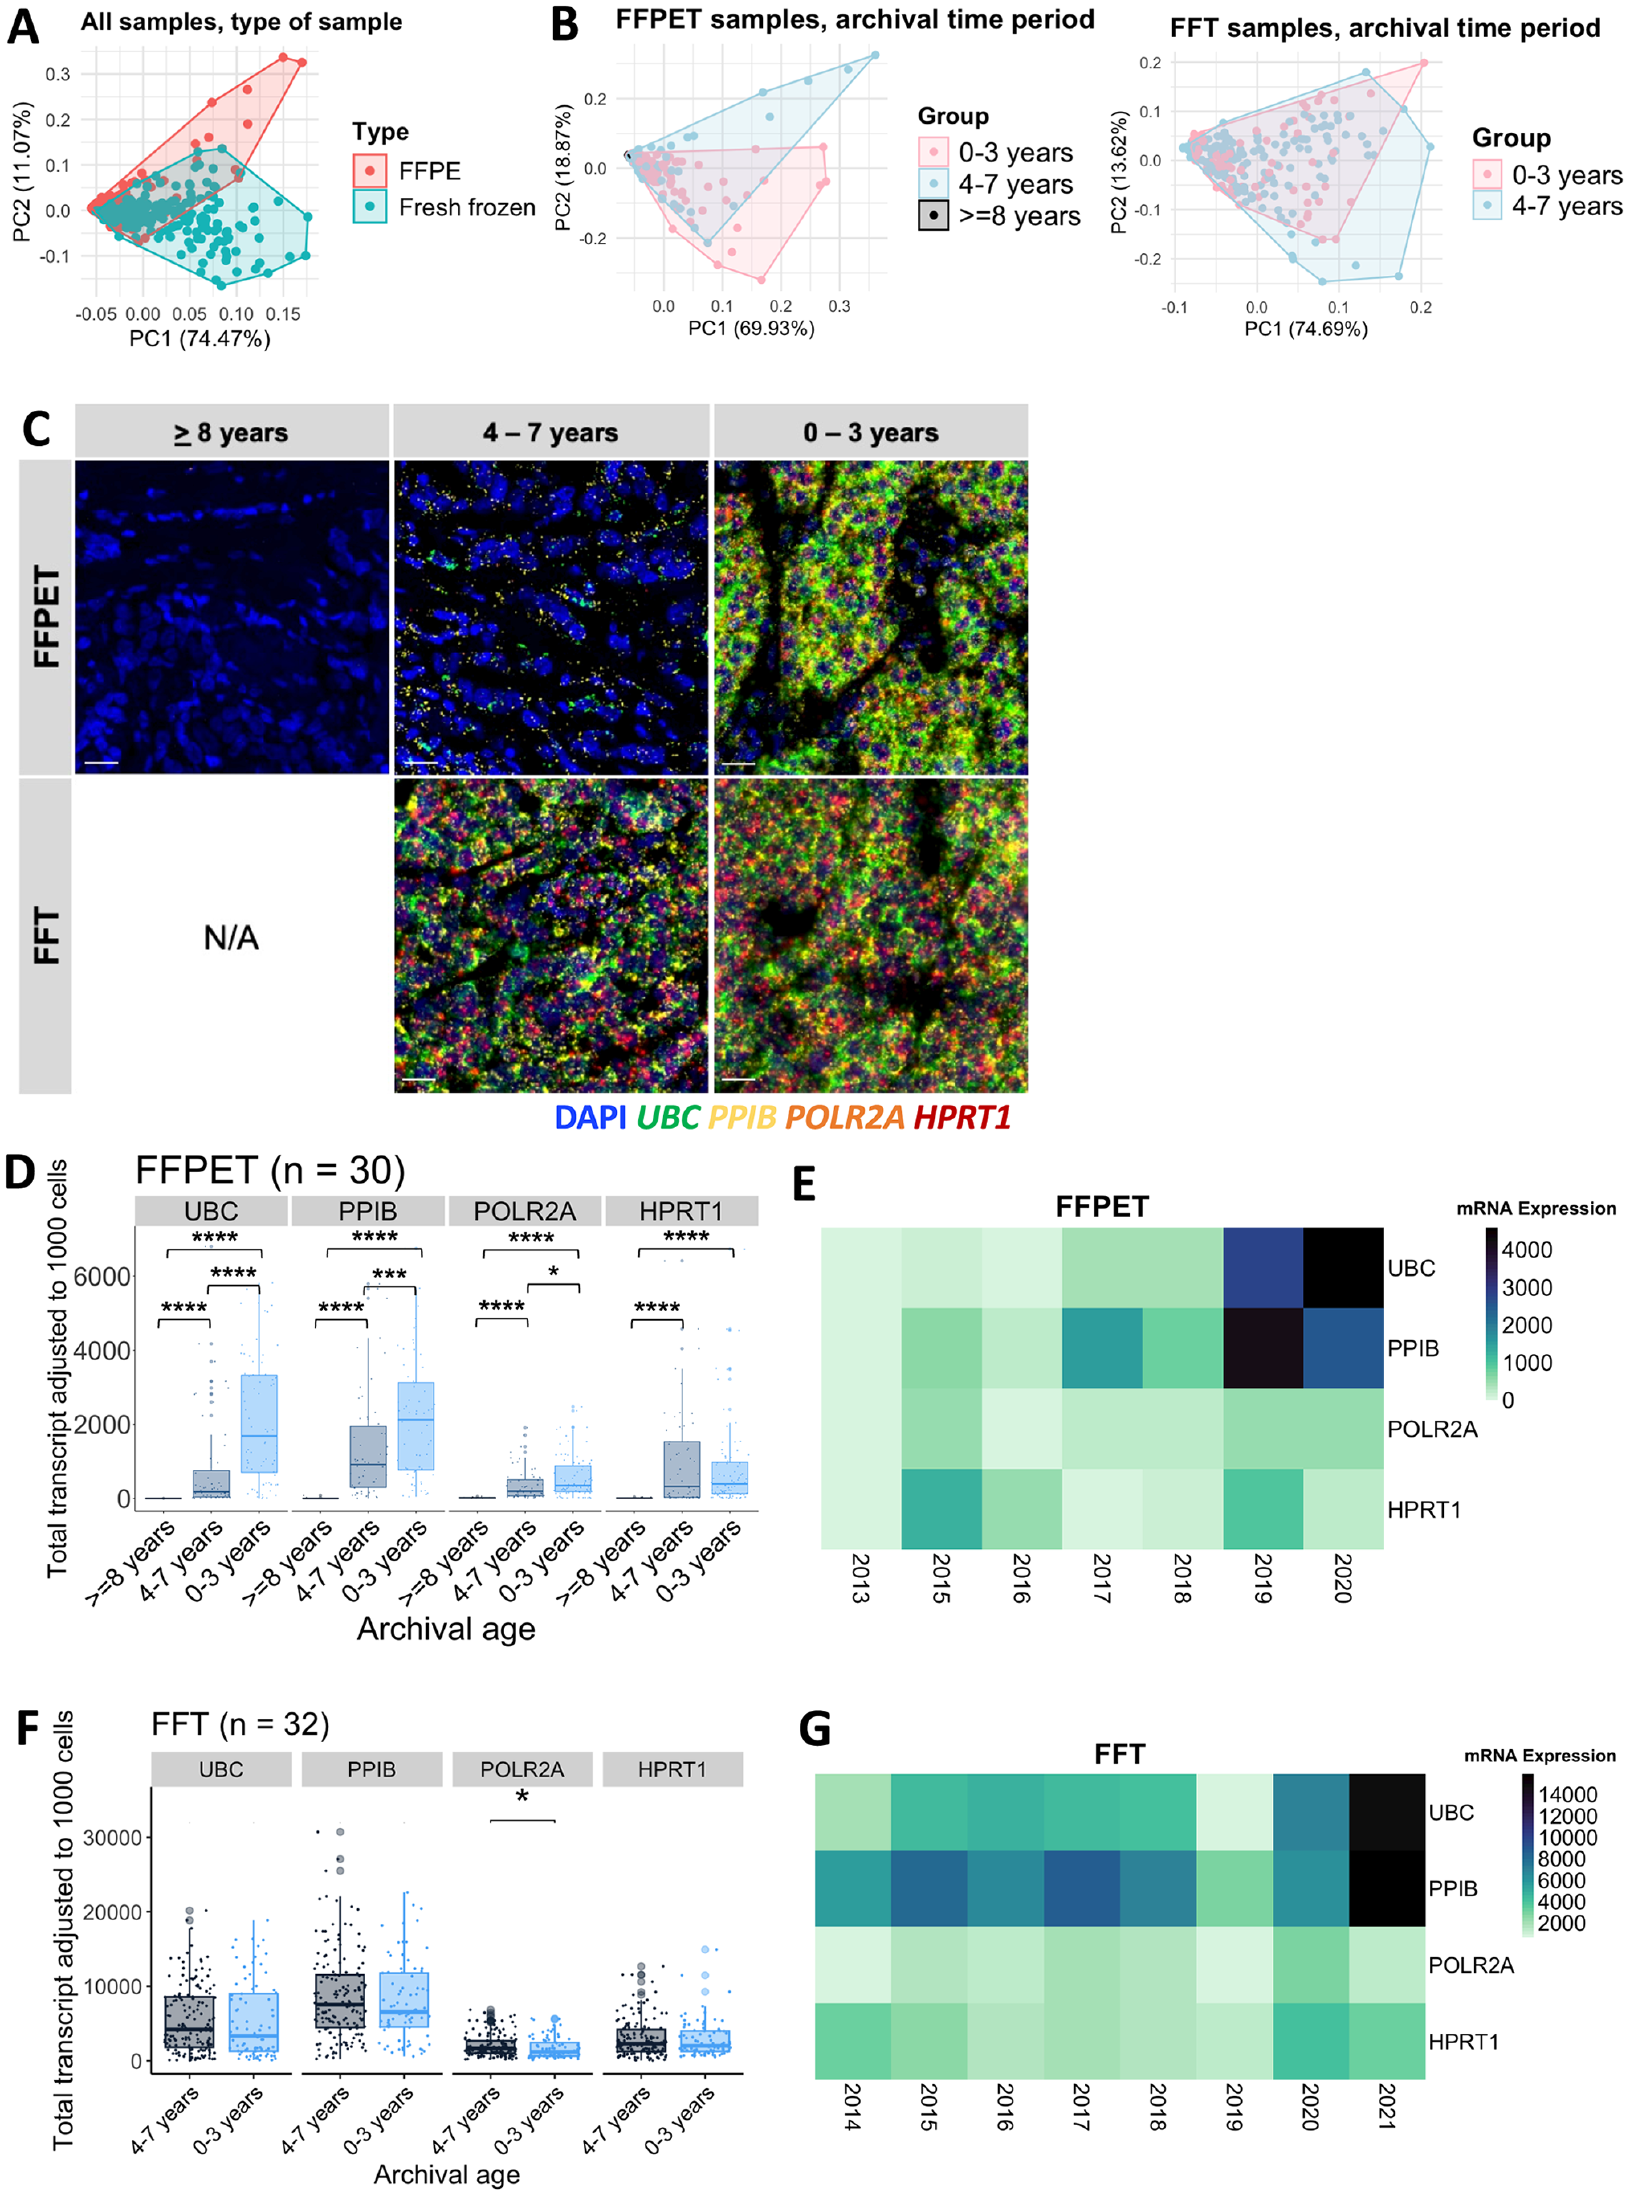
mRNA expression of the four house-keeping genes (HKGs) in the FFPET and FFT cohorts in association with the archival duration. (A) PCA plots of the four-HKG mRNA expression across all samples, grouped by sample type. (B) PCA plots of the 4-HKG mRNA expression in each sample type, grouped by the archival time periods. FFPET: 0–3 years (n=14), 4–7 years (n=12), and ≥8 years (n=4). FFT: 0–3 years (n=12) and 4–7 years (n=20). (C) Representative RNAscope multiplex fluorescent images of both sample types. Scale bar = 20 µm. (D) Box plots showing the four HKG expression levels in FFPET across the different archival time periods. (E) Heatmap illustrating the median expression of HKGs in FFPETs by archival year. (F) Box plots showing the four HKG expression levels in FFTs across the different archival time periods. (G) Heatmap illustrating the median expression of HKGs in FFTs by archival year. p values were calculated using unpaired Wilcoxon rank-sum test.
Next, to investigate whether low RNA integrity may lead to RNAscope signal alteration, RNA-FISH results in FFTs with different RNA integrity numbers (RIN) were compared. Fluorescent images in Fig. 6A (upper left) showed that FFT samples with low RIN could still display bright signals. Correlation analysis found no significant relationship between RIN values and HKG expression, with R2 values ranging from 0.022 to 0.15 (Fig. 6B). Moreover, prolonged storage of FFT samples at −80C did not impact RIN values, as no correlation was observed (Fig. 6C).
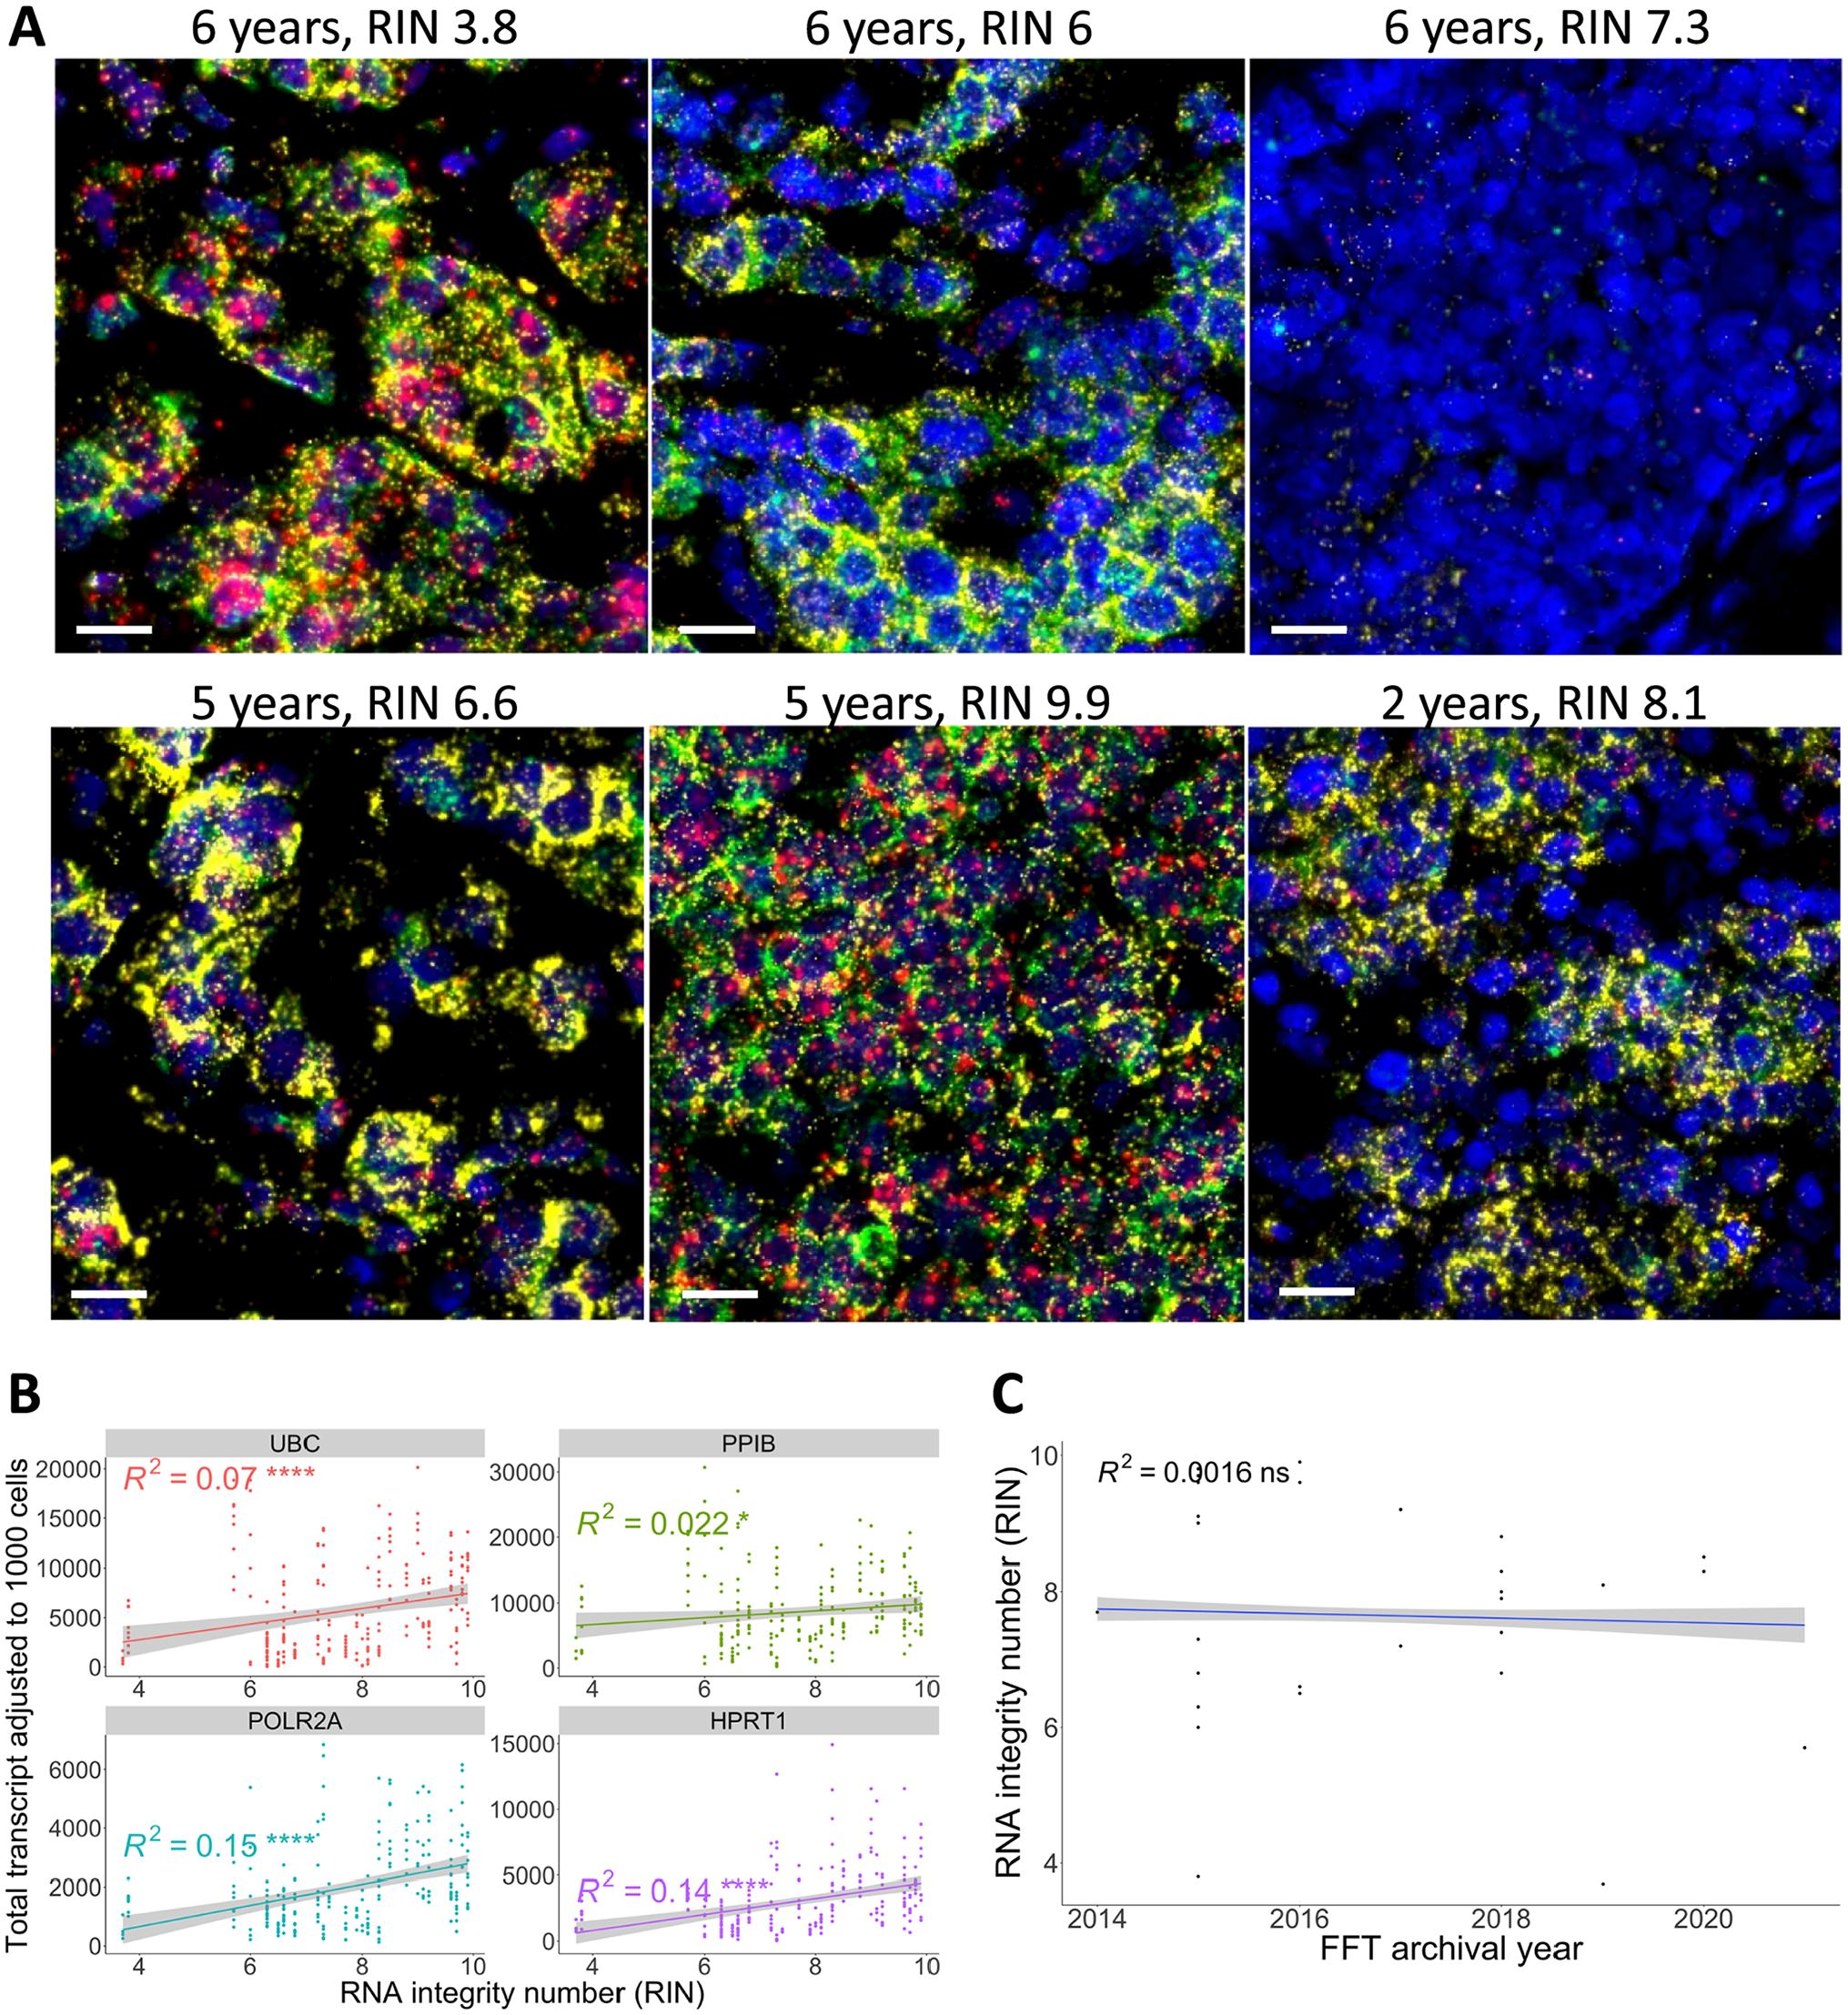
Correlation between the four house-keeping-gene in situ mRNA expressions and RNA integrity number (RIN) in the FFT cohort. (A) Representative images showing FFT samples with various archival durations and their respective RIN values. Scale bar = 20 µm. The upper row shows samples archived for 6 years with RIN scores of 3.8, 6, and 7.3 (left to right). The lower row shows samples archived for 5 years with RIN scores of 6.6 and 9.9 (left and middle) and 2 years with a RIN score of 8.1 (right). (B) Pearson correlation between the adjusted total transcripts and RIN values demonstrated a very weak positive correlation (R2 < 0.2). (C) Pearson correlation between RIN values and FFT archival years. ns = p>0.05, *p<0.05, **p<0.01, ***p<0.001, ****p<0.0001.
RNA Degradation Over Time in Archived FFPETs and FFTs
A linear correlation was performed to investigate the relationship between HKG mRNA quantity and archival years to determine whether RNA degradation occurred over time. As shown in Fig. 7 and Appendix Fig. 3, the adjusted transcript counts and H-score in FFPETs showed a weak positive correlation (R2 < 0.4) between higher mRNA expression levels and shorter archival duration, albeit with statistical significance (p<0.0001 for UBC, PPIB, and POLR2A; p<0.01 for HPRT1). High expressor genes (UBC and PPIB) showed a stronger correlation than low-to-moderate expressors (POLR2A and HPRT1), implying that the archival time-dependent RNA degradation was more pronounced in highly expressed genes. In FFTs, a very weak positive correlation (R2 < 0.2) with no statistical significance was observed for all four HKGs, indicating minimal or no RNA degradation over time. Both analysis approaches using adjusted transcript counts (Fig. 7A and Appendix Fig. 3, upper panels) and H-score (Fig. 7B, Appendix Fig. 3, lower panels) generated similar linear correlations.
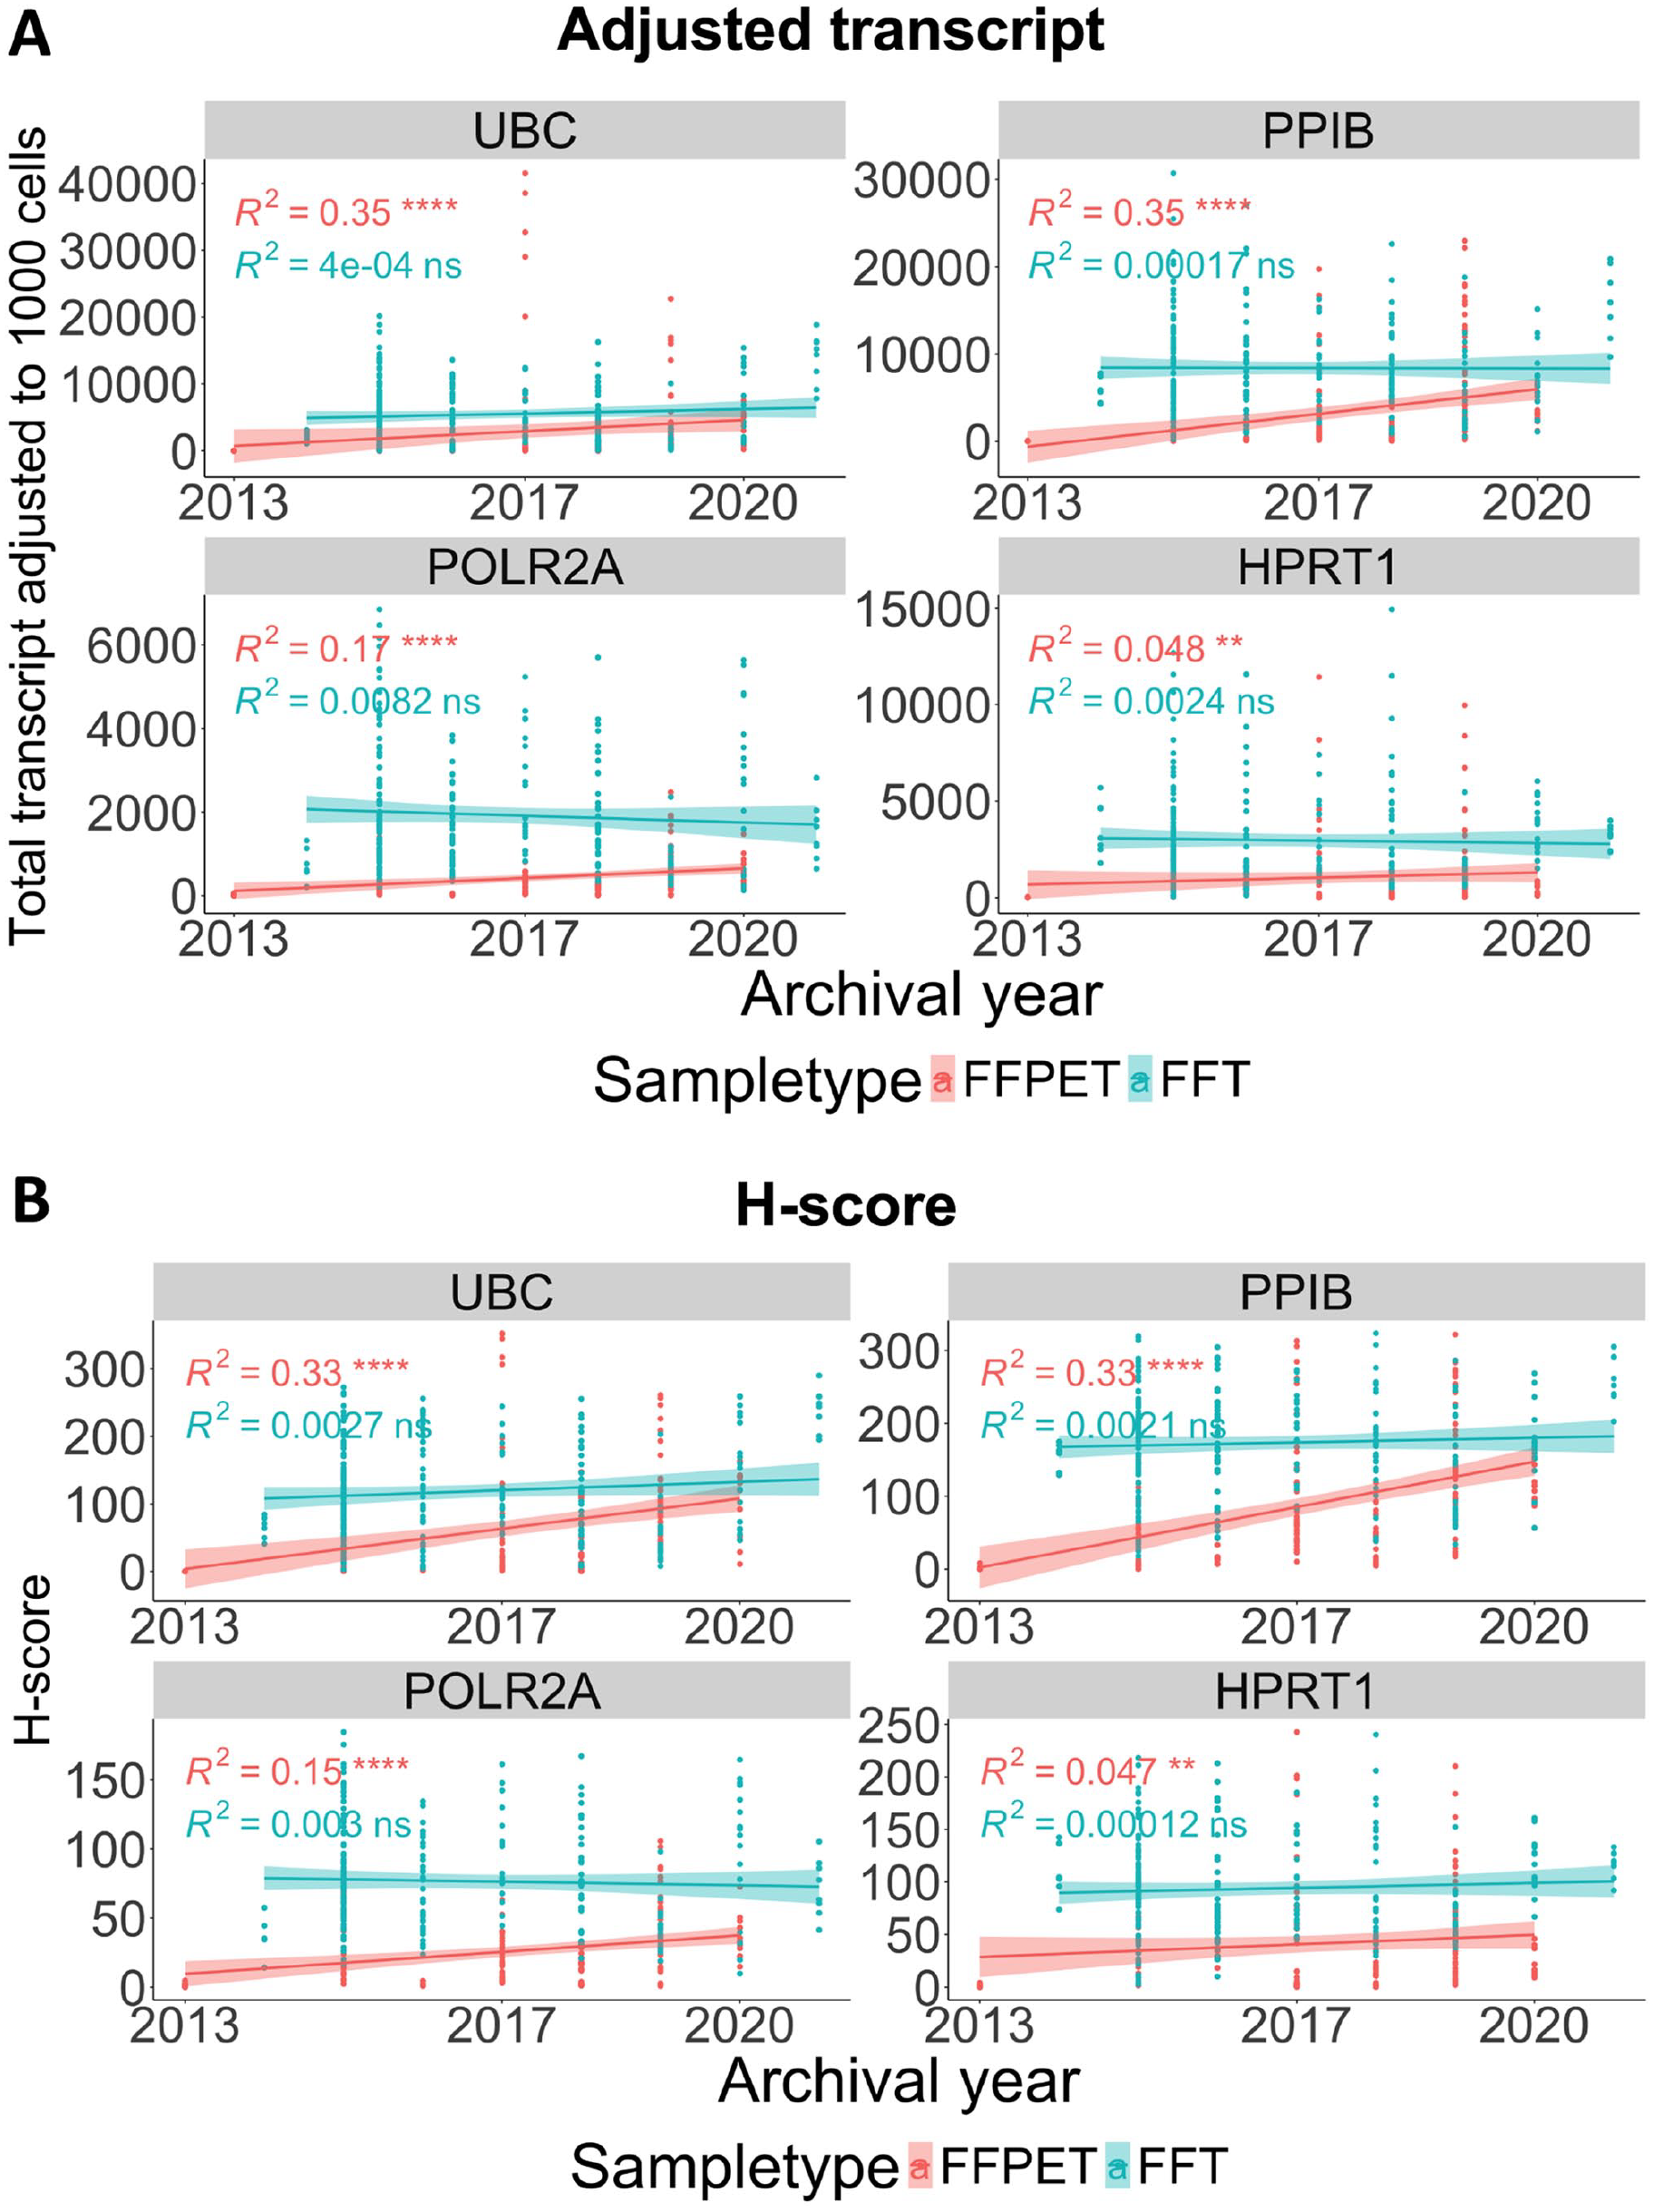
Analysis of archival duration-dependent RNA degradation in the FFPET and FFT cohorts. Correlation between the HKG expression levels and tissue archival year, either as adjusted total transcript
Recommended Checklist for Multiplex RNA-FISH Optimization in Archived FFPETs and FFTs
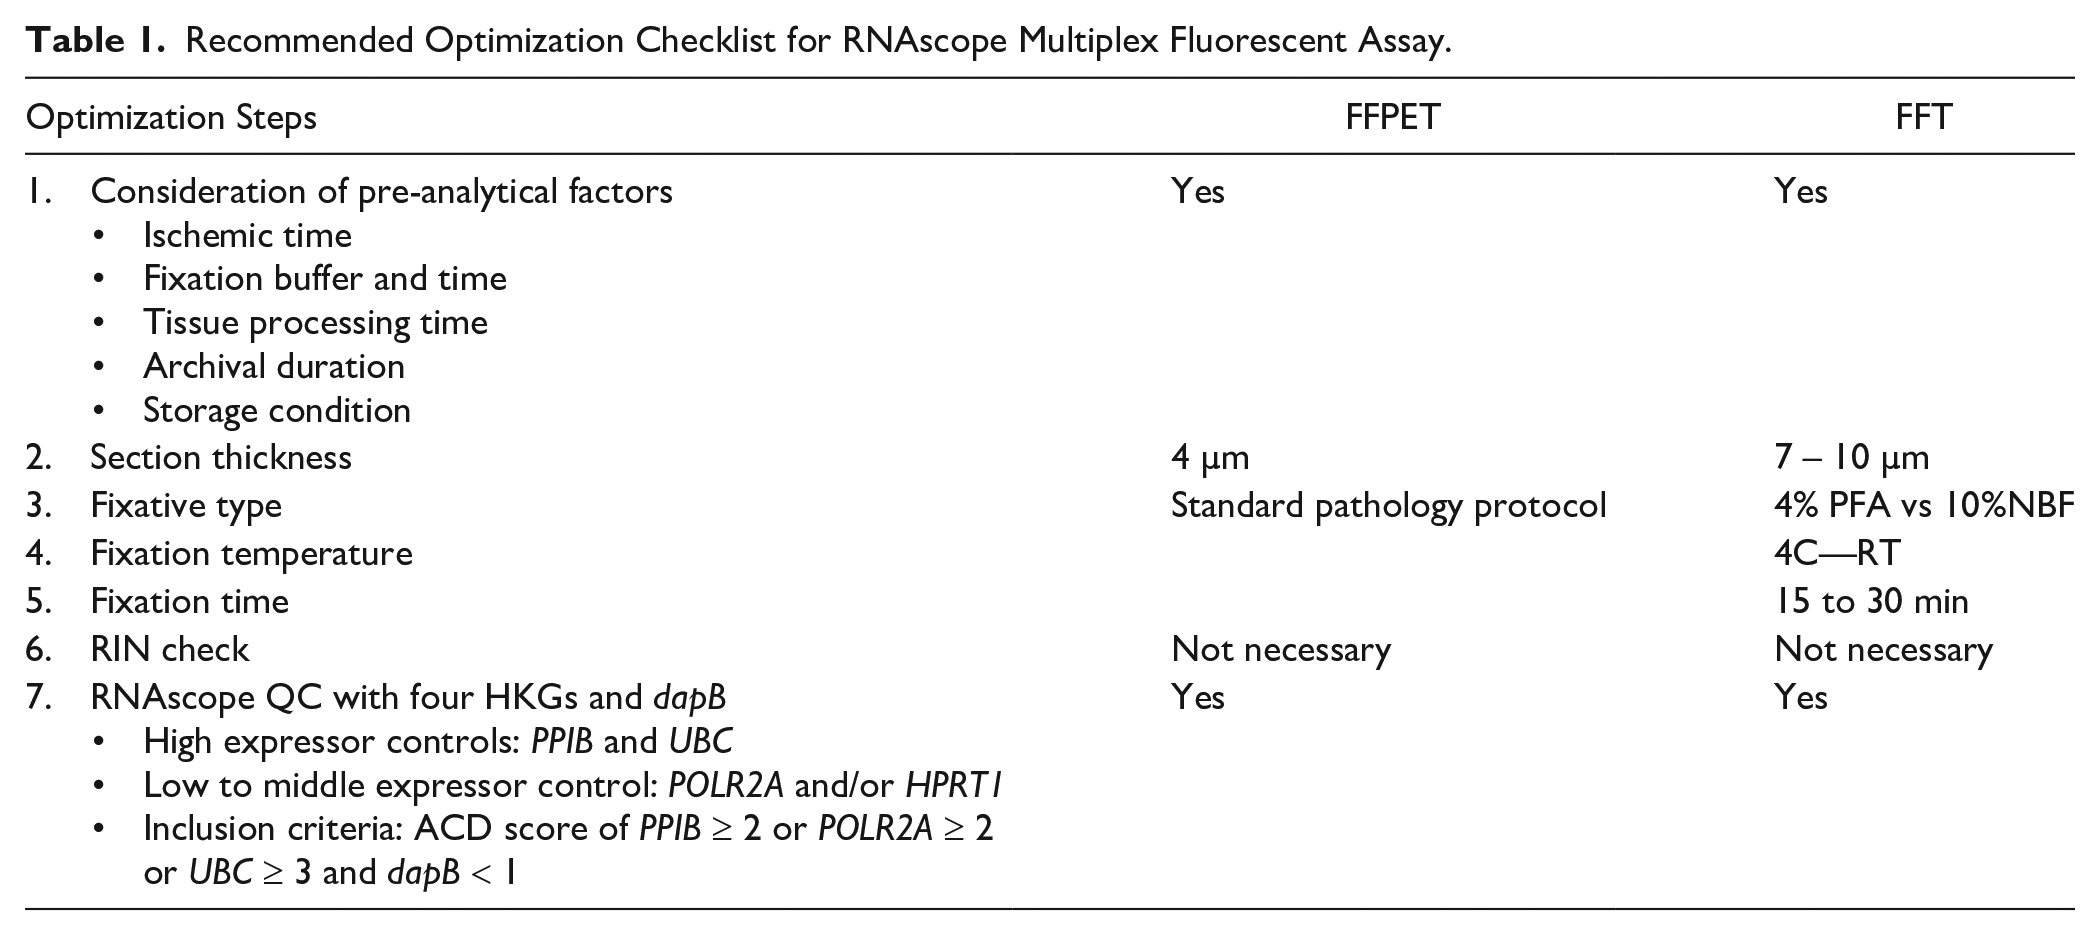
Based on our findings, we have compiled the checklist for RNAscope multiplex fluorescent assay optimization in FFTs and FFPETs (Table 1). All pre-analytical factors, including archival duration, should be considered when selecting samples. For FFTs, additional tissue preparation and processing optimizations are required to achieve good signal clarity. RIN measurement is not necessary; however, a sample quality check using HKG probes is strongly recommended to exclude samples with low RNA quality, thus ensuring successful analysis and accurate RNAscope results.
Recommended Optimization Checklist for RNAscope Multiplex Fluorescent Assay.
Discussion
Multiplex RNA-FISH, such as RNAscope multiplex fluorescent assay, can assess target gene expression at different resolutions. These include bulk tissue (average expression/whole slide scanning), pseudo-bulk analysis (average expression/specific region of interest), and single-cell or cell type-specific analysis (total transcript count/cell). This method allows the study of various pathologic changes and cellular states in individual cells. This biological state can be correlated with patients’ clinical prognosis or therapy prediction. For example, high mRNA expression of PDL1 in breast tumors correlates with longer recurrence-free survival in breast cancer patients.44–46
In this study, we performed an RNAscope multiplex fluorescent assay on archived breast cancer FFPET and FFT samples with various archival durations to assess the signals and compare the results. The assay was chosen for its capability to detect and quantitatively explore in situ mRNA expression at a single-cell resolution and its ease of use in clinical settings. 39 Spatially resolved molecular profiling is increasingly utilized in pathologic diagnosis and research. Therefore, to achieve accurate targeted spatial gene expression results with RNAscope, we aimed to investigate the effect of archival duration on RNA-FISH signal quality in both FFPET and FFT samples.
RNAscope, optimized for fragmented FFPET RNA, requires only three pairs of 20 double-Z probes per gene. 23 However, we found that the signals were still affected by uneven RNA degradation in FFPET. Despite this, the RNAscope multiplex fluorescent assay successfully detected four HKG mRNAs in most archived FFPET and all FFT samples. FFT samples showed a brighter fluorescent signal in punctate dots compared with FFPETs, which aligns with the known fact that FFTs provide better RNA quality. 35 In our comparison of eight matched FFPET and FFT samples, the newest pairs (<2 years old) showed the brightest fluorescent signals and the strongest correlation. Only one 6-year-old FFPET sample showed better RNA quality than its matched FFT, possibly due to unknown pre-analytical factors that could contribute to various degrees of RNA degradation, such as ischemic time and fixation parameters.35,47 In retrospective studies, early pre-analytical factors are typically difficult to evaluate 48 ; however, the storage duration and condition of the FFPET block can be more easily assessed and controlled. Studies have shown that a longer archival duration results in more degraded RNA. 28 Standard FFPET block storage conditions are at ambient temperatures ranging from 17C to 22C, with 20% to 60% humidity levels. 47 Kim et al. showed that storage in a humid environment sharply decreased HER2 mRNA in breast cancer tissue microarray sections compared with a dry environment. 34 A research group based in Chicago, USA, led by Colburn et al., reported that canine distemper virus (CDV) RNA via RNAscope ISH could still be detected on raccoon FFPET samples with an archival duration of 15 years, although the possibility of false negative results cannot be entirely excluded. 49 In contrast, our results clearly demonstrated that FFPET older than 3 years started to show poorer RNAscope signal quality, and those that failed the assay were archived longer than 6 years. The ambient temperature in Thailand is hot and humid year-round, with an annual mean temperature of 28C and humidity of >60% even in drier months. 50
Different countries in different regions may have different ambient room temperatures and humidity. Unless these factors are properly controlled, RNA degradation may occur even more severely.
We explored the expression profiles of the four common HKGs in our cohort to study in situ mRNA expression over archival time. The RNA profiles of the four HKGs detected by RNAscope in situ were mostly similar to those from the TCGA breast carcinoma cohort. Although TCGA cohort data were obtained from bulk RNA-Seq of FFT samples rather than RNAscope, our findings were still comparable. The highest expressors in TCGA were UBC, followed by PPIB, POLR2A, and HPRT1. Different from Gadila et al., 38 our RNAscope data showed that PPIB had higher median expression than UBC, UBC had higher expression than POLR2A, and POLR2A expression was either equal to or lower than that of HPRT1. Despite some differences, both TCGA and our own data (FFPETs and FFTs) demonstrated that UBC and PPIB, as high expressors, had higher expression than the low-to-moderate expressors POLR2A and HPRT1. We confirmed that these four HKGs are reliable positive controls for quality-checking breast cancer tissue samples.
Stability evaluation using in silico normFinder algorithm 43 showed that HPRT1 was the most stably expressed gene in both sample types, while abundant HKGs like UBC and PPIB were less stable. Genes with short mRNA and probe positions near the 5′ end were most affected by RNA degradation. 51 The transcript sizes of UBC, PPIB, POLR2A, and HPRT1 are 3396, 7206, 30,238, and 40,524, respectively. 52 This suggests a correlation between transcript length and time-dependent degradation. RNA-FISH signals in FFPET were associated with archival duration, particularly for high-expressing genes like UBC and PPIB. Regarding mRNA secondary structure, UBC and PPIB have less negative folding energy at 3′ UTR position (–6.70 and −58.20 kcal/mol, respectively) compared with HPRT1 and POLR2A (–120.02 and −149.27 kcal/mol, respectively). 52 RNA with a more negative free energy has a more stable secondary structure, and increased secondary structure at the 3’ UTR leads to higher RNA stability and protein expression.52,53
Our findings suggested that the R2 values representing the correlation between higher HKG gene expression levels and shorter archival duration calculated using H-score were slightly different from those using adjusted total transcripts, although they were generally consistent. This is likely because H-scoring is similar to data transformation, which uses bins to categorize the transcript counts. However, we showed here that the adjusted transcript count and H-score can be used interchangeably.
This retrospective study used archived FFPET and FFT samples from a single medical center. Comparing the RNAscope multiplex fluorescent assay results of FFPETs with those of FFTs older than 7 years was not possible, as the oldest archived FFTs were limited to 7 years. A larger sample size is needed to strengthen these findings. In addition, due to the more controlled pre-analytical factors in the breast cancer FFPET samples, our results should be interpreted cautiously when applied to other tissue types. Since pre-analytical factors can influence the quality of mRNA expression detected by the RNAscope multiplex fluorescent assay on archived samples, we have provided a checklist of recommendations for assay optimization (Table 1).
In conclusion, although the RNAscope probe is designed to detect fragmented RNA, performing quality checks using four HKGs for multiplex RNA-FISH is strongly recommended. To our knowledge, this study is the first to examine the effect of archival duration on multiplex RNA-FISH signals in human FFPET and FFT samples, paving the way for their optimal use in future translational research and clinical applications.
Supplemental Material
sj-xlsx-1-jhc-10.1369_00221554241311971 – Supplemental material for RNAscope Multiplex FISH Signal Assessment in FFPE and Fresh Frozen Tissues: The Effect of Archival Duration on RNA Expression
Supplemental material, sj-xlsx-1-jhc-10.1369_00221554241311971 for RNAscope Multiplex FISH Signal Assessment in FFPE and Fresh Frozen Tissues: The Effect of Archival Duration on RNA Expression by Ariestya Indah Permata Sari, Katherine Copeland, Pattarin Nuwongsri, Wiriya Pipatsakulroj, Artit Jinawath, Nipan Israsena, Panuwat Lertsittichai, Prakasit Chirappapha, Meng-Shin Shiao and Natini Jinawath in Journal of Histochemistry & Cytochemistry
Supplemental Material
sj-xlsx-2-jhc-10.1369_00221554241311971 – Supplemental material for RNAscope Multiplex FISH Signal Assessment in FFPE and Fresh Frozen Tissues: The Effect of Archival Duration on RNA Expression
Supplemental material, sj-xlsx-2-jhc-10.1369_00221554241311971 for RNAscope Multiplex FISH Signal Assessment in FFPE and Fresh Frozen Tissues: The Effect of Archival Duration on RNA Expression by Ariestya Indah Permata Sari, Katherine Copeland, Pattarin Nuwongsri, Wiriya Pipatsakulroj, Artit Jinawath, Nipan Israsena, Panuwat Lertsittichai, Prakasit Chirappapha, Meng-Shin Shiao and Natini Jinawath in Journal of Histochemistry & Cytochemistry
Footnotes
Appendix
Acknowledgements
The authors thank all Ramathibodi Tumor Biobank staffs for their assistance in FFT archival as well as Dr. Amrita Roy and Dr. Ching-Wei Chang for their invaluable technical support concerning RNAscope multiplex fluorescent assays and analysis. The authors thank Dr. Rossukon Kaewkhaw for useful comments, and Mr. Justin Copeland for bioinformatics assistance. The authors are grateful for the support from all the surgeons at the Division of Breast and Endocrine Surgery, and the patients and their families.
Competing Interests
The author(s) declared no potential conflicts of interest with respect to the research, authorship, and/or publication of this article.
Author Contributions
All authors have contributed to this article as follows: study design (AIPS, M-SS, NJ), experiments (AIPS, KC, PN), data analyses (AIPS, KC, PN, NJ), histological analyses and validation (WP, AJ), specimen providers (PL, PC), supervision and data interpretation (WP, AJ, NI, M-SS, NJ), writing the original draft of the manuscript (AIPS), reviewing and editing the manuscript (AIPS, KC, NI, M-SS, NJ), and funding (NJ). All authors read and approved the final manuscript.
Funding
The author(s) disclosed receipt of the following financial support for the research, authorship, and/or publication of this article: This work was supported by the Mahidol University, National Research Council of Thailand grant no. N41A640161, and Health Systems Research Institute grant no. 64-208 (NJ).
References
Supplementary Material
Please find the following supplemental material available below.
For Open Access articles published under a Creative Commons License, all supplemental material carries the same license as the article it is associated with.
For non-Open Access articles published, all supplemental material carries a non-exclusive license, and permission requests for re-use of supplemental material or any part of supplemental material shall be sent directly to the copyright owner as specified in the copyright notice associated with the article.