
Abstract
Primary malignancies of the central nervous system account for 2% of all cancers in adults and almost 15% in children under 15 years of age. The prognosis of brain anaplastic cancers and glioblastomas remains extremely poor, with devastating survival expectative, and new molecular markers and therapeutic targets are essential. Epigenetic changes constitute an extensive field for the development of new diagnostic and therapeutic strategies. Histone acetyl transferase-1 (HAT1) has merged as a potential prognostic marker and therapy target for different malignancies. Data repository analysis showed HAT1 mRNA overexpression in gliomas and has been described its alternative splicing in glioblastomas. Using immunohistochemical and aptahistochemical methods, we analyzed the expression of HAT1 in meningiomas, oligodendrogliomas, and astroglial cancers. We observed that HAT1 overexpression is associated with the most aggressive tumor types and the worse prognosis, as well as with a higher probability of early relapse in meningiomas. Its cytosolic localization correlates with tumor progression and prognosis. Aptamers, synthetic oligonucleotides capable to bind and inhibit a wide variety of targets, are considered as promising diagnostic and therapeutic tools. Aptahistochemistry using the aptamer apHAT610 offered superior results in comparison with the antibody used, as a good example of the potential of aptamers as diagnostic tools for histopathology.
Introduction
More than 251,000 brain cancer–related deaths occurred in 2020 worldwide, with primary tumors of the central nervous system accounting for 2% of the total types of cancer. 1 Gliomas and meningiomas are the most frequently diagnosed primary brain tumors. Originated from glial or progenitor cells, gliomas are highly infiltrative, which complicates its surgical removal. They are classified into four grades, with glioblastoma multiforme (GBM) being the most aggressive tumor, characterized morphologically by high cellular pleomorphism, microvascular proliferation, and the presence of mitoses and necrosis. Oligodendrogliomas (OD), originated from oligodendrocytes or oligodendroglial precursors, are usually slow growing and do not spread to the surrounding brain tissue. They most frequently occur in middle-aged adults and generally are less frequent and have a better prognosis than astrocytomas (A). Depending on the degree of malignancy, OD are classified into grades 2 and 3. Meningiomas (M), originated from meningeal cells, represent approximately 15% of all intracranial tumors and are classified into three grades: 1, low-grade tumors (the most common and slow growing); 2, intermediate-grade atypical meningiomas (with a higher probability of recurrences), and 3, malignant anaplastic meningiomas (a fast growing tumor). Up to 2021, the classification of primary brain cancers was based on the tumor original lineage, but currently the criteria include their molecular characteristics. 2 World Health Organization (WHO) classification also contemplates the possibility of cases where the molecular study cannot be performed (e.g., due to insufficient tissue material or very old specimens) and proposes to perform the classic morphological diagnosis in these situations, including the tumor type and grade, Not Overall Specified (NOS) or Not Elsewhere Classified (NEC).
Despite medical advances, the prognosis for the most aggressive brain tumors remains dismal. Meningiomas are the tumors with the highest median survival rate, although recurrences after surgery are frequent. The 10-year median survival is reported at 97% for patients with benign M (grades 1 and 2), 90% for patients with atypical M, and between 60% and 30% for those with malignant meningiomas. 3 The median survival is approximately 150 months in patients with grade 2 OD and 42 months for patients with grade 3 tumors. 4 In astrocytomas, the median survival is approximately 74 months for low-grade tumors and 28 months for patients with grade 3 cancers. 5 GBM are the tumors with the poorest prognosis, with a median survival of 6–10 months. 6 Therefore, the search for new molecular markers and therapeutic targets is crucial in neuro-oncology. Recently, the study of epigenetic alterations in cancer development has led to the discovery of new methods of early diagnosis and treatment guidelines, and the analysis of these changes is very interesting for the study and subclassification of brain tumors.
Epigenetics in Cancer: Histone Acetyl Transferase 1
Epigenetics comprises the heritable changes in gene function not attributable to alterations in the primary DNA sequence. The most deeply studied post-translational modifications (PTMs) are acetylation, methylation, and phosphorylation. Histone acetyl transferases (HATs) and histone deacetylases (HDACs) are the writers and erasers that regulate histone acetylation. Histone acetylation levels correlated with GBM progression, where HATs were suggested to play a key regulatory role. 7
Depending on their location and main substrate, type A HATs are involved in nucleosomal histone recognition and located exclusively at the nucleus, and type B HATs, such as histone acetyl transferase 1 (HAT1), are involved in free histone acetylation and located at the cytoplasm. Currently, they are classified into three superfamilies, according to their structural homology and substrate binding: GNAT, p300/CBP, and MYST. 8 HAT1 is a member of the GNAT superfamily. Agudelo Garcia et al. 9 described two HAT1 transcriptional isoforms, HAT1a and HAT1b, generated by alternative splicing (loss of 86aa at the N-terminal sequence). HAT1a (418 amino acids) is exclusively nuclear, whereas isoform b (334 amino acids) is both cytoplasmic and nuclear.
The best-known HAT1 function is the acetylation of lysines 5 and 12 of free histone H4 located in the cytoplasm prior to its transport to the nucleus, and Song et al. 10 described more than 100 different proteins as HAT1 non-histone substrates. However, HAT1 is mainly localized at the cell nucleus, where it is involved in functions termed “non-canonical,” which are still poorly understood. It is related with telomeric silencing, links metabolism to cell cycle progression, participates in DNA replication, and interacts with the replication fork, and in addition, the loss of HAT1 increases sensitivity to DNA single- and double-strand breaks, suggesting a role for this enzyme in repair processes.8,11 Besides its multiple roles (as metabolic transducer, immunoregulator, or its relationship with the infectivity of certain viruses such as HIV, severe acute respiratory syndrome coronavirus 2 (SARS-COV2), or hepatitis B), there is growing evidence on the role of HAT1 in the development and progression of cancer. Elevated HAT1 levels in hepatocellular carcinoma, nasopharyngeal, colon, and pancreatic cancers, among others, have been demonstrated 12 and related with resistance to antineoplastic compounds such as PD-L1 and EZH2 inhibitors, cisplatin and gemcitabine.13,14
Studies on HAT1 expression in brain tumors are very scarce, limited to meta-analyses of data from repositories. Tu et al. 15 showed a relationship among regulators of acetylation, glioma progression, and tumor-associated immunoregulation. A study about the function of GPX7, a sensor of reactive oxygen species, demonstrated that alterations on its levels can lead to important metabolic changes and tumorigenesis and that GPX7 is closely related to HAT1 expression, especially in high-grade OD and GBM. 16 All suggest that a deeper knowledge about HAT1 on brain tumors is necessary.
Immunodetection Techniques in Histopathology: Antibodies vs Aptamers
Immunohistochemistry (IHC) is one of the most widely used techniques for tumor diagnosis. Some studies theorized that 40–50% of the inconsistencies in IHC diagnostics are related with poor antibody selection, cross-reactions, antibody purification methods, and batch-to-batch variations.
Aptahistochemistry (AHC) is a method using aptamers instead of antibodies. Aptamers are single-stranded DNA or RNA sequences, 20–80 nucleotides in length with a variable central region that allows them to adopt unique three-dimensional structures, and can bind to their target with high affinity and specificity.17,18 DNA and RNA aptamers are functionally similar, but DNA aptamers are inherently more stable, cheaper, and easier to select. 19
Aptamers are potentially useful for disease diagnosis, as novel therapeutic tools, as drug carriers, for bioimaging labeling, as biosensors, in food inspection, and for nanoparticle targeting. Produced by chemical synthesis, there is little or no batch-to-batch variation, and unlike antibodies, the selection and synthesis of aptamers do not require the use of animals. They can be selected against all types of molecules, including non-immunogenic proteins and toxins, unlike antibodies, and are much smaller in size (5–30 KDa), allowing more efficient entry into the cell, whereas the size of most antibodies (150–180 KDa) usually limits their access to cellular compartments. The conditions of aptamer selection are modifiable according to the requirements of the target and the intended application, whereas antibodies are obtained only under physiological conditions.20–22
Over the last decade, aptamers-targeting proteins overexpressed in tumors have become optimal tools for specific recognition of these biomarkers. Consequently, the adaptation of aptamer-based technologies to real diagnostic methods could provide a great opportunity to advance cancer detection. 19 Currently, however, only antibodies are widely used both commercially and clinically for IHC, but aptamers are useful for the detection of molecules by similar methods with clear advantages in sensitivity and specificity over antibodies.23–25 Recently, Klett-Mingo et al. 26 selected and characterized aptamers against HAT1 (apHAT63 and apHAT610), with antineoplastic effects on lung cancer cells, which inhibited HAT1 activity. We tested those aptamers for AHC and found them useful for HAT1 labeling on tissue sections. Based on recent data from the literature, we hypothesize that HAT1 levels could be increased in the most aggressive brain primary cancers, and that aptamers against HAT1 might be a new and sensitive tool for its analysis.
Materials and Methods
Selection of Samples
We selected sections (5-μm thick), mounted them on 3-aminopropyl-triethoxy-silane–coated slides, from paraffin-embedded samples, provided by the Pathology Department at Hospital Ramón y Cajal, and stored at our lab sample collection since 2006. Some of them were used previously for other studies. 27 We retrieved samples from 79 patients diagnosed with intracranial neoplasms between 1983 and 2006. We analyzed 32 meningiomas (M, grades 1 and 2 n=14 and grade 3 n=18) and 45 neuroglial tumors: 12 OD (grade 2 n=7 and grade 3 n=5), 8 astrocytomas (A, grades 1 and 2), and 23 GBM. We used non-tumoral brain tissues (n=4) as controls. The follow-up available for those samples at our databank, however, was limited to three to four years. Since the samples date back many years, molecular data, as required by the new WHO classification, were not available. Therefore, they classified within the NOS rank, which allows for a morphology-based classification.
Immunohistochemistry
For IHC, we used a rabbit polyclonal anti-HAT1 antibody (GeneTex, GTX110643, CA, USA) that recognizes the protein catalytic subunit between amino acids 36 and 419 (Uniprot ID#O14929). Sections were deparaffined and rehydrated, and heat-induced epitope retrieval (HIER) was performed with Tris-ethylenediaminetetraacetic acid (EDTA) buffer (T-E; 50-mM Tris–1-mM EDTA, pH 9) or citrate buffer (citric acid-sodium citrate, 10 mM, pH=5). A domestic electric pressure cooker was used (160C, pressure 45–55 Kpa, for 4 min, followed by slow cooling in the same buffer for 20 min). Sections were washed with double-distilled water (ddH2O), and endogenous peroxidase was inhibited with 3% H2O2 in ddH2O for 10 min and washed with Tris-buffered saline (TBS, pH 7.5). Samples were then incubated with 0.1% Triton X-100 in TBS for 5 min at room temperature, incubated with the anti-HAT1 antibody (diluted 1:800 in TBS-0.05% Triton X-100) for 24 hrs at 19C, and washed with TBS-0.05% Triton X-100. The primary antibody signal was amplified and detected using the Master Polymer Plus Detection System Peroxidase kit reagents (Master Diagnóstica, Spain), with 3-3′-diaminobenzidine (DAB) as chromogen, following the manufacturer’s specifications. The nuclei were stained with Caracci’s hematoxylin, and the sections were dehydrated with ethanol solutions, cleared with xylene and coverslipped with Entellan (Merck Millipore, Germany).
Aptahistochemistry
The digoxigenin-conjugated aptamers apHAT610 (Kd=28.11 nM) and apHAT63 (Kd=38.01 nM), selected against the sequence corresponding to HAT1 variant b (HAT1b, Uniprot ID#O14929-2), were used (Biomers, Germany). The sequence of HAT1b is contained within the sequence of HAT1a. The aptamers were diluted and structured in phosphate-buffered saline pH 7.4 plus 1-mM MgCl2 (PBS-MgCl2), at 95C for 10 min, followed by fast-cooling on ice at 4C for 10 min. The initial processing of the sections from deparaffinization to endogenous peroxidase inhibition was the same as described for IHC. For AHC, PBS-MgCl2 buffer was used instead of TBS, maintaining the same concentrations of Triton X-100 and the same incubation times and temperatures. Digoxigenin was labeled with a peroxidase-conjugated anti-digoxigenin antibody (Sigma-Aldrich, Germany) at 1:200 dilution in PBS–1-mM MgCl2, for 1 hr at room temperature. Peroxidase activity was detected using the DAB solution supplied with the kit used for IHC. For IHC controls, non-immune rabbit serum was used instead of the primary antibody; for AHC controls, an irrelevant digoxigenin-conjugated anti-IgG aptamer (Biomers) 28 was used instead of HAT1 aptamers.
Analysis of the Results
The samples were studied using a transmitted light microscope Leica DM1000 (Leica, Germany) equipped with a 10 megapixels OPTIKA 4083.B5 digital camera and OPTIKA View software (Optika Microscopes, Italy). For image analysis, the micrographs were obtained with a 40× objective (numerical aperture 0.65) at a resolution of 1280 × 960 pixels, 28,346 pixels/cm. The settings used for all the samples were as follows: light 6.5 (potentiometer scale), ISO200; gamma 3; contrast: 12; saturation: edge, sharp, 50 Hz; and RGB correction: 55, 63, 134. The images were stored in Tiff format. In each working session, we used an image of an unsampled area for light and color background correction. A minimum of 200 cells for each sample were analyzed using ImageJ. We used the plugging “IHC profiler” for optical deconvolution of the RGB image, separating the three channels: red (immunostaining) and green and blue (hematoxylin). The number of stained nuclei was determined using the red channel (DAB), and the blue channel was used to determine the total cell nuclei. On the red channel, the region to be analyzed was manually selected by adjusting the area of interest according to its signal intensity on a scale from 0 to 255 (threshold): 0 represents the maximum signal intensity and 255 the minimum (maximum target level). The average nuclear (fN) or total (f) DAB signal intensity was calculated according to the formula f or fN = 255 − i (i=average DAB intensity obtained between the ranges of 0 and 255). The difference between f and fN provided the value for the cytosolic signal intensity, necessary to determine the nucleus/cytoplasm signal ratio. The second extension used was ImmunoRatio (IR), to determine the stained nuclear surface area relative to the total nuclear surface area. All the blue-stained nuclei from non-tumor cell types were erased from the image by using the free-hand selection tool. The IHC and the AHC indexes corrected for IR (IHC-IR and AHC-IR) were determined by using the formula (fN × IR)/100.
The results were analyzed using Graphpad Prism software (MA, USA). For statistical analysis, we used the parametric Mann–Whitney test, the one-way analysis of variance (ANOVA) with the Newman-Keuls post-test for multiple comparison, and the Spearman’s test (95% confidence interval) for correlation analysis.
Results
Optimization of the AHC Method
To select the HIER method, we compared the results obtained using low-pH (citrate) and high-pH (T-E) buffers (Fig. 1A–H). Previous analyses from our laboratory showed good results with apHAT610 diluted at 12.5 nM, using T-E for HIER, and the antibody worked well at 1:800 dilution, so we used this aptamer for method optimization. The staining with the antibody diluted 1:500 after T-E HIER was somewhat stronger than that obtained when diluted 1:800, but the signal/background noise ratio also worsened, and the antibody was used at the higher dilution. We observed a lower signal intensity and fewer labeled nuclei with the antibody when citrate buffer was used for HIER, with no improvement at 1:500 dilution. The signal obtained by using apHAT610 was similar with both citrate and T-E buffers or even better using the last one. T-E was selected as the most suitable buffer for this study. The aptamers worked well at lower HIER times (2 and 3 min), but the best signal intensity was observed at 4 min. The antibody worked better at 4 min HIER, but with a low intensity of signal at 3 min and 2 min, and so we selected 4 min as the HIER time. Using the antibody, 2 hrs were insufficient to detect any signal. Conversely, apHAT610 allowed short incubation times at the same concentration (12.5 nM), as the signal obtained after 2 hrs was similar to that obtained after incubation for 24 hrs. Without prior antigenic recovery, no signal was observed nor with the antibody or with the aptamers (Fig. 1I–P).
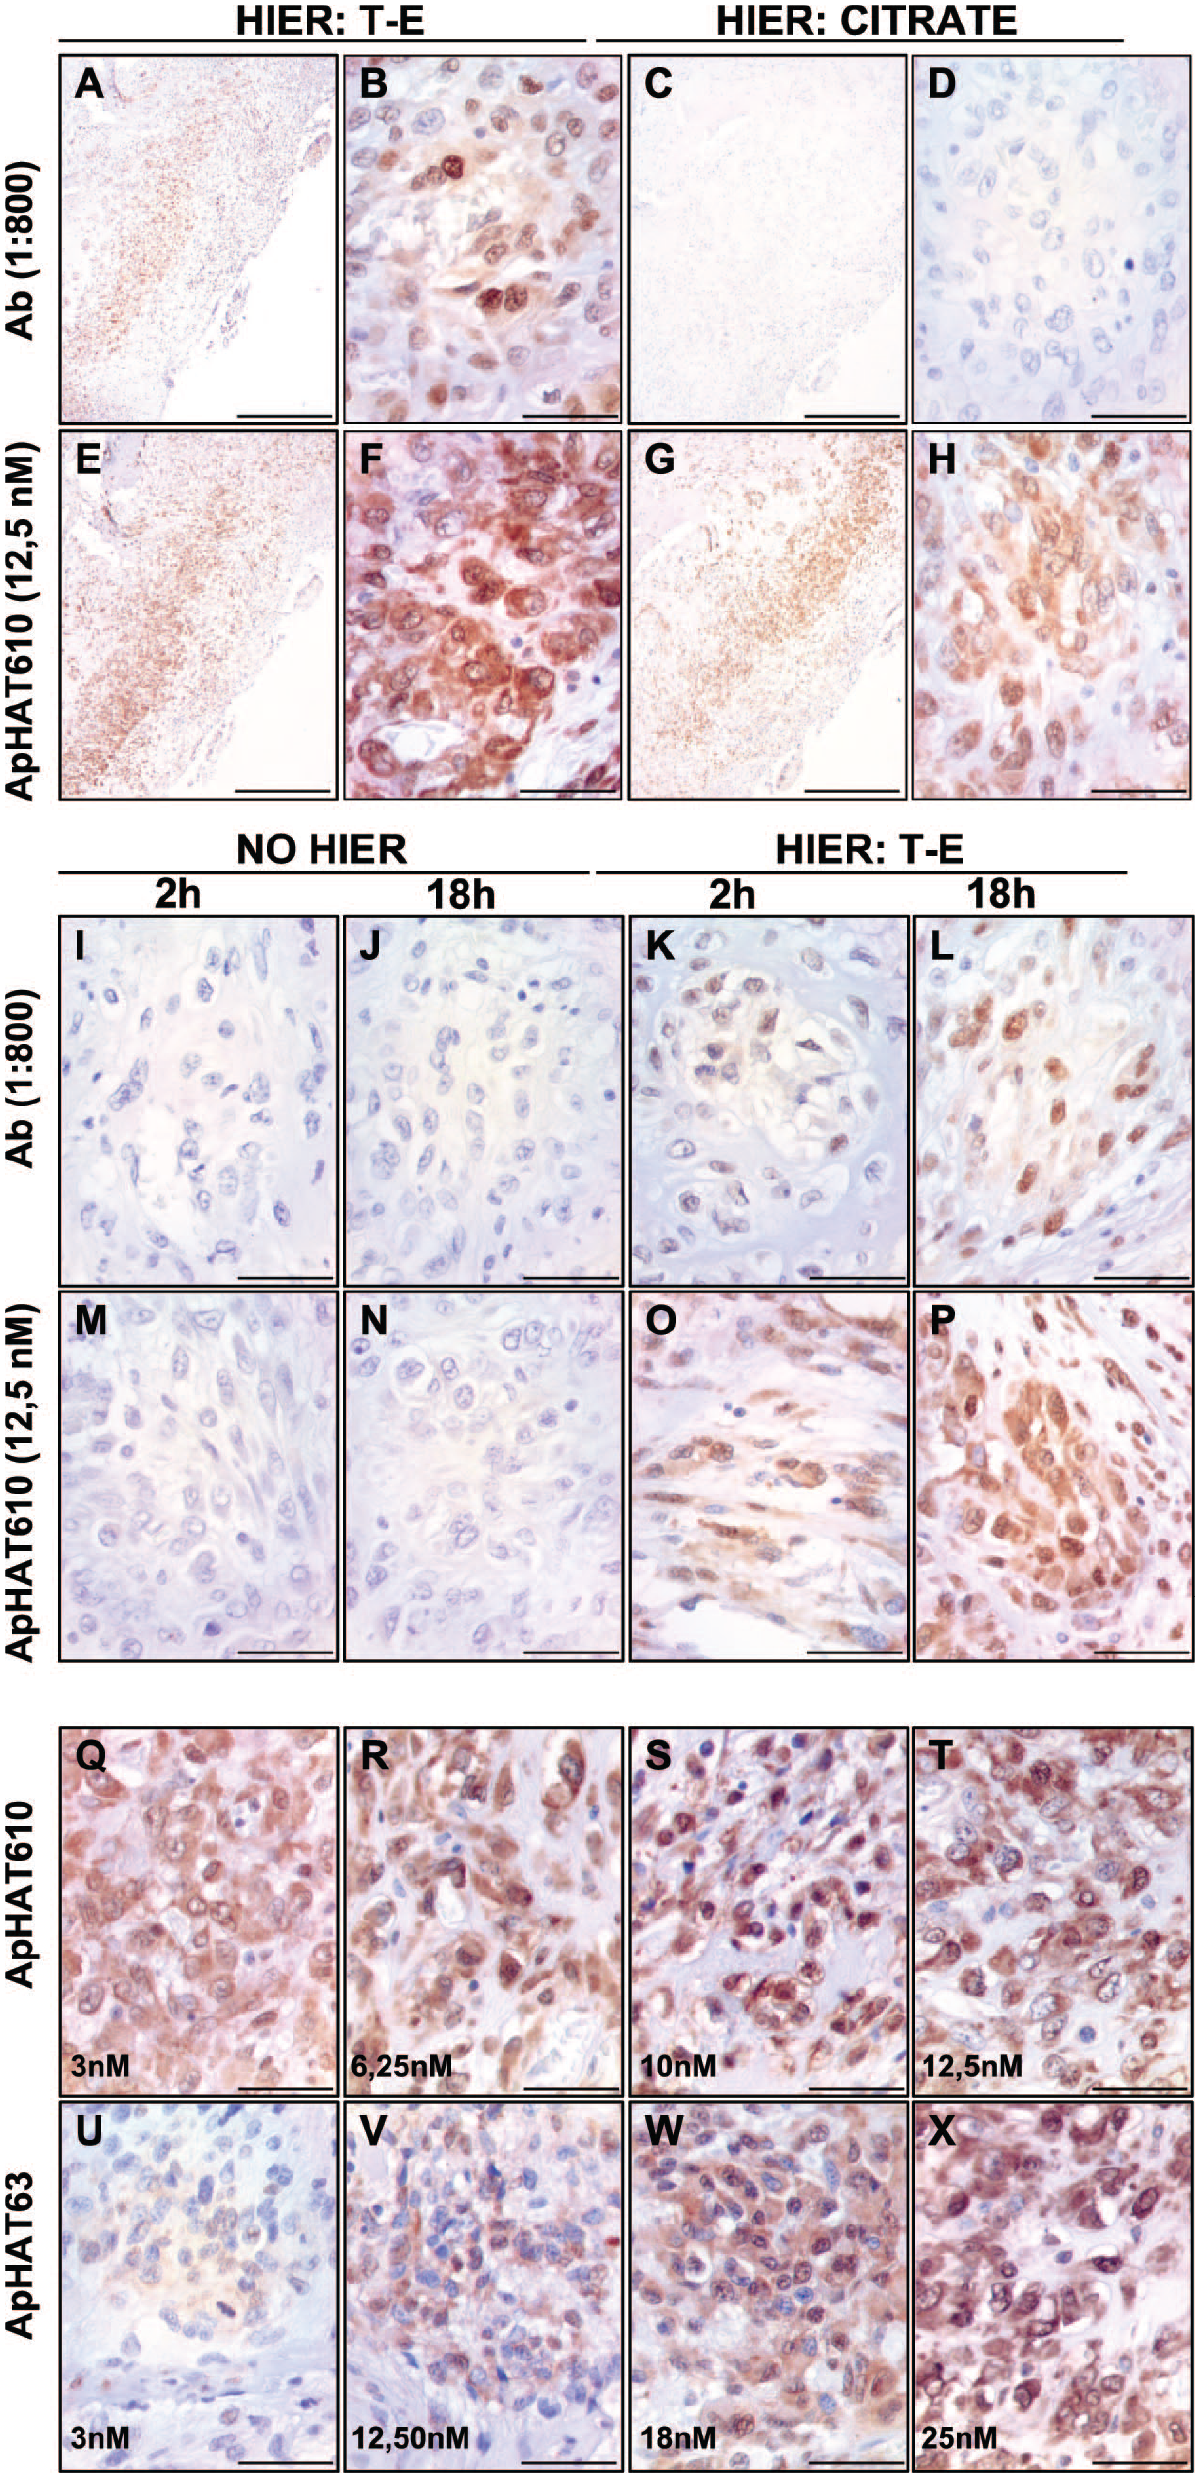
Optimization of the AHC method. IHC (Ab: antibody) and AHC (ApHAT610 y ApHAT63, aptamers). A–H: selection of buffer for antigen retrieval (HIER). Abbreviation: T-E, Tris-EDTA buffer, pH=8. Citrate: buffer at pH=5. We selected T-E buffer for HIER. I–P: results obtained without HIER (I, J, M, N) and HIER with T-E buffer (K, L, O, P), at 2-hr or 18-hr incubation with the antibody or the aptamer. Incubation for 18 hrs offered the best results. Q–X: Incubation with the aptamers for 18 hrs, at different concentrations. We decided to use the aptamer apHAT610 diluted 10 nM for our study. Magnification: 40× (A, C, E, G, bars: 500 µm) and 400× (B, D, F, H, bars: 10 µm).
Afterwards, we tested both apHAT610 and apHAT63 to select the aptamer for our study. We tested several dilutions for each aptamer, to determine the optimal dilutions to obtain a similar staining intensity with both of them. Finally, ApHAT610 was used at 3 nM, 6.25 nM, 10 nM, and 12.5 nM, and apHAT63 at 3 nM, 12.5 nM, 18 nM, and 25 nM (Fig. 1Q–X). The staining pattern was similar for both aptamers, but apHAT610 offered a superior performance at lower concentrations, so this aptamer (10 nM) was selected for our study. We did not observe the background over necrotic areas, cell debris, vessels’ contents, or intercellular spaces with both aptamers, and unlike the antibody, a higher aptamer concentration did not lead to an increase in non-specific signals.
HAT1 Detection in Brain Tumors
IHC and AHC showed that HAT1 expression at the normal brain cortex was low and restricted to the soma of some neurons. The signal was weak-diffuse at the cytoplasm and nuclei of some glial cells, but most cells were negative for HAT1 (Fig. 2A and B). The nucleoli were negative, and the vascular endothelia were unstained.
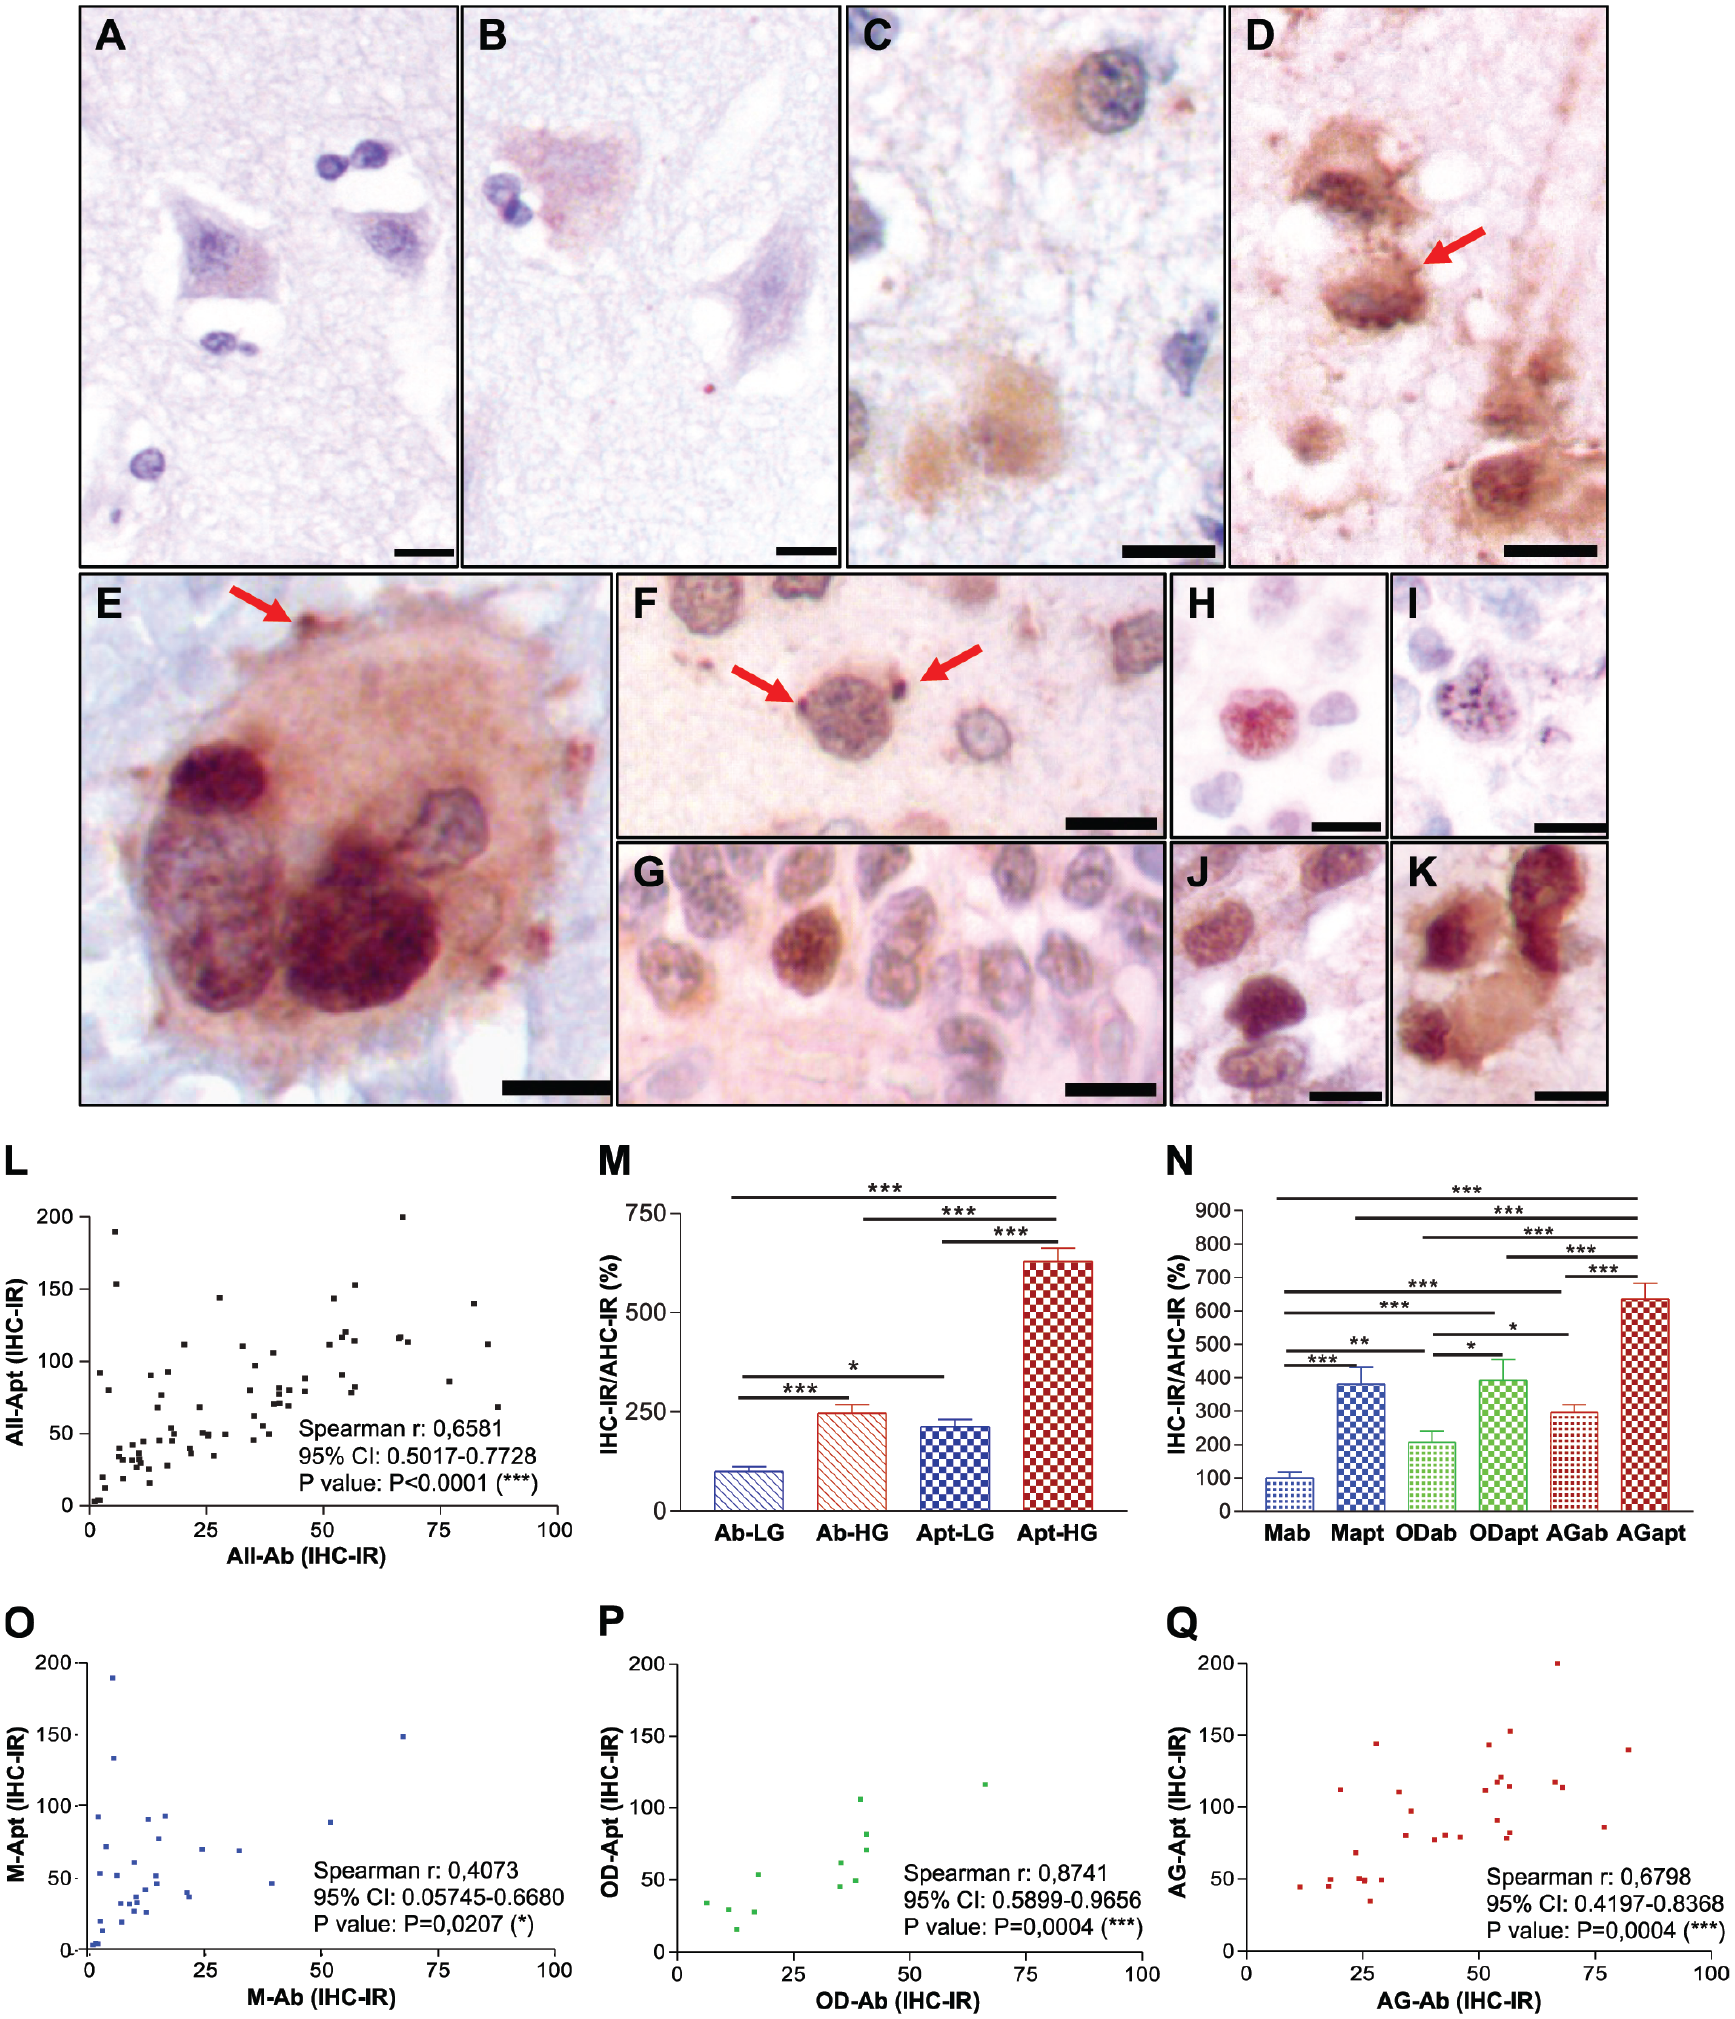
HAT1 subcellular distribution in non-tumor and tumor cells. IHC and AHC analysis of HAT1 in brain normal cortex and primary glial tumors. IHC: A, C, G, H, J. AHC: B, D, E, F, I, K. Normal cortical cells, weak or no HAT1 labeling, nor with the antibody (A) or the aptamer (B). Low-grade tumors, nuclear staining for HAT1 with both methods (F and G: grade 2 OD; H and I: grade 2 astrocytomas). High-grade glial tumors (C and D: grade 3 OD; E, J, and K: GBM), nuclear and cytosolic HAT1; punctate cytosolic and membrane staining pattern (arrows, images D and E). (E, I, and H) Punctate nuclear HAT1 staining. (F) Aptamer, intense staining of perinuclear dots (arrows). (L) Correlation analysis (Spearman test, 95% CI) between HAT1 staining using IHC and AHC in all samples, irrespective of tumor type or grade. (M) Analysis of IHC-IR and AHC-IR in low-grade vs high-grade tumors, data normalized against IHC-IR/AHC-IR obtained using IHC in antibody-stained low-grade tumors. Mann–Whitney test. Ab: antibody, low-grade (Ab-LG) and high-grade (Ab-HG) tumors; Apt: aptamer, low-grade (Apt-LG) and high-grade (Apt-HG) tumors. (N) Analysis of IHC-IR and AHC-IR vs tumor type, data normalized against IHC-IR/AHC-IR obtained using IHC in antibody-stained meningiomas. M: meningioma, antibody (M-ab) and aptamer (M-apt); OD: oligodendroglial tumors, antibody (OD-ab) and aptamer (OD-apt); AG: astroglial tumors, antibody (AG-ab) and aptamer (AG-apt). (O, P, and Q) Correlation analysis (Spearman test, 95% CI) between HAT1 staining using IHC and AHC in meningiomas (O), oligodendrogliomas (P), and glial tumors (Q). OD and AG show the most significant correlation between antibody and aptamer staining. Mann–Whitney tests: *p<0.05; **p<0.01; ***p<0.001. All micrographs: 400×, bars: 10 µm.
Compared with control tissues, all the studied tumors showed a stronger staining for HAT1 with both IHC and AHC. HAT1 was mainly localized at the cell nucleus with a dotted distribution pattern, observed at superior resolution with the use of the aptamer. The most intense nuclear signals were detected in high-grade tumors (GBM, OD grade 3 and M grade 3). In samples immunostained with the antibody, some GBM (Figs. 2J and 5), high-grade OD (Figs. 2C and 4), and M (Fig. 3) also showed a weak-moderate cytosolic staining with a diffuse distribution pattern. With the use of the aptamer, both nuclear and cytosolic signals were clear, with a predominantly punctate distribution pattern (Fig. 2D, E, F, I, and K). In high-grade tumors, we observed an intense dotted signal in the nucleus and an increase in cytosolic signal especially in high-grade OD and GBM (Figs. 2D, E, and K, 4, and 5). At GBM giant cells, the periphery of the cells stained mainly at protrusions from the plasma membrane, with a pattern hardly detected with the antibody (Fig. 2E). Vascular endothelia from tumor samples were frequently immunopositive for HAT1. The IHC-IR score obtained with the aptamer showed a significant correlation with that obtained with the use of the antibody (r = 0.6566, p<0.0001; Fig. 2L).
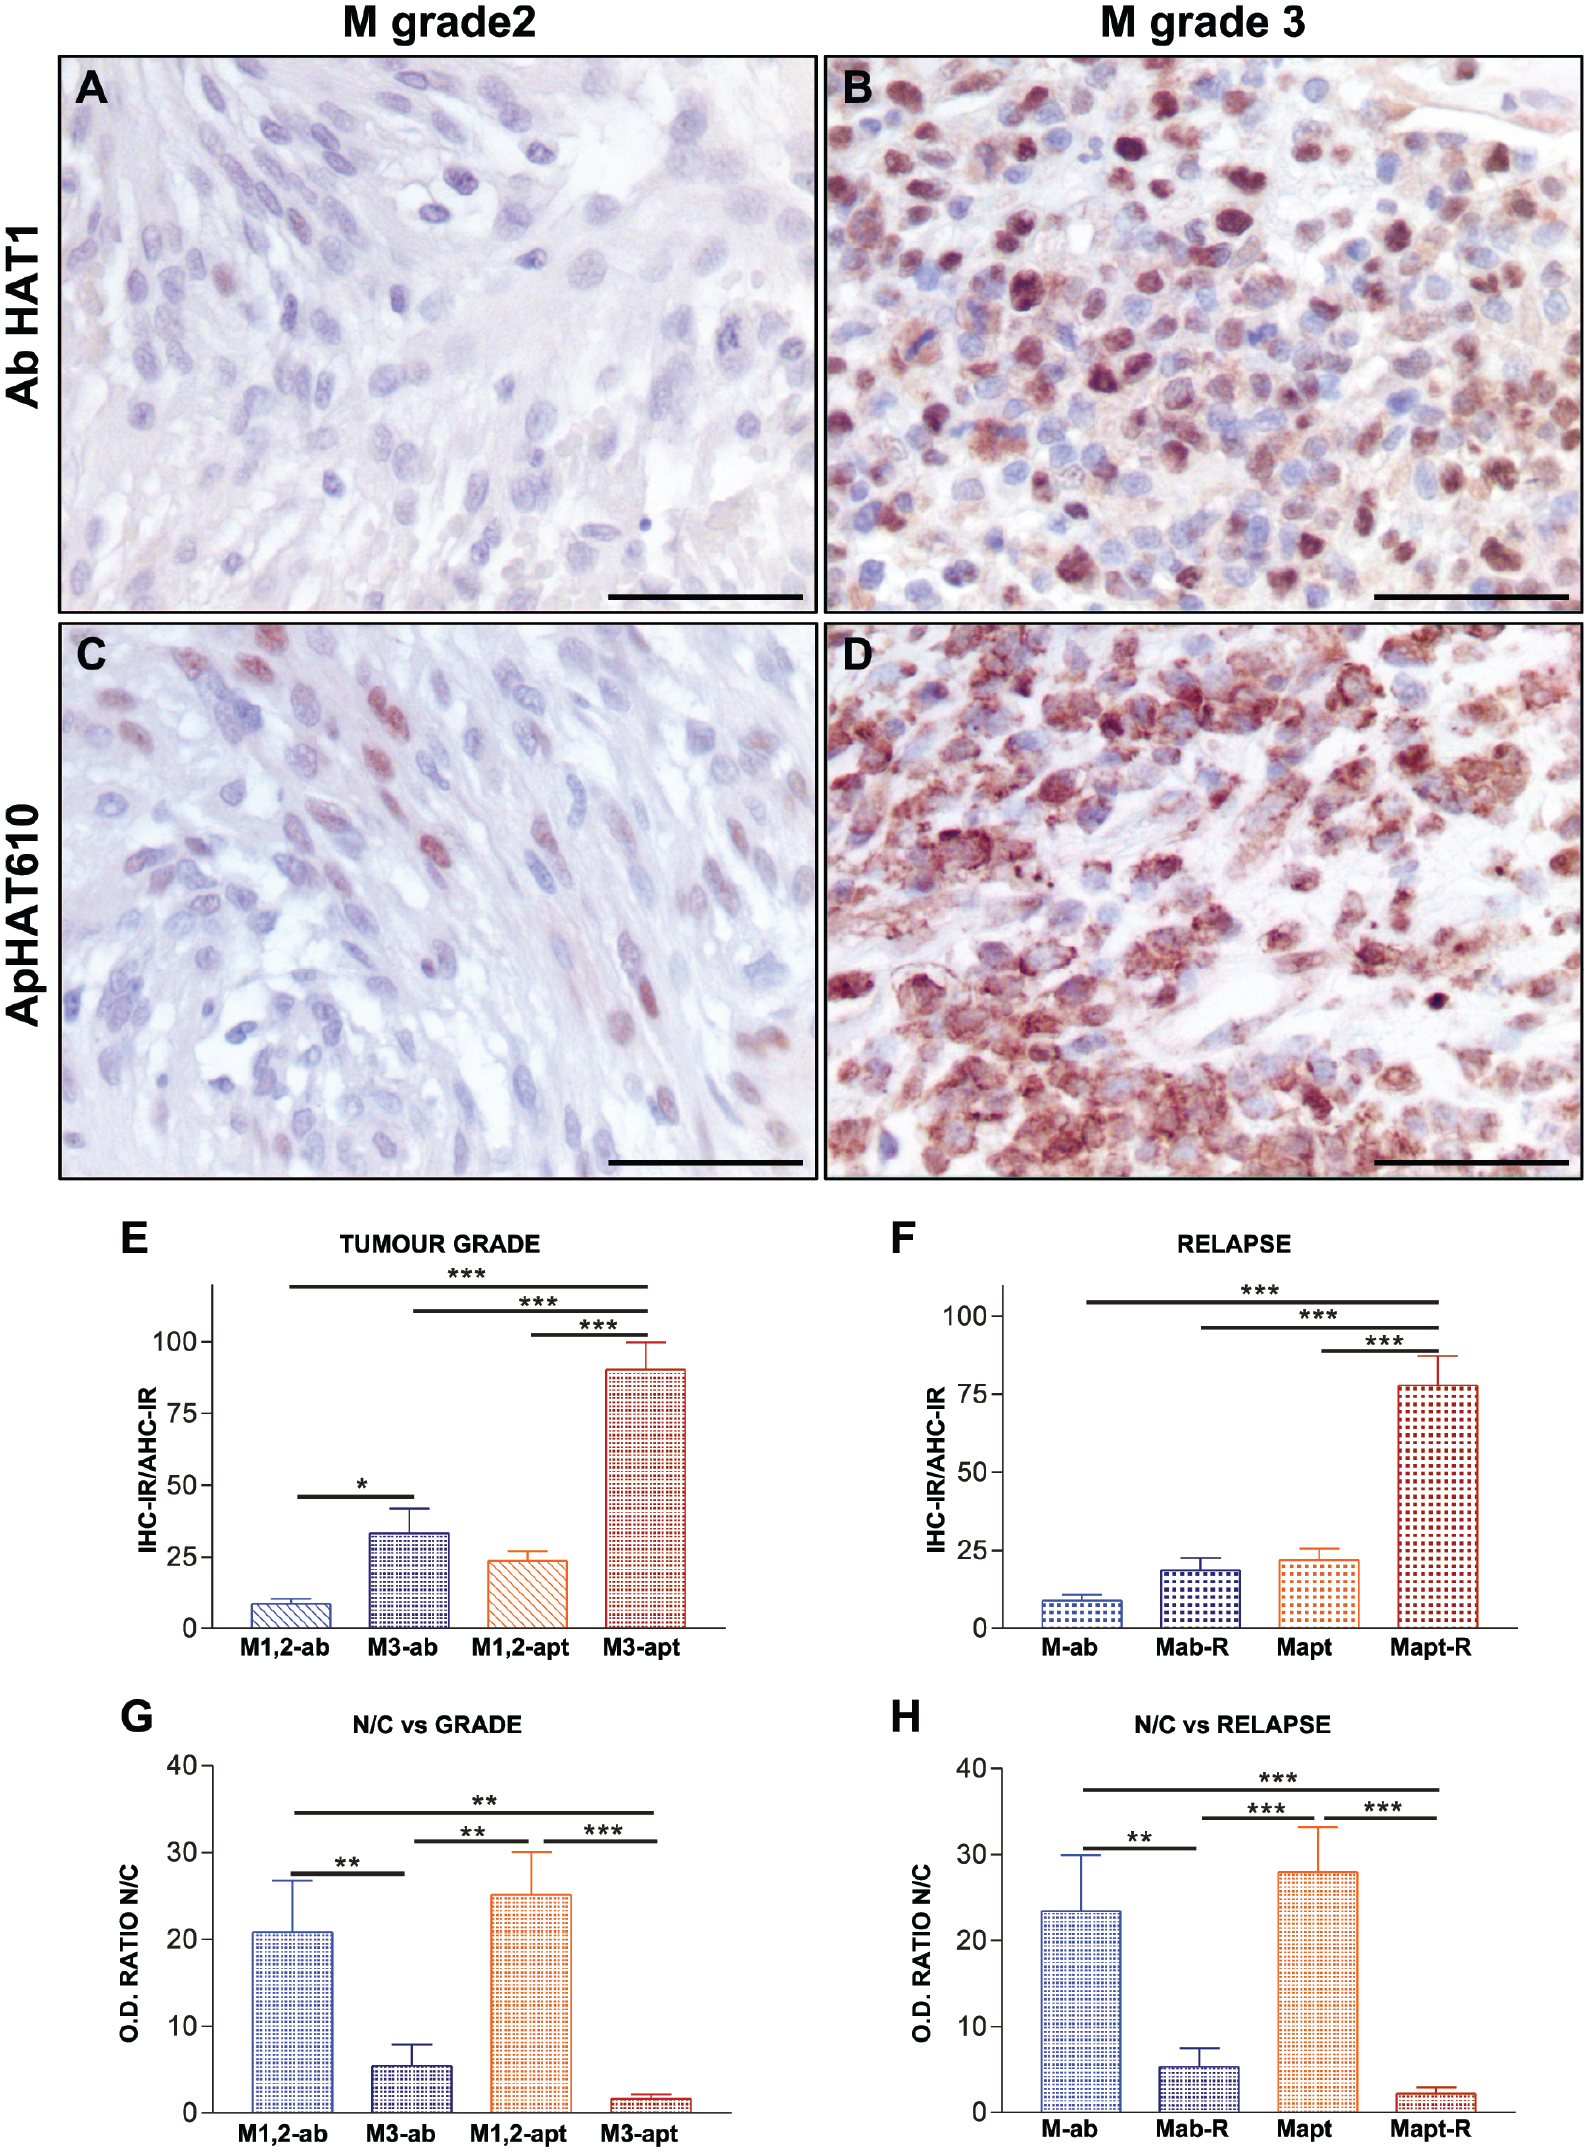
Hat1 detection in meningiomas. (A–D) IHC and AHC staining of meningiomas (M). (A and B) IHC; (C and D) AHC. (A and C) Low-grade tumors (M2, grade 2), scarce nuclear staining, most efficiently detected using the aptamer. (B and D) High-grade tumors (M3, grade 3), intense HAT1 staining. Besides cell nuclei, aggressive meningiomas show increased levels of cytosolic HAT1, more noticeable with the use of the aptamer. All micrographs: 400×, bars: 10 µm. (E, F, G, and H) Mann–Whitney tests: *p<0.05; **p<0.01; ***p<0.001. Abbreviations: ab, antibody; apt, aptamer. (E) Analysis of IHC-IR and AHC-IR in M1 and M2 vs M3. We observed a significant increase of nuclear HAT1 levels in M3, but this significance is higher with the use of the aptamer. (F) Analysis of IHC-IR and AHC-IR in M vs recidivant disease (M-R). With the use of the aptamer, early tumor relapse is significantly related with higher nuclear HAT1 levels at diagnosis. (G) Analysis of nuclear vs cytoplasmic staining intensity for HAT1 in M1 and M2 vs M3. Abbreviations: N/C, nuclear/cytosolic ratio; OD, optical density. High-grade M show a significant increase of HAT1 cytosolic staining intensity (lower N/C ratios). (H) Analysis of nuclear vs cytosolic staining intensity in patients with recidivant and no recidivant disease. Early tumor relapse significantly correlate with higher cytosolic HAT1 staining (lower N/C ratios) at diagnosis.
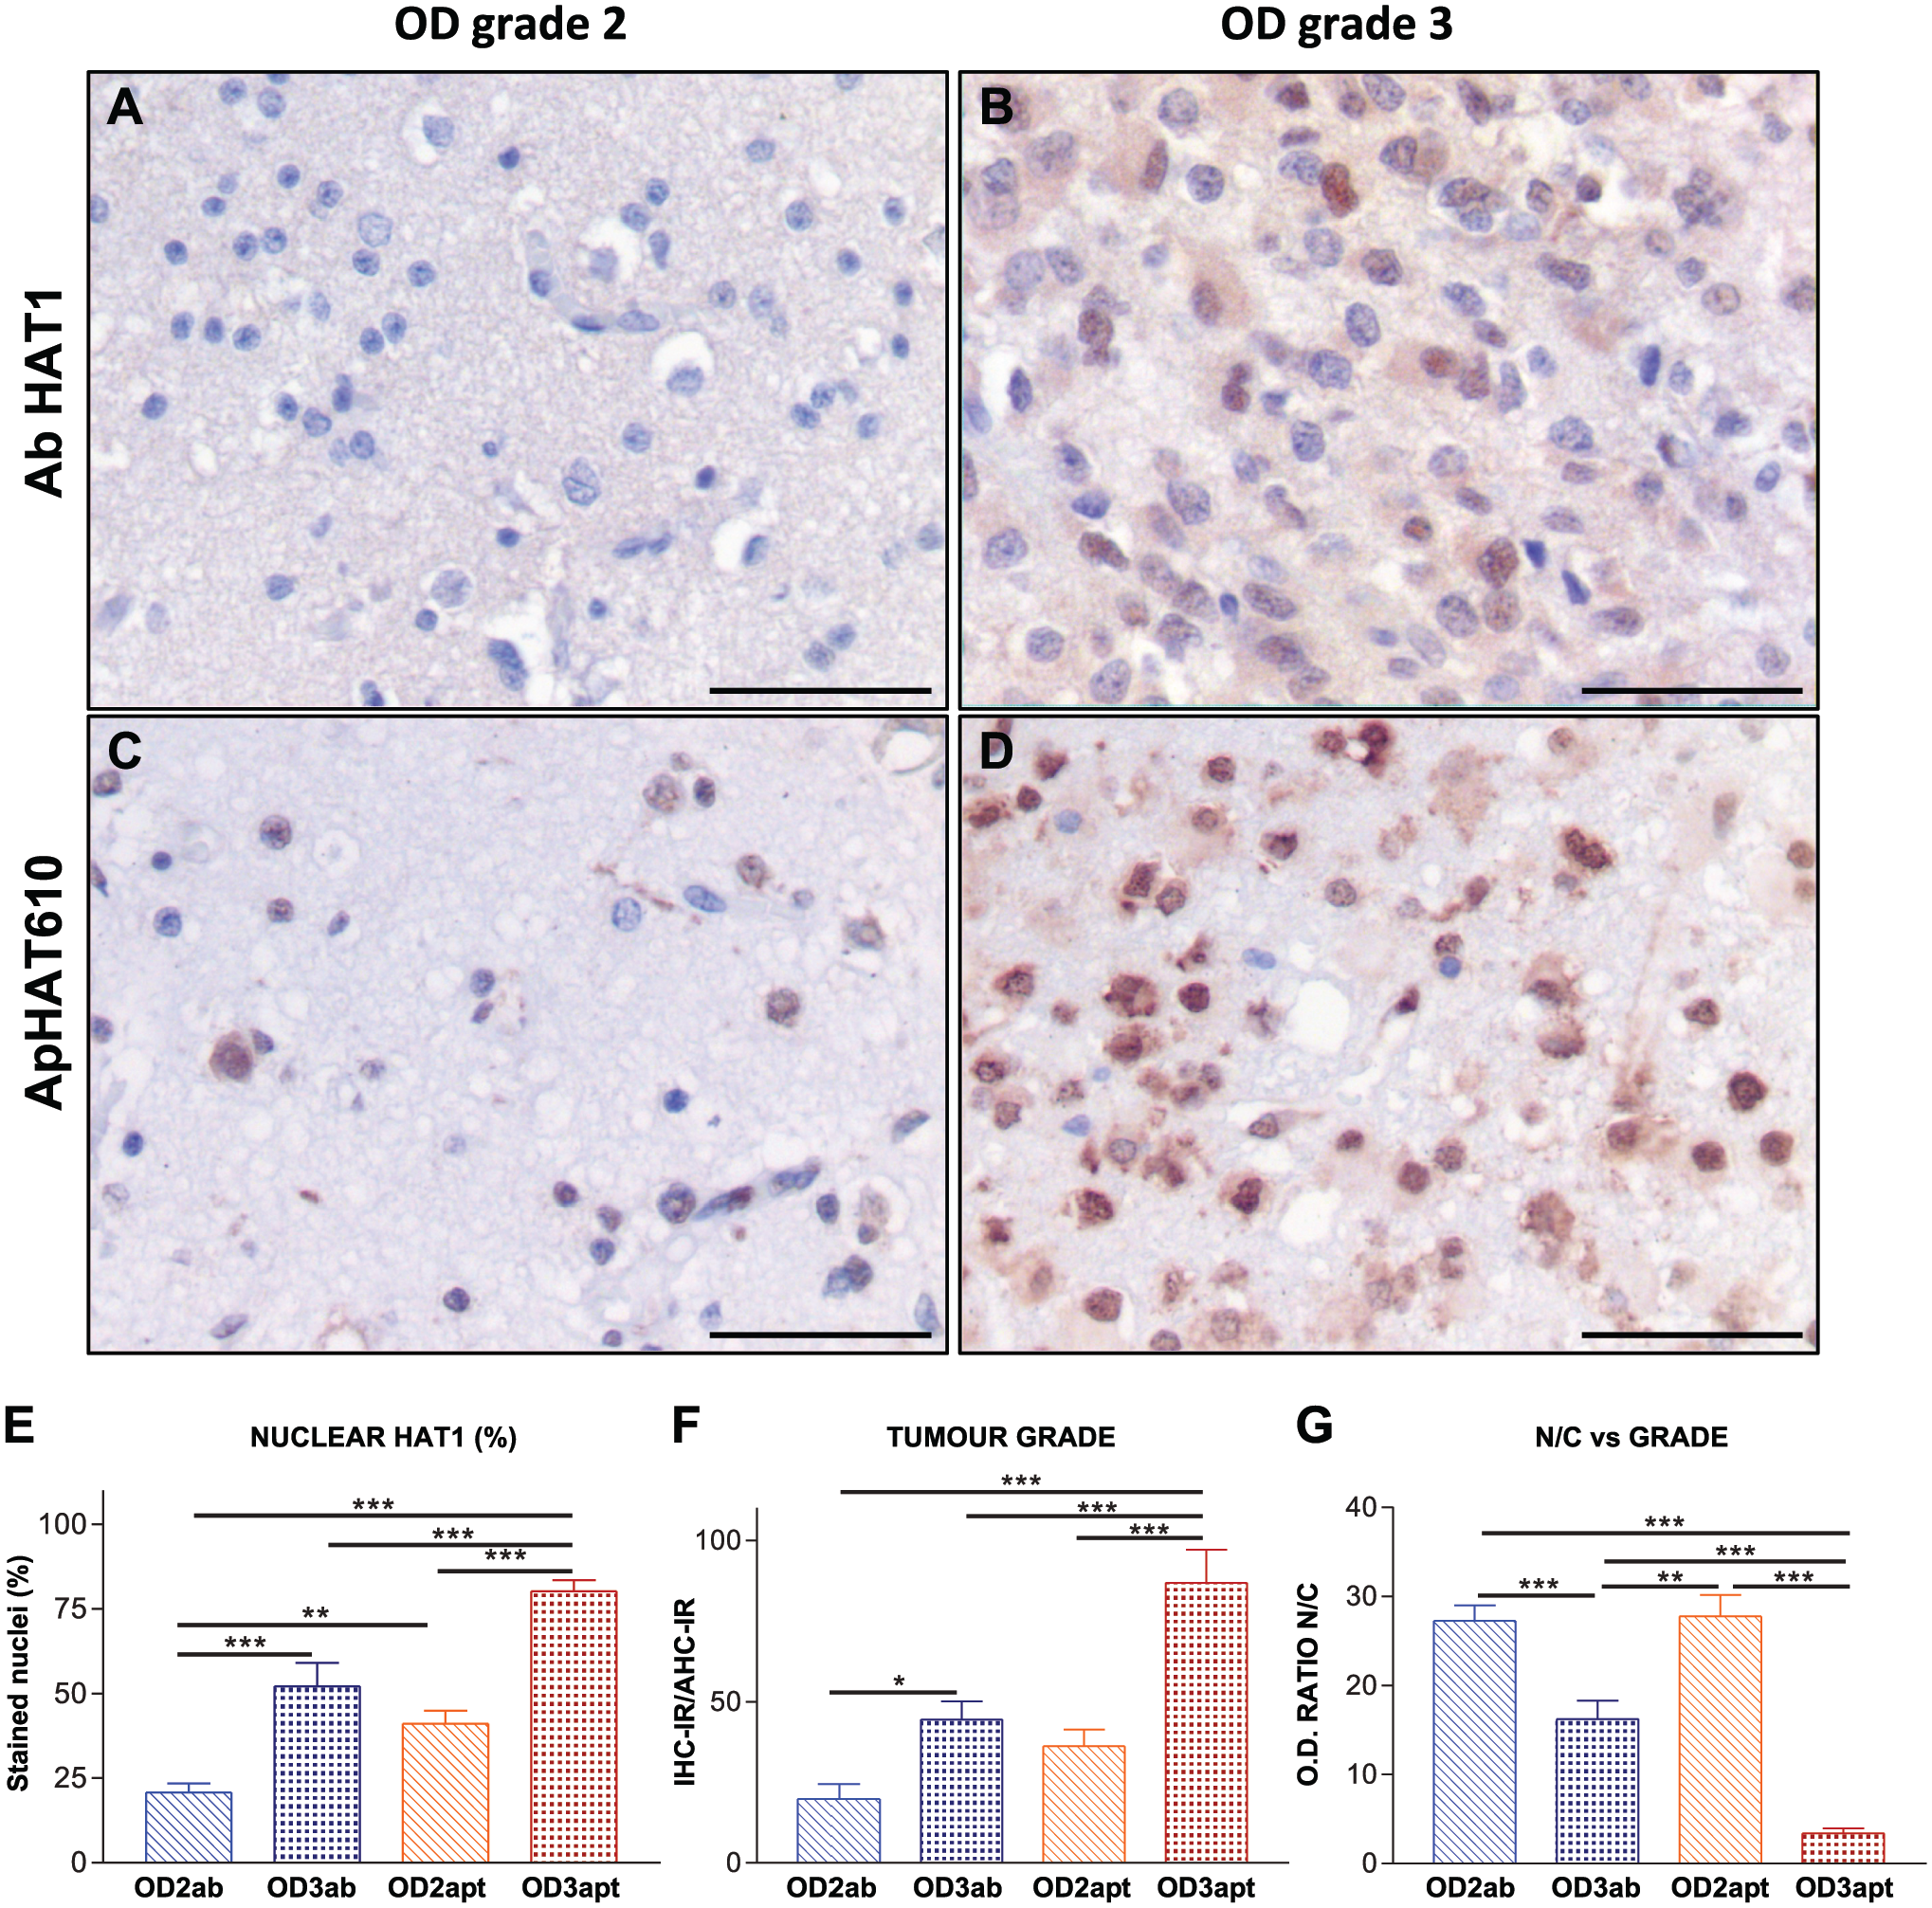
Hat1 detection in oligodendroglial tumors. (A–D) IHC and AHC staining of oligodendrogliomas (OD). (A and B) IHC. (C and D) AHC. (A and C) Low-grade tumors (OD2, grade 2), negative nuclear staining when using the antibody, low signal intensity with the use of the aptamer. (B and D) High-grade tumors (OD3, grade 3), positive (antibody) and intense (aptamer) HAT1 staining. High-grade OD also show increased levels of cytosolic HAT1. All micrographs: 400×, bars: 10 µm. (E, F, and G) Mann–Whitney tests: *p<0.05; **p<0.01; ***p<0.001. Abbreviations: ab, antibody; apt, aptamer. (E) HAT1 immunopositive nuclei (%, OD2 vs OD3). The percentage of labeled nuclei is significantly higher with the use of the aptamer. (F) Analysis of IHC-IR and AHC-IR in OD2 vs OD3. The significance is higher with the use of the aptamer. (G) Analysis of nuclear vs cytoplasmic staining intensity for HAT1 in OD2 vs OD3. Abbreviations: N/C, nuclear/cytosolic ratio; OD, optical density. OD3 show significantly higher levels of HAT1 cytosolic staining intensity (lower N/C ratios), although N/C ratios in OD3 are even lower with the use of the aptamer.
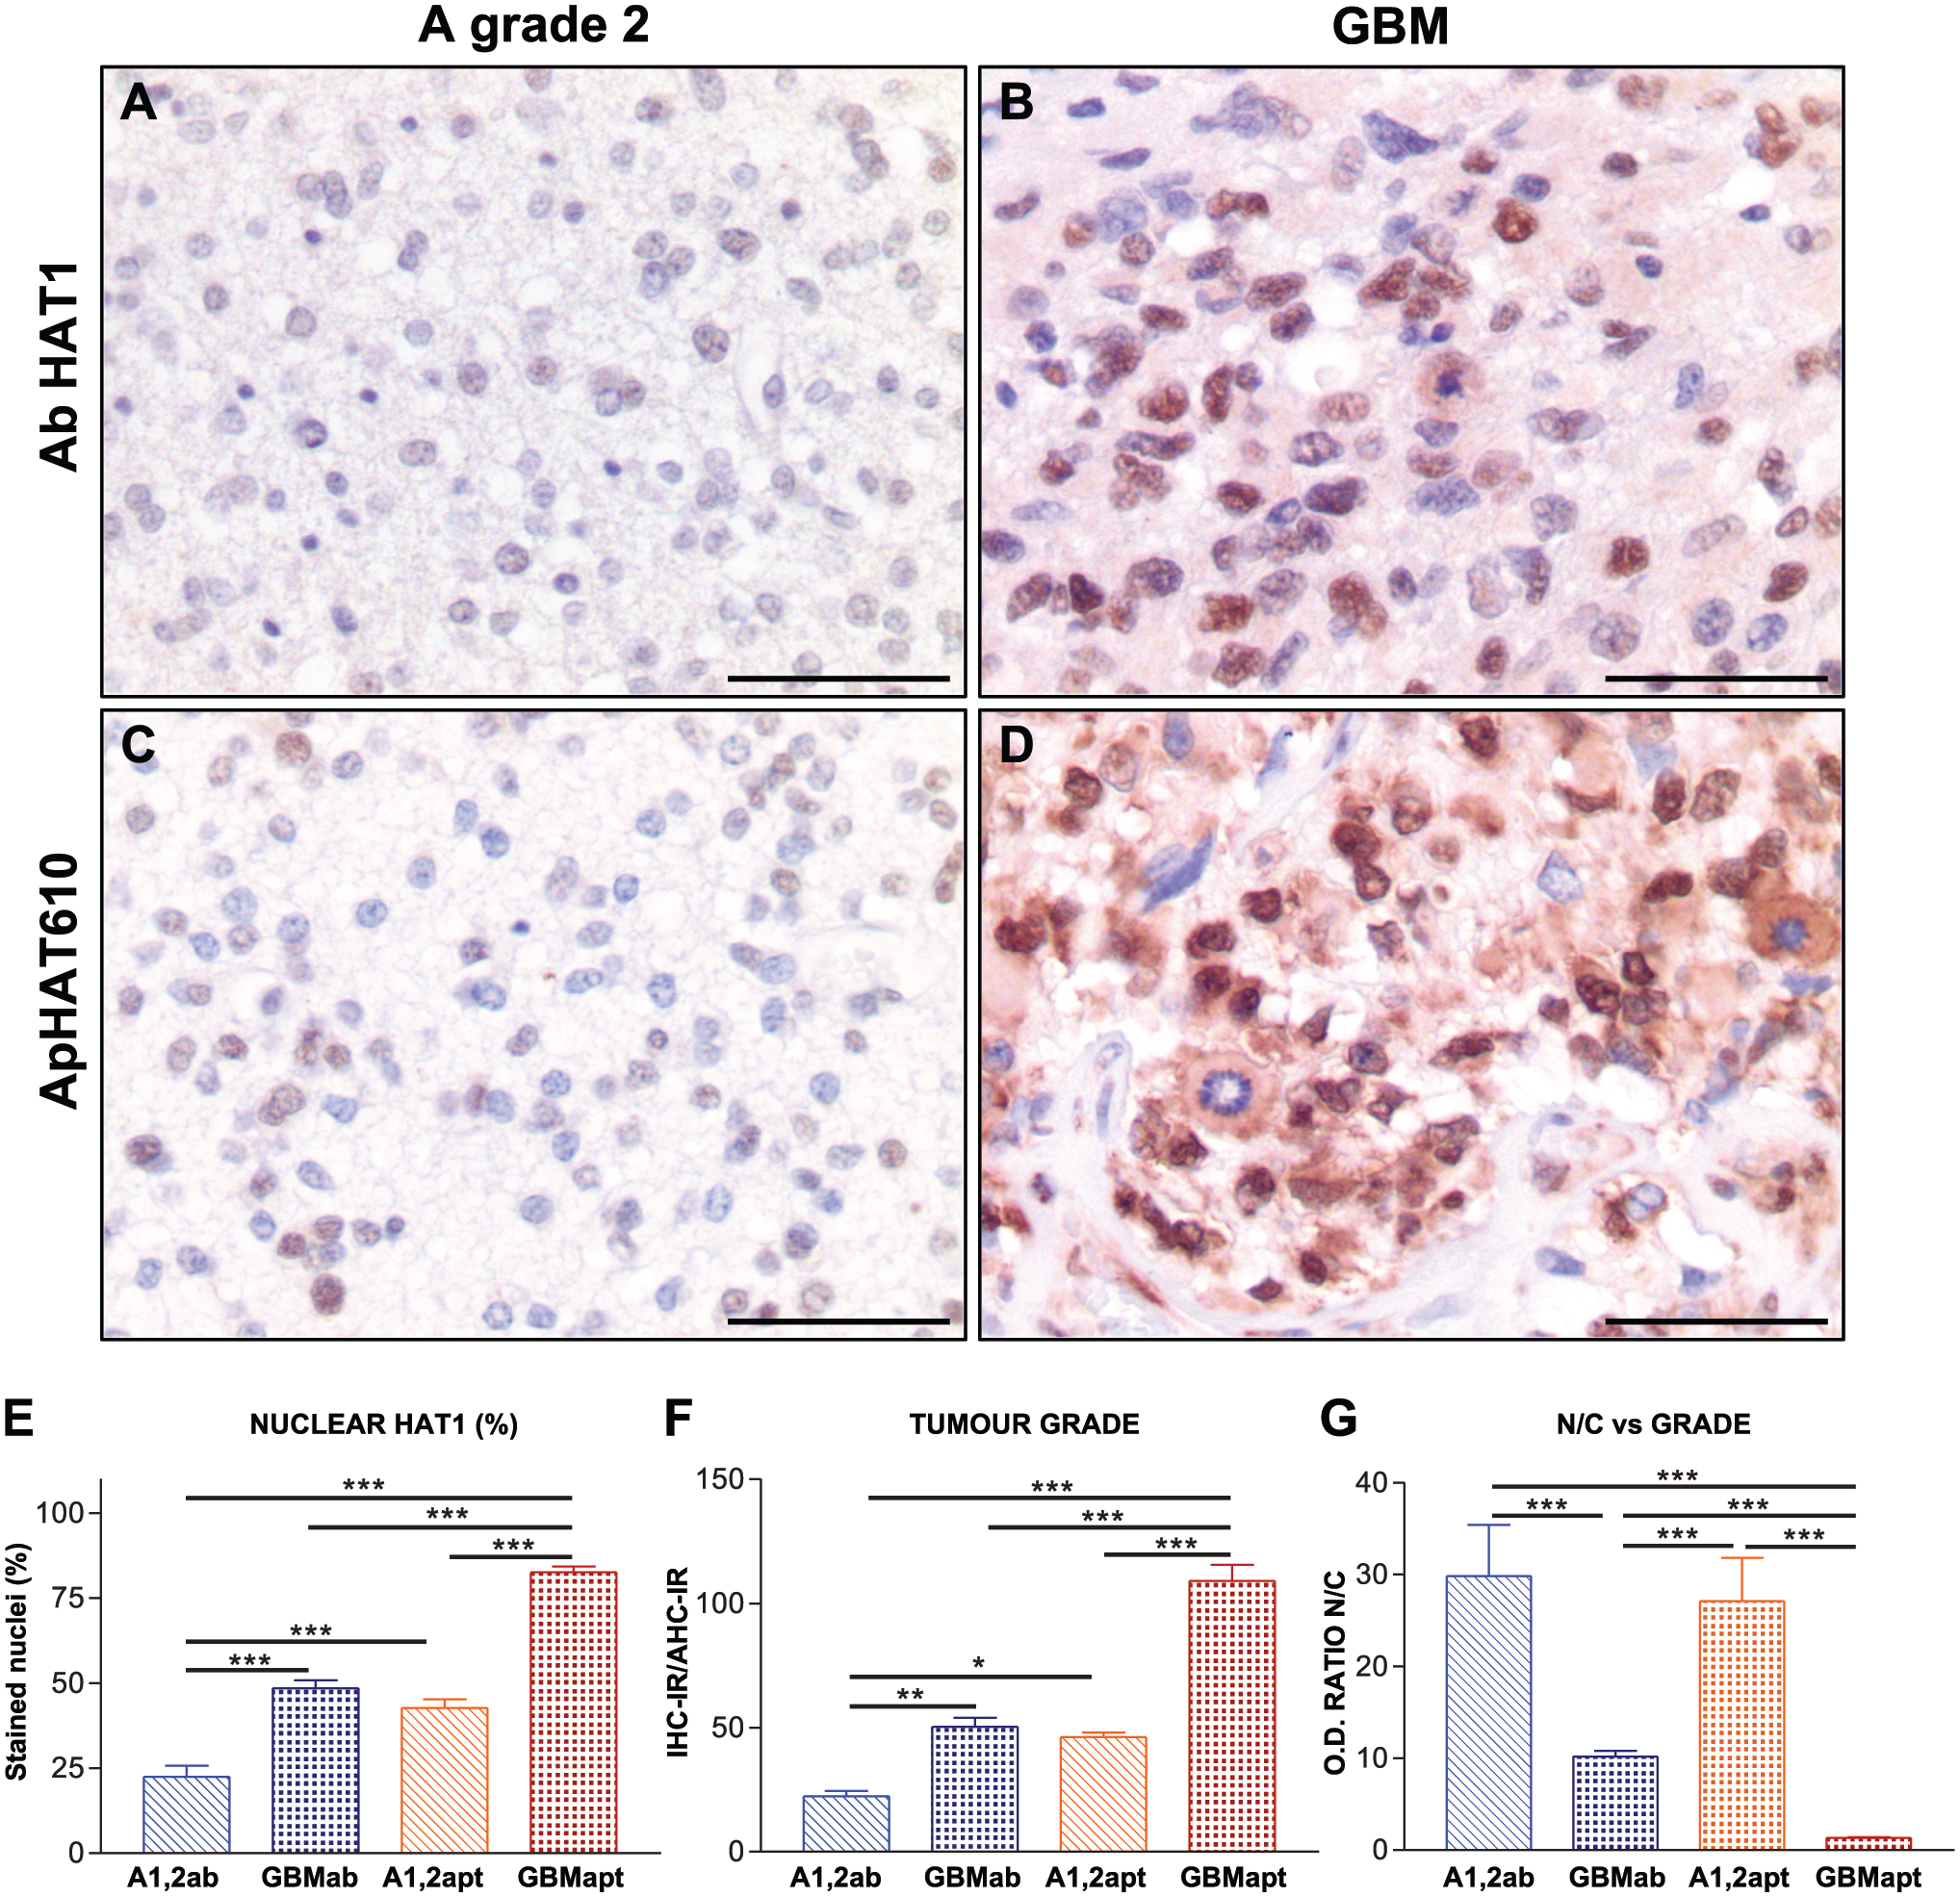
Hat1 detection in astroglial tumors. (A–D) IHC and AHC staining of astroglial tumors. (A and B) IHC. (C and D) AHC. (A and C) Grade 2 astrocytomas, weak nuclear staining when using the antibody, low signal intensity with the use of the aptamer. (B and D) GBM, intense nuclear staining with both methods. GBM also show increased levels of cytosolic HA1. All micrographs: 400×, bars: 10 µm. (E, F, and G) Mann–Whitney tests: *p<0.05; **p<0.01; ***p<0.001. Abbreviations: ab, antibody; apt, aptamer. (E) HAT1 immunopositive nuclei (%) in low-grade astrocytomas (A1 and A2) vs GBM. The labeled nuclei percentage is significantly higher with the use of the aptamer. (F) Analysis of IHC-IR and AHC-IR in A1 and A2 vs GBM. Significant increase of nuclear HAT1 in GBM, the significance is higher with the use of the aptamer. (G) Analysis of nuclear vs cytoplasmic staining intensity for HAT1 in A1 and A2 vs GBM. Abbreviations: N/C, nuclear/cytosolic ratio; OD, optical density. GBM: significantly higher HAT1 cytosolic staining intensity (lower N/C ratios), although N/C ratios in GBM are even lower with the use of the aptamer.
Comparing both methods, the nuclear signal obtained with the use of the aptamer was significantly higher than that obtained with the antibody (IHC-IR, mean = 72.68 ± 5 vs 31.95 ± 2.89, Mann–Whitney, p<0.0001). Considering the tumor grade, there was a significant increase in nuclear expression of HAT1, with both IHC and AHC, in high-grade tumors compared with low-grade cancers (Fig. 2M). Attending to the tumor type without regarding the grade, HAT1 staining was again significantly higher with the use of the aptamers (Fig. 2N). Astroglial tumors (AGs) showed the higher HAT1 labeling with both methods. With the antibody, OD and AGs staining was significantly higher than M staining. However, the difference between M and OD staining with the use of the aptamer was not significant. The Spearman test showed a significant correlation between the IHC-IR obtained with both methods in OD (r = 0.8741, p=0.0004) and AGs (r = 0.6798, p<0.0001), but the significance was lower in meningiomas (r = 0.4073, p=0.02; Fig. 2O–Q).
In summary, higher-grade tumors showed the higher nuclear signal for HAT1, more evident with the use of the aptamer that also showed a superior performance in detecting cytosolic HAT1.
Meningiomas
When analyzing the percentage of HAT1 stained cells, irrespective of IHC-IR, there was no significant differences between low-grade and high-grade tumors, or between recurrent and the non-recurrent M, neither by using the antibody nor with the aptamer. However, the nuclear signal for HAT1 was higher in high-grade (M3) (Fig. 3B and D) than in low-grade (M1 and M2) meningiomas (Fig. 3A and C). Both IHC-IR and the difference between groups obtained with the aptamer were significantly higher than those obtained with the antibody (Fig. 3E). According to disease recurrence, in tumors that did not relapse during the time lapse registered (three to four years follow-up), there was no difference between the data obtained with the antibody and those obtained with the aptamer. With the use of the aptamer, unlike when using the antibody, we detected a significant increase in HAT1 levels in recurrent M in comparison to non-recurrent tumors (Fig. 3F).
We usually detected a stronger cytosolic signal for HAT1 in the higher-grade tumors, then we analyzed the signal intensity in both compartments and calculated the nucleus/cytoplasm ratio (N/C). We observed increased signal intensity in the cytosol in these higher-grade tumors, which resulted in a decrease in the N/C ratio, changes that were significant with the use of the aptamer (Fig. 3G). We also observed the same differences on N/C ratios between recurrent and non-recurrent tumors that were significant with both antibody and aptamer, regardless of tumor grade, although the differences were greater with the aptamer (Fig. 3H). In summary, the use of the aptamer allowed us to detect an increase in the nuclear signal for HAT1 and higher cytosolic levels of this protein in tumors with a higher grade and higher risk of early recurrence.
It was not possible to analyze the relationship between HAT1 levels and patients’ survival, since the follow-up was relatively short. One patient with grade 3 meningioma died (one-year survival), and two meningioma patients died during the immediate postoperative period. The rest of the patients, regardless of meningioma grade and recurrence, were alive three years after diagnosis.
Glial Tumors
Unlike meningiomas, in high-grade gliomas (OD3 and GBM), both percentage of cells immunostained and IHC-IR were significantly higher than those in low-grade tumors, with both antibody and aptamer (Figs. 4 and 5), but differences were significantly higher with the use of the aptamer (Figs. 4E and F and 5E and F). As in meningiomas, we also observed increased cytosolic signal for HAT1 in high-grade tumors. With the use of antibody, cytosolic signals were weaker than when using the aptamer, but with a significant increase in OD3 and GBMs in comparison to lower-grade tumors (OD2 and A1 and A2; Figs. 4G and 5G). GBM, the tumor type with the worst prognosis (during the follow-up, all GBM patients died), showed higher nuclear and cytosolic expression of HAT1.
In summary, high-grade gliomas, especially GBMs, showed an increased signal for HAT1 in both nucleus and cytoplasm, most significant with the use of the aptamer, and this elevation of protein levels correlated with a worse prognosis of the disease. AHC was superior in detecting cytosolic HAT1.
Discussion
IHC is a widely used, recognized, and validated technique, but aptamers merged as a new interesting molecular tool for diagnosis on histopathology. AHC is far from replacing antibodies at the pathology lab, but some studies point out its exquisite sensitivity and specificity. Aptamers were used (usually with superior performance over the antibodies) to detect EGFR, EGFRvIII, and integrin α5β1 in GBM29–31; ERalpha, epCAM, EGFR, and HER2 in breast cancer32–34; CD30 in Hodgkin lymphoma and anaplastic large-cell lymphoma 35 ; epCAM in colorectal cancer 36 ; MAFG in non-small-cell lung cancer 37 ; aspartate β-hydroxylase in hepatocellular carcinoma 38 ; gremlin-1 in mouse liver 39 ; and PTEN in colon and endometrial cancer, 40 among others. The use of aptamers overcomes some of the traditional problems inherent to the use of antibodies, such as lot-to-lot inconsistencies, the use of animals for antibody production, or the use of expensive amplification systems. How is it possible that aptamers, which recognize a protein on its native state, are capable of binding a protein after HIER? Among different proposed mechanisms, it is possible that, after antigen retrieval at high temperatures, the target proteins resort to their near-native conformations upon equilibration to room temperature.41–43 However, the true reason behind it remains unstudied. In our hands, aptamers against HAT1 did not recognize the target without HIER, but a successful aptadetection can be achieved by using either high- or low-pH buffers. In general, AHC is more sensitive than antibody under the conditions used for our study. Unlike antibody, nonspecific background labeling is virtually non-existent even at the highest concentrations, which facilitates signal analysis. In addition, this technique is simpler than IHC, since no amplification bridges are required for development: We used just an anti-digoxigenin secondary antibody, labeled with peroxidase, shortening the process timeline. No expensive amplification systems are required, reducing the cost of the procedure. Moreover, if the incubation with the aptamer is limited to 2 hrs, we also obtain excellent results.
We observed that HAT1 expression increased in tumors of higher grade and with the worst prognosis. Previous meta-analyses from different tumor types, including GBM and low-grade gliomas, suggest that HAT1 could be considered a novel therapeutic target.15,16 Besides the increase of nuclear HAT1, we detected stronger staining for cytosolic HAT1 in the most aggressive tumors. It is unclear why the antibody does not stain cytosolic HAT1 as efficiently as the apHAT610. HAT1a has been described as localized at the nucleus and the mitochondria, whereas HAT1b has been described in both nucleus and cytoplasm.9,44 However, references to the “b” isoform are extremely scarce, and it is not known whether it may have functions different from those of HAT1a. We detected cytosolic signals with the use of the antibody, but the staining was stronger with the use of the aptamer. According to the antibody supplier, the protein used as immunogen to obtain this antibody was almost complete (aa.36-419), so it is expected to recognize both “a” isoform and probably the shorter “b” isoform (whose sequence is completely contained on the “a” variant). It is possible that the antibody was not efficient for HAT1b on paraffin-embedded samples, where the availability of the epitope can be masked or damaged by fixation, insufficient antigenic recovery, or prolonged storage of the sections. Another hypothesis could be that the antibody recognizes mainly the nuclear predominant “a” variant, which may occur, even if it is polyclonal antibody generated using the complete sequence of the protein. It is very likely, however, that the aptamer allows recognition of both forms of HAT1. ApHAT610 was selected using the “b” isoform, whose sequence is fully shared with the “a” variant. We cannot affirm that the increased cytosolic signal observed in tumors with a worse prognosis is due to the expression of the “b” isoform, a fact that requires future research. However, recent work shows that HAT1 is one of the proteins whose alternative splicing significantly increase in GBM, influencing patient survival. 45 The increase in the cytoplasmic signal might be of prognostic value, so the aptamer could be valuable as a new tool for diagnostic purposes.
In the nuclei of tumor cells, we observed a similar distribution of the protein with the antibody and the aptamer. With the aptamer, the signal appears enhanced in discrete areas of the nucleus, with a dotted pattern. There are nuclear compartments related with the regulation of post-transcriptional RNA processing, such as speckles, sites enriched in splicing factors. Recently, numerous non-histone substrates of HAT1 have been described, including a large group of splicing factors, such as SFPQ, SF3B1, A2AF2, or PRPF8 proteins, among others. 10 Therefore, the localization of HAT1 in these “speckles” or “dots” scattered throughout the cell nucleus could be related with a possible function in RNA regulatory processes. We also observed a localization pattern in specific spots in the cytoplasm, more evident with the aptamer. In addition, we have frequently observed HAT1 staining of one or two discrete points close to the cell nuclei, mainly visible with the use of the aptamer, and not previously described either. New substrates of HAT1 are centrosome proteins and others related with vesicular trafficking of the Golgi complex, among others. 10 It would be of great interest to analyze the co-localization of HAT1 with splicing factors, mitochondrial, centrosome, and Golgi complex markers.
One of the events that determine the progression of astrocytomas and characterize GBMs is the presence of necrosis. Regions of relative ischemia, mainly at perinecrotic areas, serve as a reservoir for the more aggressive tumor cells resistant to lower levels of nutrients and oxygen, and cancer-initiating cells in glial tumors can survive in these areas. 46 The factors that allow cells to survive this relative hypoxia are not well understood, but HAT1 has recently been found to interact with HIF2A (hypoxia-inducible factor) by acetylating it and increasing its stability, thereby inducing increased proliferation and migration. 47 HIF2A is also a potent inducer of VEGFA production, described as particularly abundant in perinecrotic regions in GBM. 48 Therefore, HAT1 might play a role as an ischemia survival factor. Moreover, a recent meta-analysis identified a possible new therapeutic and prognostic axis in GBM involving HAT1 and HIF1A (HAT1-Ube2S[K211]-GNB2L1-HIF1A), and HAT1 was appointed as one of the most important potential predictive biomarkers, suggesting that it plays a critical role in GBM pathogenesis. 49
In summary, HAT1 is overexpressed in primary meningiomas and gliomas, and its expression levels correlate with the higher grades and the poorest prognosis. Besides, the increase in cytosolic HAT1 as a prognostic marker should be further studied. ApHAT610 is useful for immunodetection by AHC, where it offers better results than the antibody anti-HAT1 we used. With both methods, we observed significant increased levels of HAT1 at brain tumors with the worst prognosis, pointing new evidence for HAT1 as a potential marker and a possible therapeutic target for primary brain cancers.
Footnotes
Acknowledgements
Our greatest thanks to the Pathology Department of Ramón y Cajal Hospital for providing the samples used for this study and to the Aptamer Research Group (IRYCIS) for their support.
Competing Interests
The author(s) declared no potential conflicts of interest with respect to the research, authorship, and/or publication of this article.
Author Contributions
All authors have contributed to this article as follows: conception and design (MDVTL, MAON, MM, JGC); method optimization, investigation, visualization (SB-C, MM, MG-O, PG, SS, MR, IG-T); collection and/or assembly of data (SB-C, MDVTL, MM, MEM); data analysis (AE-L, SB-C, MDVTL, MM); data interpretation (SB-C, MM, MDVTL, PG, MG-O); article writing (MDVTL, SB-C, MAON); technical support, resources, and manuscript review (MEM, VMMG, JIK-M).
Funding
The author(s) disclosed receipt of the following financial support for the research, authorship, and/or publication of this article: Granado, P and Esteban-Lasso, A received financial support from Inari-Biotech-Programa Investigo (Comunidad de Madrid), Plan de Recuperación, Transformación y Resiliencia, financed by the European Union (NextGenerationEU).
Data Availability Statement
The data that support the findings of our study are available from the corresponding author upon reasonable request.
Ethics Statement
The material used in this study was provided by the Department of Pathology (Hospital Ramón y Cajal) in the frame of a Research Project (FMM06/180) from Fundación Mutua Madrileña (Madrid, Spain) starting in 2007, previous the entry to effect the law 14/2007, of July 3, 2007, on Biomedical Research, being exempt from the approval by the ethics committee. The ethics committee determined that samples we used were fully anonymized, the study does not imply risk nor additional procedures for patients, and it is not possible to obtain the patient’s informed consent for the present study, since samples were stored for more than 18 years.