
Abstract
Induction of severe inflammatory arthritis in the collagen antibody-induced arthritis (CAIA) murine model causes extensive joint damage and pain-like behavior compromising analysis. While mild models are less severe, their reduced, variable penetrance makes assessment of treatment efficacy difficult. This study aimed to compare macroscopic and microscopic changes in the paws, along with central nervous system activation between a mild and moderate CAIA model. Balb/c mice (n=18) were allocated to control, mild, and moderate CAIA groups. Paw inflammation, bone volume (BV), and paw volume (PV) were assessed. Histologically, the front paws were assessed for joint inflammation, cartilage damage, and pre/osteoclast-like cells and the lumbar spinal cord and the periaqueductal gray (PAG) region of the brain for glial reactivity. A moderate CAIA dose induced (1) significantly greater local paw inflammation, inflammatory cell infiltration, and PV; (2) significantly more osteoclast-like cells on the bone surface and within the surrounding soft tissue; and (3) significantly greater glial reactivity within the PAG compared with the mild CAIA model. These findings support the use of a moderate CAIA model (higher dose of monoclonal antibodies with low-dose lipopolysaccharide) to induce more consistent histopathological features, without excessive joint destruction.
Introduction
Rheumatoid arthritis (RA) is a chronic inflammatory disease resulting in inflammation, joint destruction, and pain in patients. Joint inflammation is associated with synovial hyperplasia and the destruction of cartilage and bone, and is driven by the infiltration of immune cells into the synovial joints, and production of pro-inflammatory cytokines locally. 1 Joint pain is often identified by RA patients as a major symptom affecting quality of life. Of note, this pain can often persist despite optimal control of inflammation and disease progression.1–3 RA associated pain is complex and arises from multiple mechanisms involving inflammation, structural changes within the joint and peripheral and central pain processing, and is often associated with neuropathic pain.1,4 Thus, preclinical animal models of RA have the potential to provide further insight into pathophysiology that not only initiates and potentiates joint destruction, but sustains pain in RA. However, there are currently limited studies which investigate joint destruction and central nervous system (CNS) activation concurrently in preclinical models of inflammatory arthritis.
The collagen antibody-induced arthritis (CAIA) murine model is a systemically induced, passive immunization model beneficial for understanding RA disease progression and identifying potential therapeutic targets. An advantage of the CAIA model is that the timing of disease onset can be controlled; however, there is large variability across previous publications in the severity of disease induced, resulting in variability in pathogenic features.1–5 CAIA is induced using a commercially available cocktail of monoclonal antibodies targeted to type II collagen in combination with the bacteria toxin Escherichia coli lipopolysaccharide (LPS).5–7 The addition of LPS reduces the amount of monoclonal antibody required for induction of disease as there is a strong synergistic effect.8,9 LPS can also be varied to increase the incidence and severity of disease onset.5,7 Previous studies have induced the CAIA model with various doses of monoclonal antibodies (1–4 mg/mouse) and LPS (5–50 µg/mouse), while extending the model across various timelines (10–21 days).5,8,10–12 Addition of a higher dose of LPS produces a florid arthritic reaction resulting in severe cartilage and bone destruction in the paws of mice. 11 However, this causes extensive destruction of joint architecture making histological assessment difficult, increasing the need for earlier euthanasia and impeding investigation of comorbidities.13–15 We have previously elicited a mild arthritic response by treatment with 1.5 mg monoclonal antibodies and 10 µg LPS,8,9 to enable investigation of increased severity in the presence of comorbidities such as periodontitis. 12 However, in the mice with CAIA alone, changes in inflammation and bone volume (BV) were not consistent, which could be attributed to the arthritic response being too mild. 8
The CAIA mouse model has clinical and histological features similar to the characteristics of human RA, including inflammatory synovitis, pannus formation, pain-like behavior, and joint destruction.5,11 However, given the variation in doses as previously discussed, a direct comparison between the moderate and mild CAIA model is required to determine the most appropriate model to investigate therapeutic efficacy without being ethically compromised. Moreover, while the CAIA arthritic response has been investigated in the front paws using micro-computer tomography (micro-CT),8,9,12,16 assessment of the hind paws has not been published. Thus, assessing both front and hind paws will enable a complete characterisation of inflammation and bone destruction in the CAIA model.
While traditionally local bone and joint destruction has been assessed in inflammatory arthritis models, more recent studies have highlighted the critical connection between chronic peripheral inflammation and the activation of glial cells within the CNS. 1 Previous studies identified an increased permeability within the blood brain barrier (BBB) of mice with collagen-induced arthritis (CIA), 17 supporting the posit that chronic peripheral inflammation observed in RA animal models may promote neuroimmune modulation resulting in increased glial reactivity within the spinal cord. 10 In support of this, Su et al. 18 observed a significant increase in ion channels associated with inflammatory and nerve injury–induced pain states in the dorsal root ganglion neurons within a male mild model of CAIA, using an antibody dose of 1.5 mg/mouse in combination with an LPS dose of 30 µg/mouse; however, supraspinal regions were not examined. Increased glial fibrillary acidic protein (GFAP) was identified in the lumbar spinal cord of male mice in post-inflammatory pain states, suggesting that mice had clinical assessments which returned to baseline, following induction of CAIA (1.5 mg/mouse monoclonal antibody and 25 µg/mouse LPS). 10 Balkrishna et al. 19 also used a mild CAIA model (1.5 mg/mouse monoclonal antibody and 50 µg/mouse LPS) and observed an increase in synovial membrane pannus formation and thermal hyperalgesia assessed via hot plate test in the hind paws suggesting glial modulation; however, this was not directly measured.
Studies within our laboratory have recently identified increased glial reactivity within the periaqueductal gray (PAG) and rostral ventral medulla (RVM) in a female mild model of CAIA (1.5 mg/mouse monoclonal antibody and 10 µg/mouse LPS), 20 demonstrating that systemic induction of inflammatory arthritis can activate glial cells in supraspinal regions, as well as the spinal cord in a mild CAIA mouse model. However, whether a more intense response can be induced by a more moderate CAIA model (3.0 mg/mouse monoclonal antibody and 10 µg/mouse LPS) has not been examined.
To our knowledge, there are currently no published studies directly comparing mild and moderate CAIA models regarding clinical paw swelling, histological joint destruction, BV, and the effect on glial cells within the brain and spinal cord of female mice. Therefore, this study aimed to identify whether a higher dose (3.0 mg/mouse) of monoclonal antibodies in combination with a low-dose (10 µg) LPS will produce a consistent arthritic response in all paws and induce inflammatory changes within the CNS over 10 days, when compared with a mild model (1.5 mg/mouse monoclonal antibody in combination with 10 µg/mouse LPS).
Method
This study was approved by the University of Adelaide Animal Ethics Committee (M-2015-255B) and complied with the National Health and Medical Research Council (Australia) Code of Practice for Animal Care in Research and Training (2014). Mice were housed in approved conditions on a 12-hr light–dark cycle. Food and water were provided ad libitum and mice were provided with water-proof soft rubber matting as bedding before disease induction.
CAIA
Eighteen female Balb/c mice aged 6 to 8 weeks were obtained from the University of Adelaide Laboratory Animal Services and allocated to control (no arthritis; n=5), mild CAIA (1.5 mg monoclonal antibodies, 10 µg LPS; n=5), and moderate CAIA (3.0 mg monoclonal antibodies, 10 µg LPS; n=8) groups.
On day 0, mice were injected intravenously with a cocktail of antitype II collagen monoclonal antibodies (Arthrogen-CIAs Arthritogenic Monoclonal Antibodies, Chondrex Inc., Redwood, WA). The mild CAIA group received one intravenous injection of 150 µl (1.5 mg/mouse) monoclonal antibodies,8,9,12,16 while the moderate CAIA group received two intravenous injections of 150 µl monoclonal antibodies (3.0 mg/mouse) approximately 30 min apart. On day 3, both groups received an intraperitoneal injection of 20 µl (10 µg/mouse) LPS. Control animals were injected with phosphate-buffered saline, at both time points.
Clinical Paw Swelling
Mice were monitored daily, and clinical paw swelling was examined by two blinded observers for the presence of redness, tenderness, swelling, and inflammation in all paws, using a published paw scoring method.5,8 For each paw, a score of 1 was given for an inflamed digit and a score from 0 to 5 was allocated for swelling of the carpal/tarsal and swelling of the wrist/ankle. The maximum score for each paw was 15, giving a possible total of 60 per mouse.5,8
Micro-computed Tomography Analysis
On day 11, transcardial perfusions were performed under anesthetic (175 mg/kg Sodium Pentobarbital) using 4% paraformaldehyde. Paws were collected and post-fixed for 24 hr.
To measure bone changes and paw swelling, all paws were scanned using micro-CT (SkyScan 1076, Bruker, Kontich, Belgium), using scan settings of X-ray source voltage 55 kV, current 180 µA, isotropic pixel size 8.5 µm, 0.5 mm thick aluminum filter, 0.6 rotation step, frame averaging of 1, and total scan time of 35 min. Cross-sectional images of all paws were reconstructed (N-Recon Software, Bruker) and aligned along the inferior-superior direction of the images (Dataviewer Software, Bruker).8,16
A cylindrical volume of interest (VOI; 4.5 mm diameter, 2.4 mm length) was used for front paws and included 280 contiguous cross-sections, starting 200 cross-sections distally to the growth plate of the radiocarpal joint and extending to 80 cross-sections proximally. 8 In the hind paws, 600 cross-sections (5.1 mm length), extending from the posterior surface of the calcaneus through the proximal tarsal and metatarsal bones was used for BV analysis, along with a polygonal VOI to trace around the calcaneus, tarsal and metatarsal bones, excluding the tibia and fibula. Paw volume (PV) analysis in the hind paws used a cylindrical VOI (5.5 mm diameter, 1.7 mm length), with 200 cross-sections, extending from the most posterior aspect of the metatarsal bones, excluding the calcaneus and including the cuboid. For these VOIs, BV (mm3) and PV (mm3) were quantified in 3D using uniform thresholding (CT Analyzer software, V1.15.40, Bruker).8,16
Histological Analysis of the Radiocarpal Joint
Front paws were decalcified using 10% EDTA for 12 weeks, processed into paraffin, and sagittal sections of the radiocarpal joint were cut (5 µm) for routine haematoxylin and eosin (H&E) and tartrate-resistant acid phosphatase (TRAP) staining. Histological evaluation of H&E sections for the presence of inflammatory cells, cartilage and bone degradation, and pannus formation was carried out by two blinded observers, using a previously published semi-quantitative scoring method.8,12 Scoring was based on the number of inflammatory cells within the radiocarpal joint; normal tissue (<5% inflammatory cells) was scored as 0, mild inflammation (6–20% inflammatory cells) was scored as 2 and severe inflammation (>51% inflammatory cells) was scored as 3. Bone and cartilage destruction were assessed on a 4-point scale (0, normal; 1, mild cartilage destruction; 2, evidence of both cartilage and bone destruction; 3, severe cartilage and bone destruction). Pannus formation was scored as either 0, no pannus or 1, pannus formation.8,12 The number of multinucleated TRAP positive cells (>3 nuclei) were counted by two blinded observers in a consistent region of interest (2.16 mm2), which included cells found on the bone surface 21 and within the surrounding soft tissue of the radiocarpal joint. 8
Histological Analysis of Spinal Cord and Brain Tissue
Immunohistochemical detection of GFAP and ionized calcium binding adaptor molecule (IBA)-1 was performed on serial coronal sections (5 µm) of the lumbar spinal cord (L3-L5) and the PAG of the brain, as this region has been demonstrated to be altered due to nociceptive and inflammatory pain.20,22,23 GFAP-positive cells were counted in the lumbar spinal cord (0.38 mm2) and PAG (2.72 mm2) using the software Fiji and color deconvolution method, 24 with a threshold of 167 ± 5 pixels2. IBA1 positive cells were counted within the lumbar spinal cord (0.38 mm2 region of interest) and PAG (2.72 mm2) by a blinded observer.
Statistical Analysis
Statistical analysis used GraphPad Prism® software (V7.03; GraphPad Software, La Jolla, CA). To account for the limited sample size, non-parametric statistics were used for comparisons among groups. For paw inflammation, micro-CT and paw and brain histology data, differences among groups were first analyzed using the non-parametric Kruskal–Wallis test and if significant, differences between two groups were each analyzed using the Mann–Whitney U test. Area under the curve (AUC) analysis was conducted on lumbar spinal cord cell counts. Statistical significance was assessed post hoc using t tests between groups. All values shown are mean ± standard error of the mean (SEM) and the significance level was set to p<0.05.
Results
Assessment of Local Inflammation in Mouse Paws Following CAIA Induction
Induction of both mild and moderate CAIA resulted in significant redness and inflammation in all paws from days 3 to 10, compared with control mice (p<0.0001; Fig. 1A and B). Moderate CAIA mice had significantly greater paw scores compared with mild CAIA mice on days 4 (p=0.018) and 6 (p=0.041; Fig. 1B). Average paw scores remained higher from days 7 to 10 compared with mild CAIA mice; however, this was not significant (Fig. 1B).
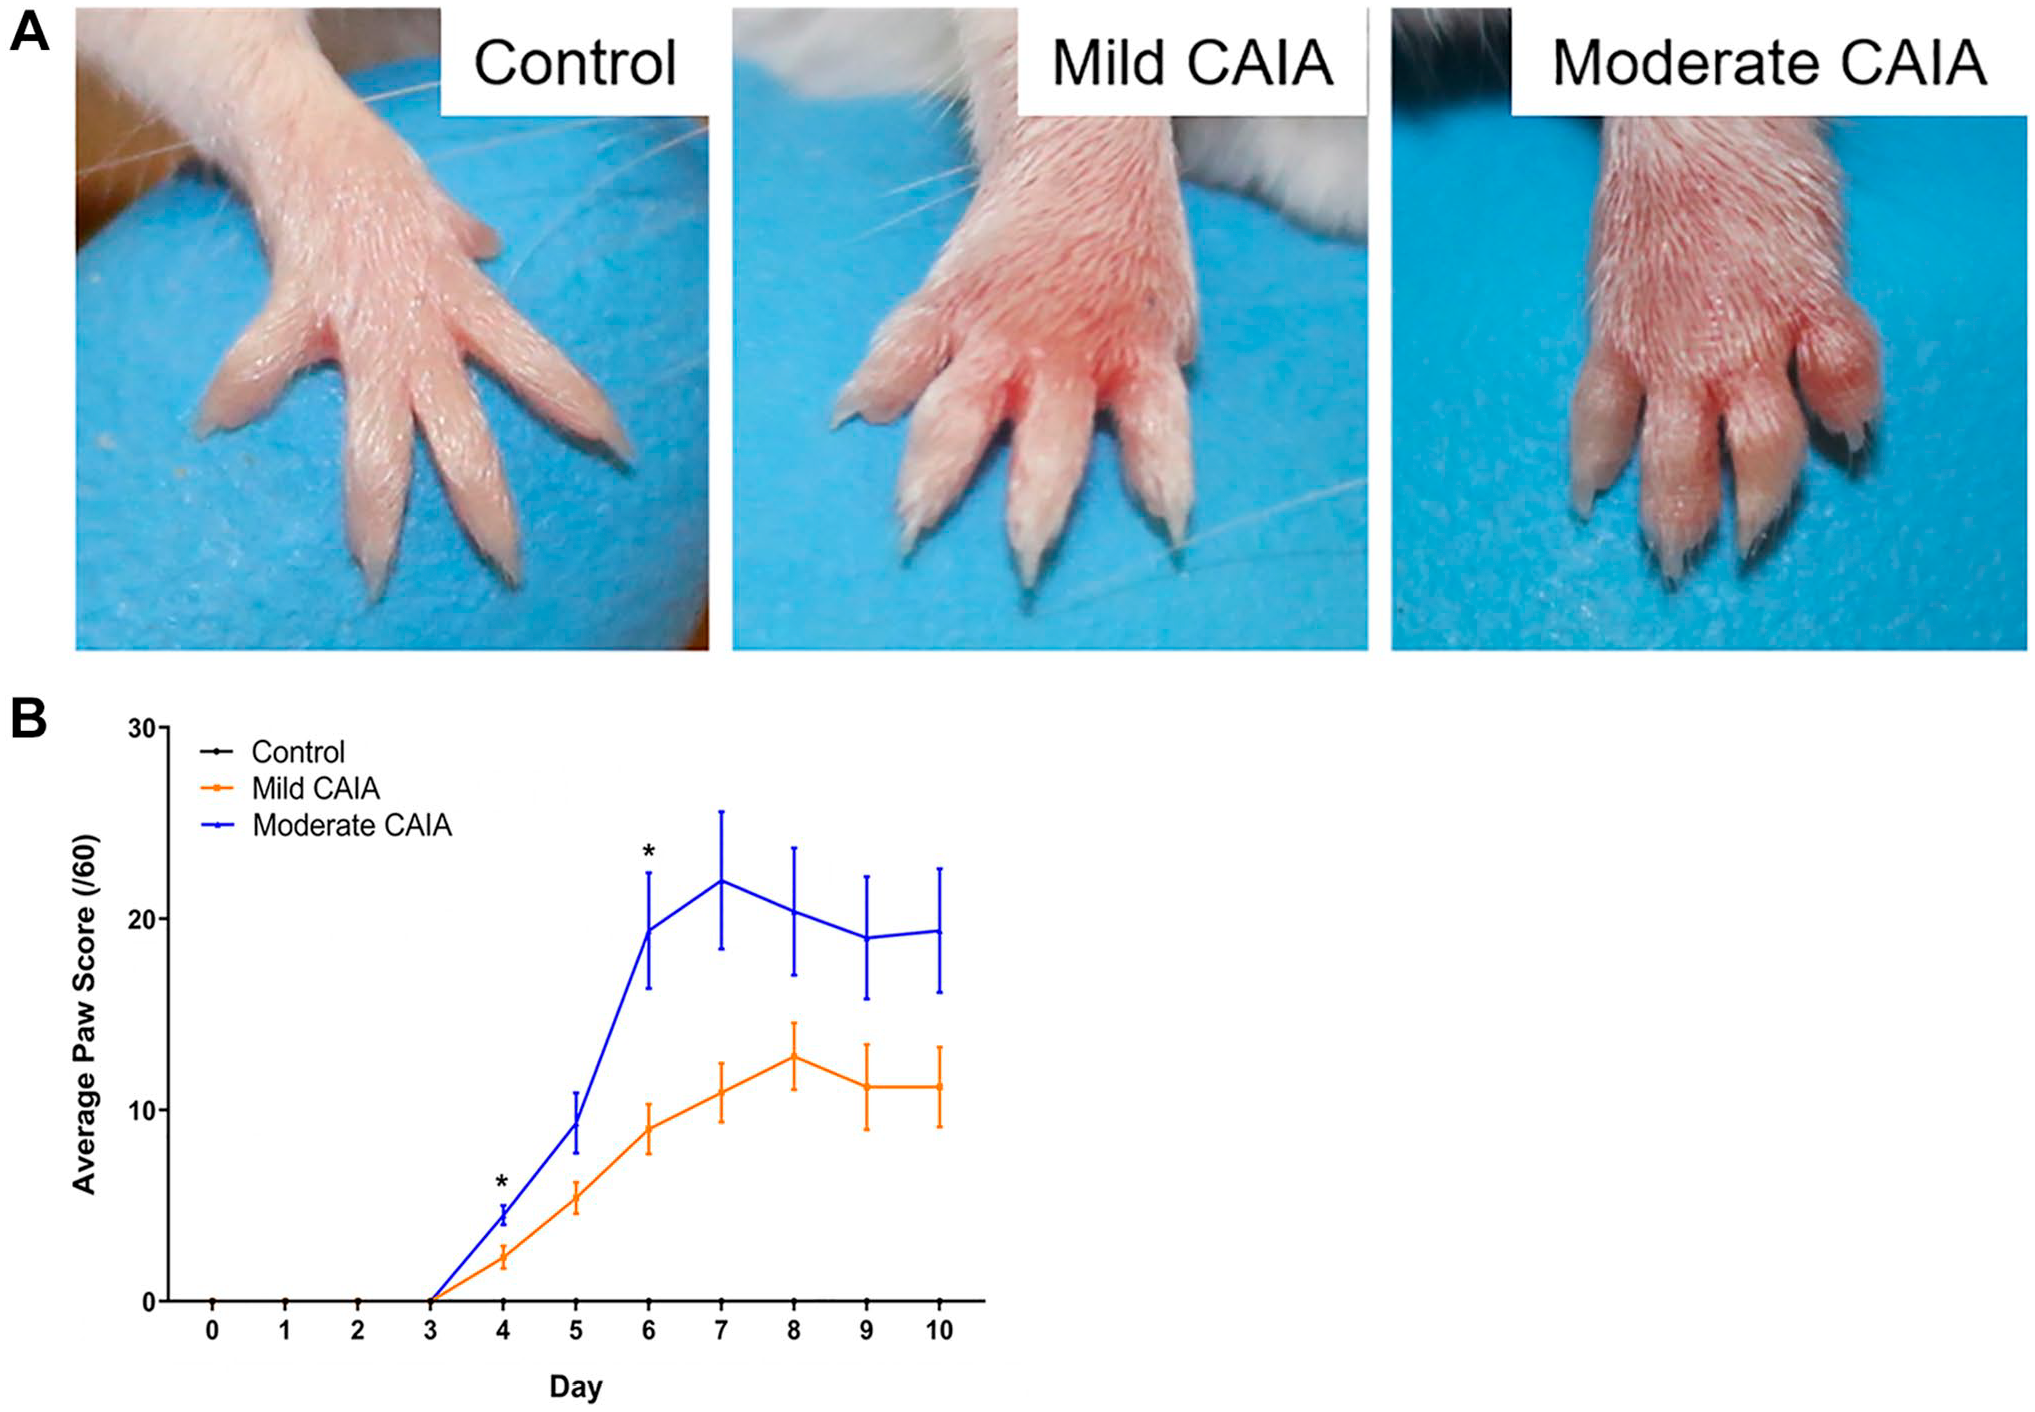
Evaluation of local inflammation in front and hind paws. (A) Representative macroscopic appearance of representative front paws at day 7 post-arthritis induction. (B) Daily average paw scores of each group throughout the 10-day model. Control mice had paw score 0 at each time point. Error bars represent SEM (n=5 mice per control and mild CAIA groups, n=8 mice per moderate CAIA group; ****p<0.0001 vs. control, *p<0.05 mild CAIA vs. moderate CAIA). Abbreviations: CAIA, collagen antibody-induced arthritis; SEM, standard error of the mean.
Micro-CT Analysis of BV and PV in Front and Hind Paws Following CAIA Induction
Moderate CAIA mice showed significantly lower BV compared with control mice in the radiocarpal joint (0.92 ± 0.03 mm3 and 1.05 ± 0.03 mm3, respectively; p=0.0116; Fig. 2A and B) and in the hind paw (3.05 ± 0.08 mm3 and 3.4 ± 0.05 mm3, respectively; p<0.003; Fig. 2C), whereas mild CAIA mice exhibited significantly lower BV compared with control mice in the hind paw only (3.07 ± 0.13 mm3; p=0.027). There was no significant difference in BV between mild and moderate CAIA groups in either front or hind paws. Of note, bone resorption pits were clearly visible on the surface of the navicular and cuboid bones in both CAIA groups (Fig. 3A–D, respectively).
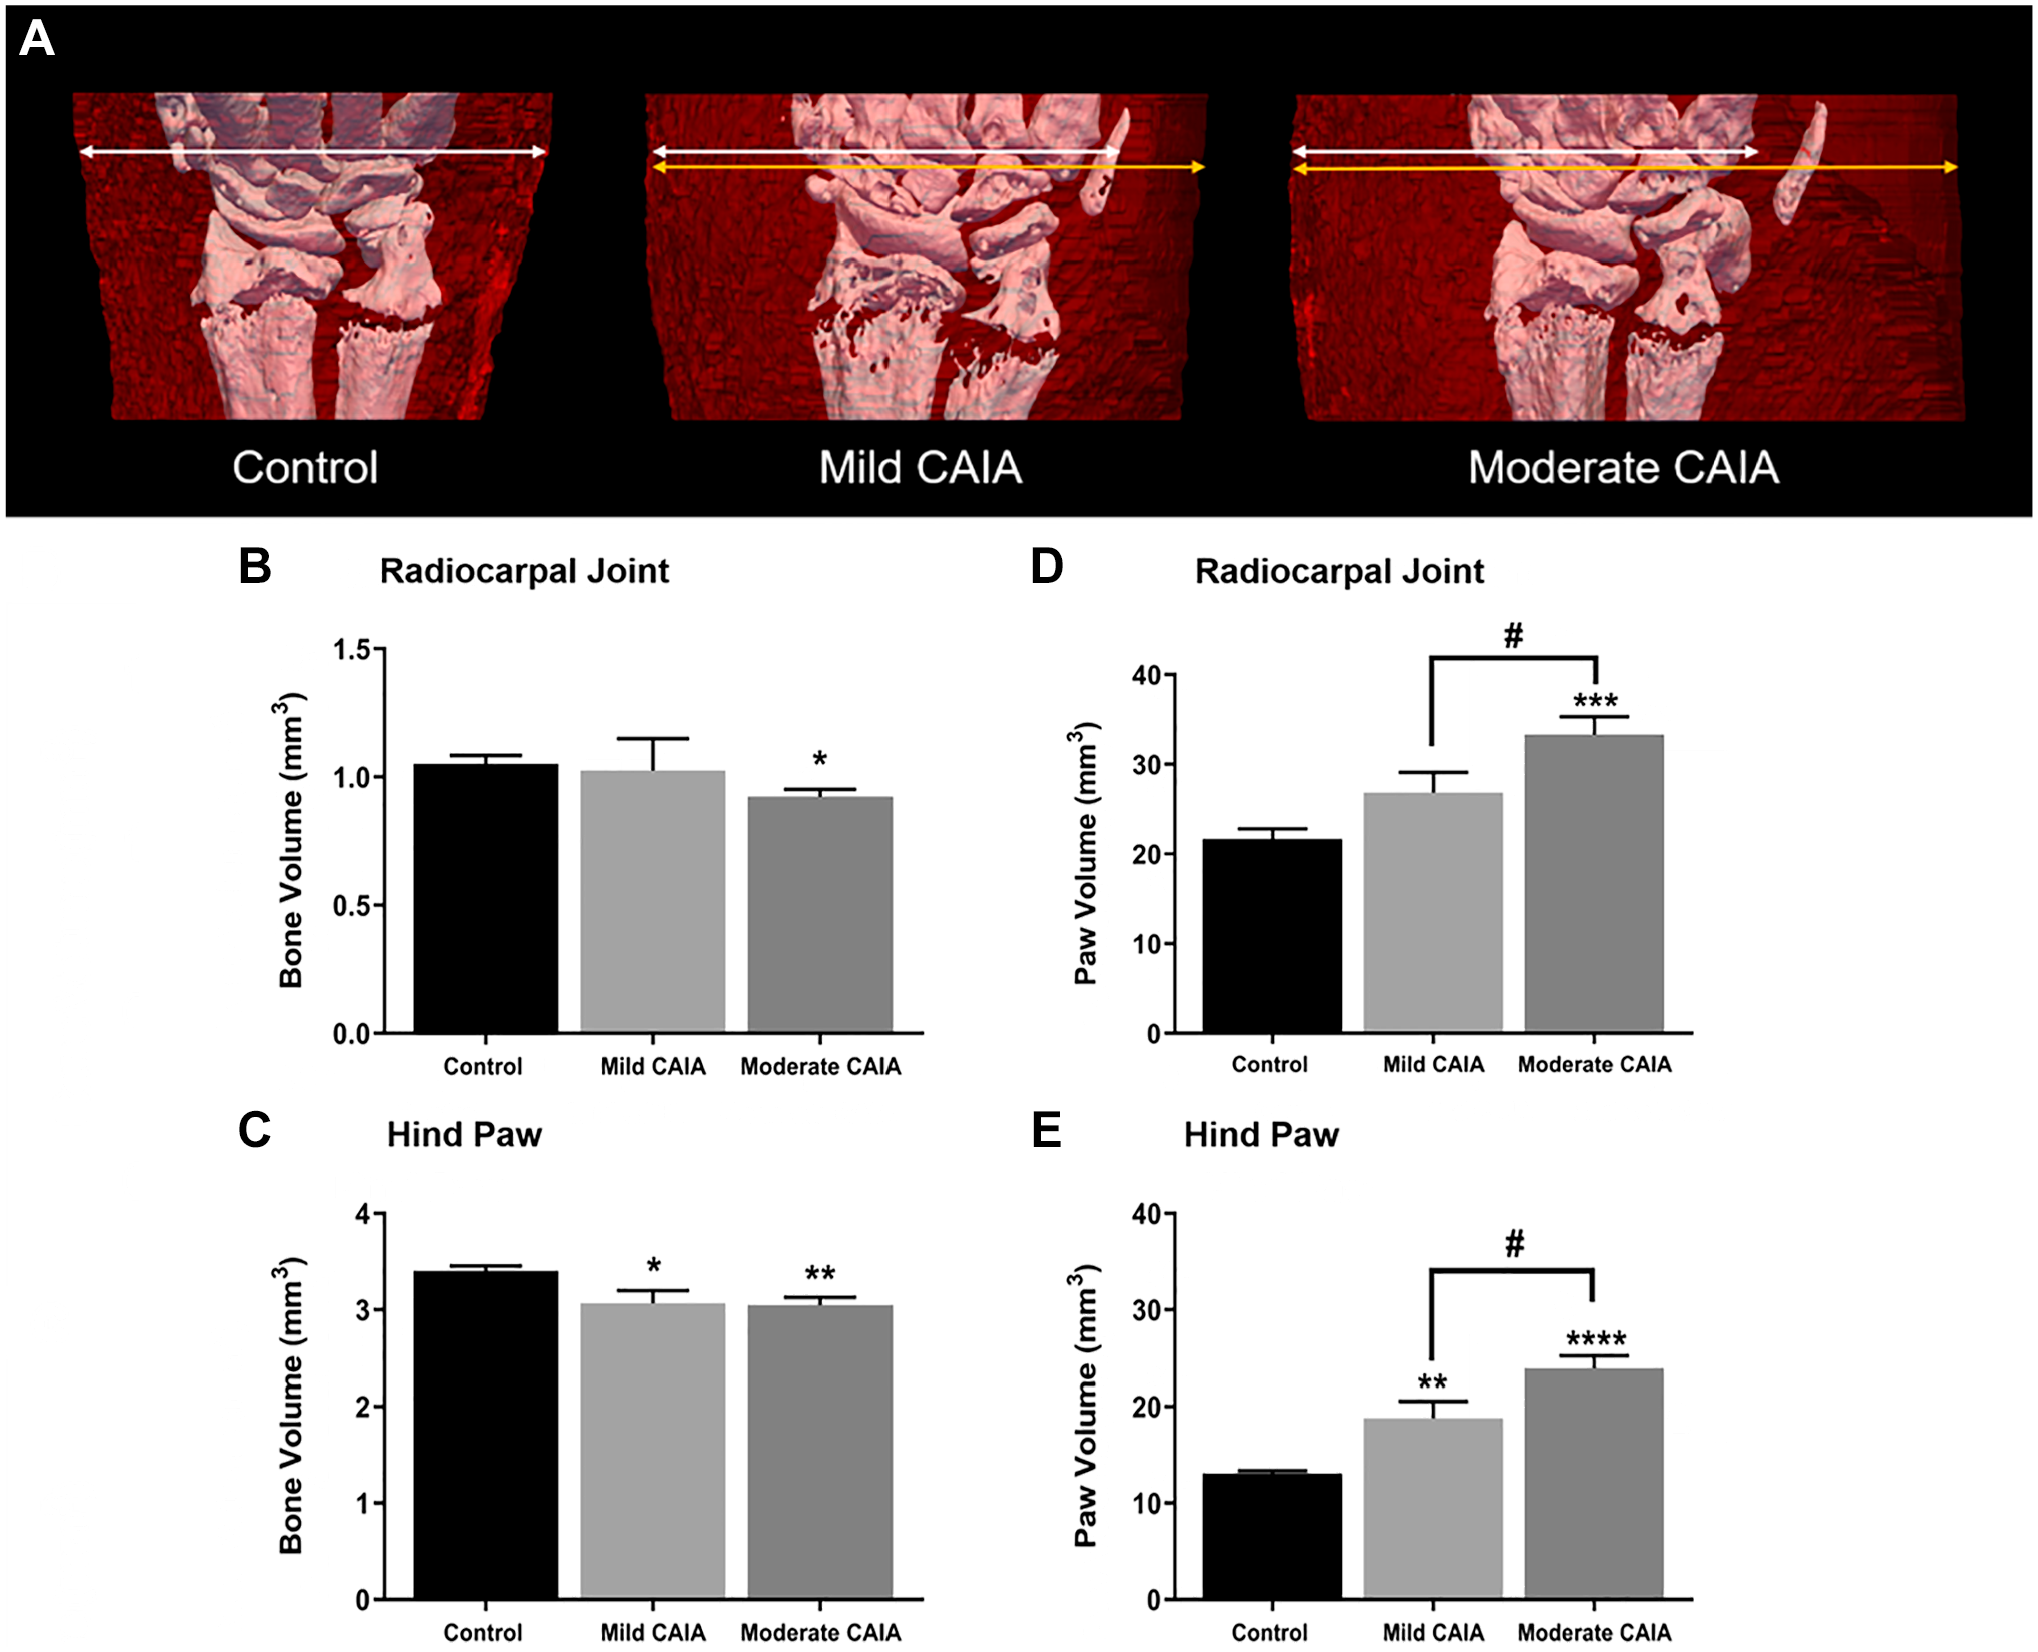
Bone volume and paw volume of the front and hind paws assessed by high-resolution micro-CT. (A) Representative 3D micro-CT models of the right radiocarpal joint (white) and surrounding soft tissue (red). Arrows represent the width of the soft tissue, white arrows for control mice, compared with yellow arrows for disease groups. Mean BV and PV in the radiocarpal joint (B and D, respectively) and hind paws (C and E, respectively) expressed in mm3. Error bars represent SEM, n=10 paws (left and right paws taken together) per control and mild CAIA groups, n=16 (left and right paws taken together) per moderate CAIA group, one front paw was removed from the control group due to movement artifacts (****p<0.0001 vs. control, #p<0.01 vs. mild CAIA). Scale bar represents 1 mm and refers to (B) and (D). Abbreviations: BV, bone volume; CAIA, collagen antibody-induced arthritis; CT, computer tomography; PV, paw volume; SEM, standard error of the mean. *p<0.01, **p<0.003, ***p<0.0003.
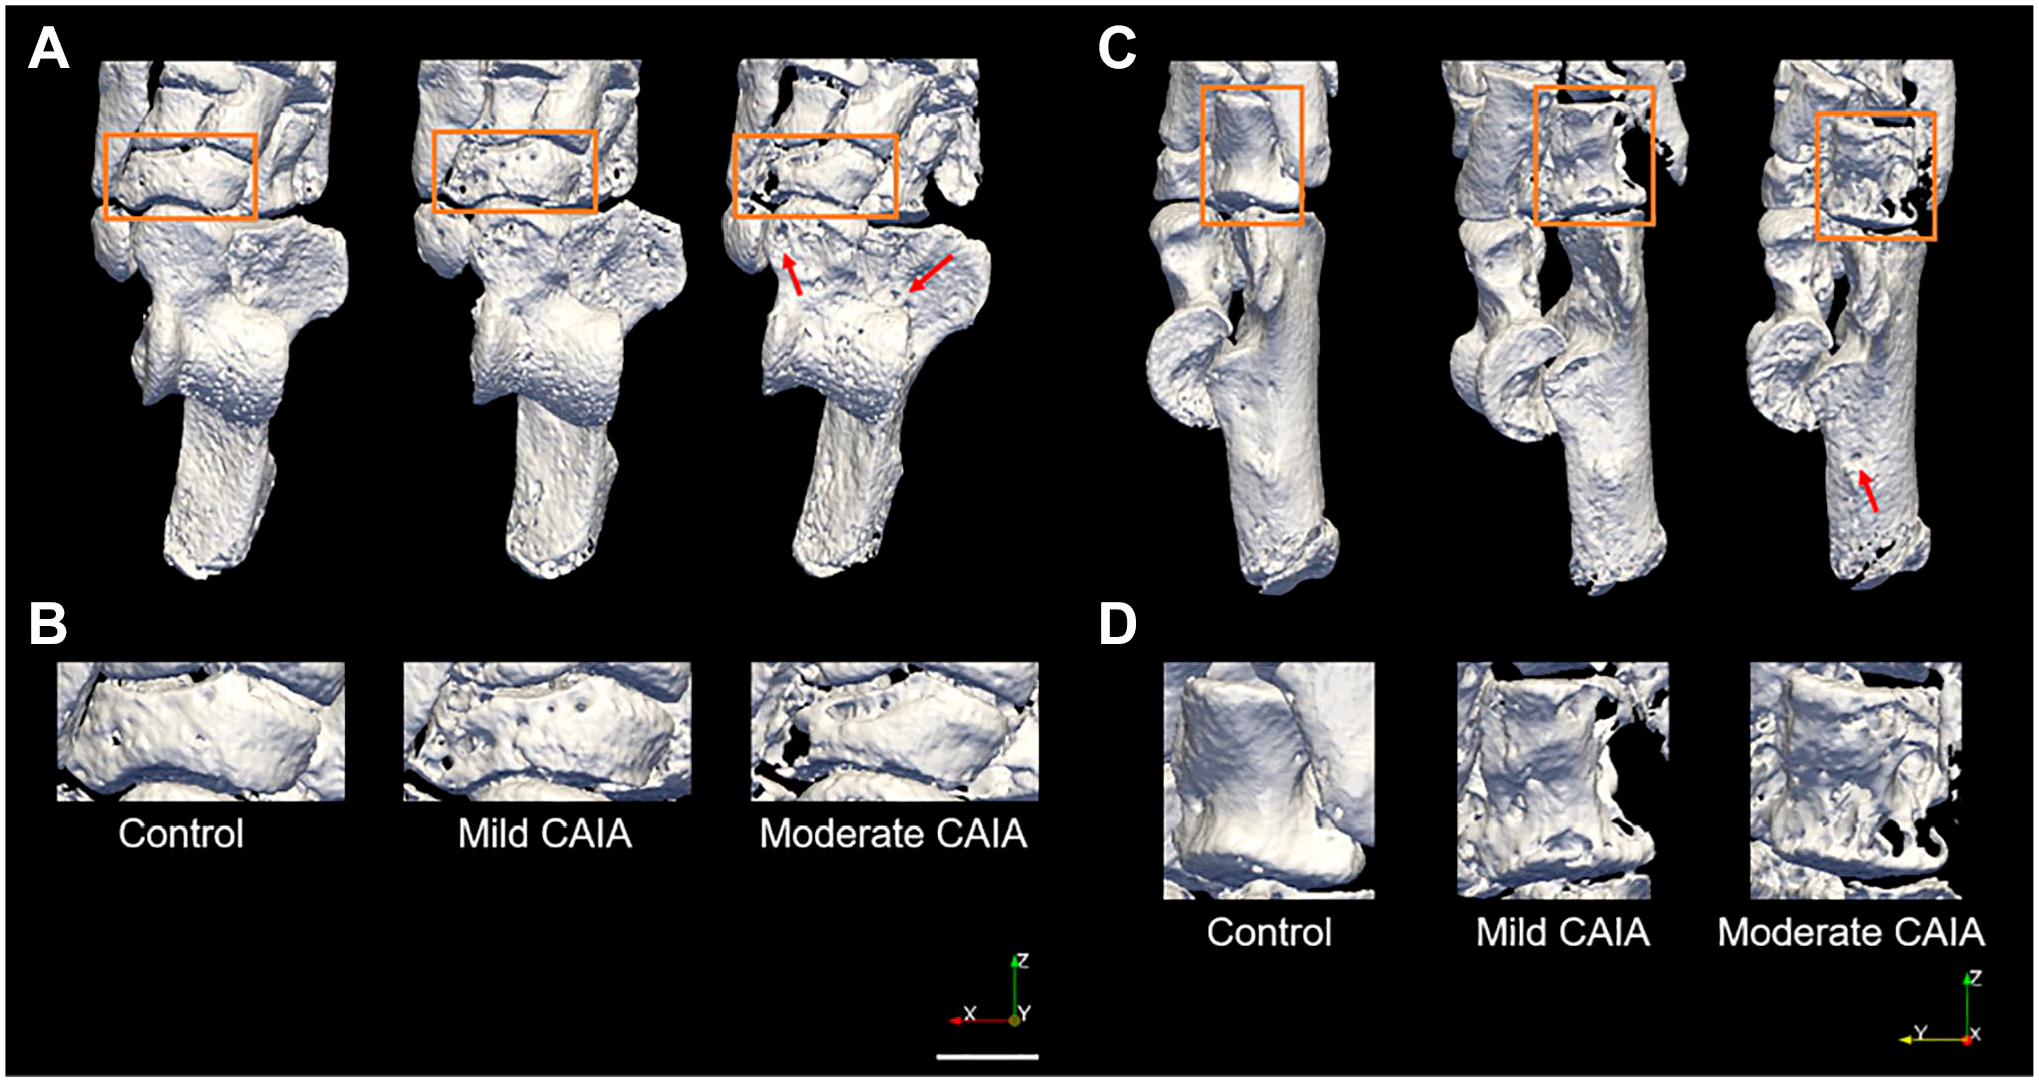
Representative 3D models of the right hind paw showing bone resorption pits. (A) Superior view of the right hind paw from control, mild CAIA, and moderate CAIA mice (3D micro-CT rendering). Orange boxes identify the navicular which is presented at greater magnification (B) to highlight the pitting present in this bone. (C) Lateral view of the right hind paw from control, mild CAIA, and moderate CAIA mice (3D micro-CT rendering). Orange boxes identify the cuboid which is presented at greater magnification (D) to show the pitting present in this bone. Red arrows represent bone resorption pits observed in the talus (A) and calcaneus (C). Scale bar represents 1 mm. Abbreviations: CAIA, collagen antibody-induced arthritis; CT, computer tomography.
PV in moderate CAIA mice was significantly greater in the radiocarpal joints (33.3 ± 2.0 mm3; Fig. 2D) and hind paws (24.0 ± 1.3 mm3; Fig. 2E) compared with control (21.7 ± 1.1 mm3; p=0.0003, and 13.1 ± 0.3 mm3; p<0.0001) and mild CAIA mice (18.8 ± 1.7 mm3; p=0.014, and 18.8 ± 1.7 mm3; p=0.014; Fig. 2D and E). PV in the mild CAIA was significantly higher than controls in the hind paws, but not in the radiocarpal joint.
Histological Evaluation of Inflammation and Bone Erosion in the Radiocarpal Joint Following CAIA Induction
Histological evaluation of the radiocarpal joint found significantly higher levels of cellular infiltration and pannus formation in moderate CAIA mice compared with control (p<0.001) and mild CAIA mice (p=0.02; Fig. 4A and C), with no difference observed between the mild CAIA mice and control mice. There was no significant difference in cartilage and bone degradation between mild and moderate CAIA groups (Fig. 4C) or between either of the CAIA groups and control mice.
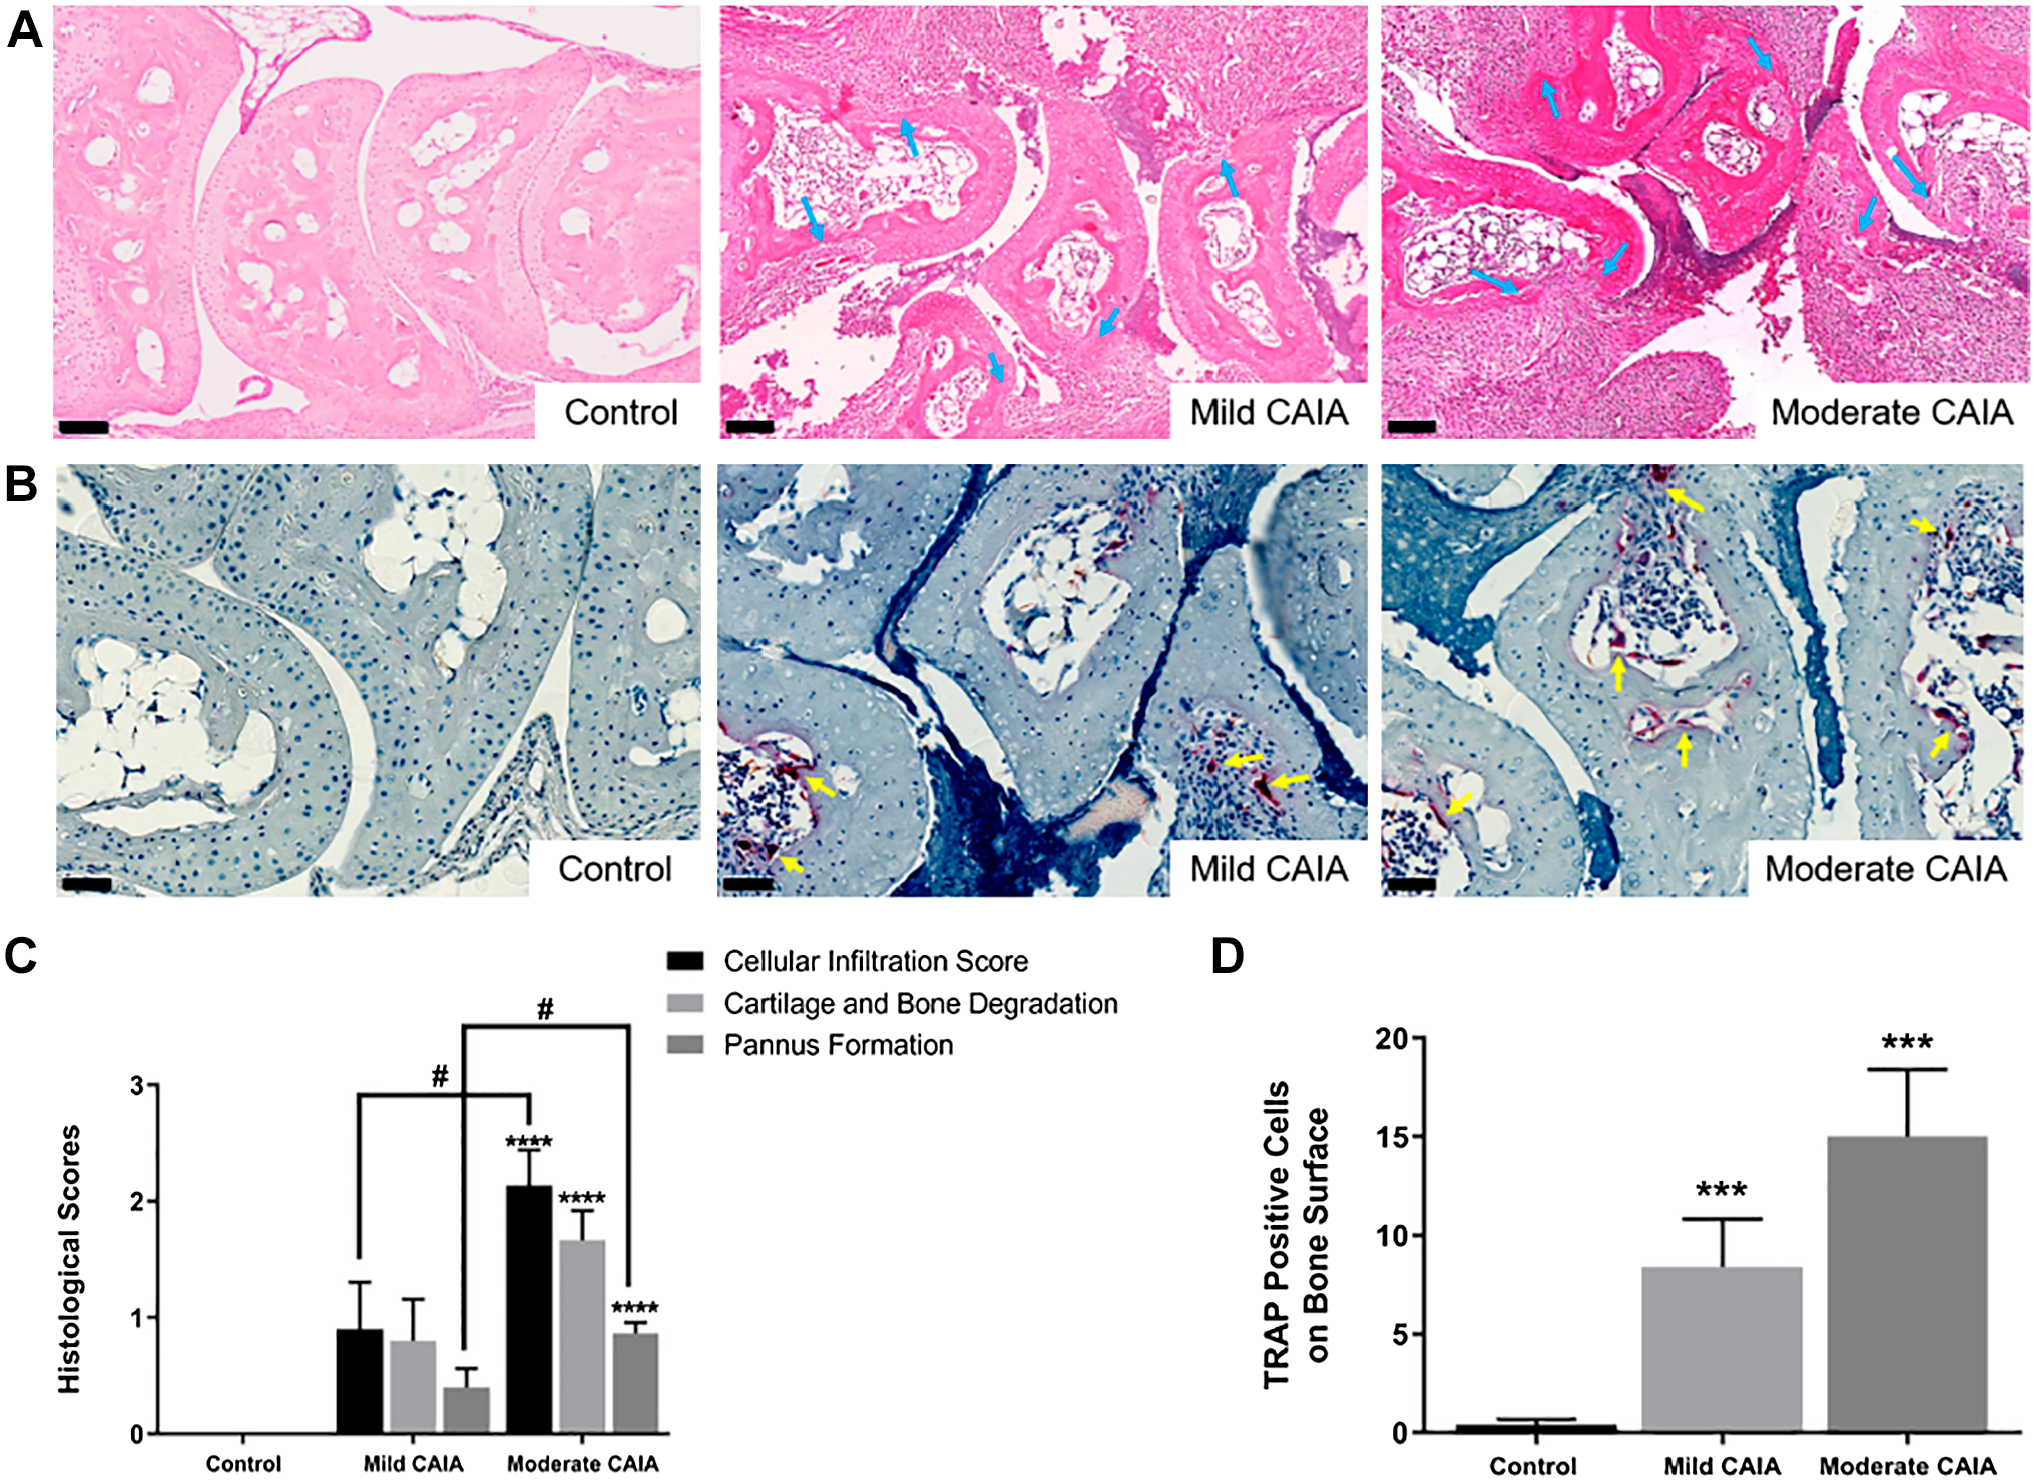
Histological assessment of inflammation, cartilage and bone destruction, and osteoclast-like cells in the radiocarpal joint. Representative H&E (A; 20× magnification) and TRAP (B; 40× magnification) stained tissue from mice radiocarpal joints. Blue arrows represent increased inflammatory cell infiltrate, pannus invasion, and subsequent cartilage/bone destruction. Yellow arrows represent multinucleated TRAP positive cells. C. Histological scores of H&E stained sagittal sections of the radiocarpal joint. D. Average values of TRAP positive multinucleated cells on the bone surface. Error bars represent SEM, n=10 paws (left and right together) per control and mild CAIA groups and n=15 paws (left and right together) per moderate CAIA group for histological analysis; n=10 paws (left and right together) per control and mild CAIA groups and n=14 (left and right together) paws per moderate CAIA group for TRAP analysis (*p<0.03, **p<0.0005, ***p<0.0001 vs. control, #p=0.02 vs. mild CAIA). Scale bars represent 100 µm for 20× magnification and 50 µm for 40× magnification. Abbreviations: CAIA, collagen antibody-induced arthritis; H&E, haematoxylin and eosin; SEM, standard error of the mean; TRAP, tartrate-resistant acid phosphatase.
Mild and moderate CAIA mice had significantly greater number of TRAP positive cells on the bone surface of the radiocarpal joint (8.4 ± 2.42 cells and 15 ± 3.41 cells, respectively) compared with control mice (0.4 ± 0.267 cells; p=0.0001 and p=0.001, respectively; Fig. 4B and D). A greater number of TRAP positive cells were identified in the surrounding soft tissue of the radiocarpal joint in moderate (44.36 ± 10.3 cells) and mild CAIA mice (32.3 ± 15.91 cells) compared with control mice (0.2 ± 0.2 cells, p=0.0006 and p=0.033, respectively; Fig. 4D). The number of TRAP positive cells on the bone surface and within the soft tissue did not differ significantly between mild and moderate CAIA (Fig. 4D).
Histological Analysis of Glial Cells Within the CNS Following CAIA Induction
GFAP Expression Within the CNS
Representative images of GFAP staining within the lumbar spinal cord and PAG are presented in Fig. 5A and B, respectively. There was no significant difference observed in GFAP-positive cells within the lumbar spinal cord between mild and moderate CAIA groups (Fig. 5C). In addition, no significant difference was identified between mild or moderate CAIA mice and control mice within this region. Mild and moderate CAIA mice had a significantly greater number of GFAP-positive cells in the PAG compared with control mice (p=0.0134, and p<0.0001, respectively, Fig. 5D). Moderate CAIA mice also had a significantly greater number of GFAP-positive cells (45.27 ± 2.191 cells/mm2) compared with mild CAIA mice in the PAG (37.60 ± 2.618 cells/mm2, p=0.0179, Fig. 5D).
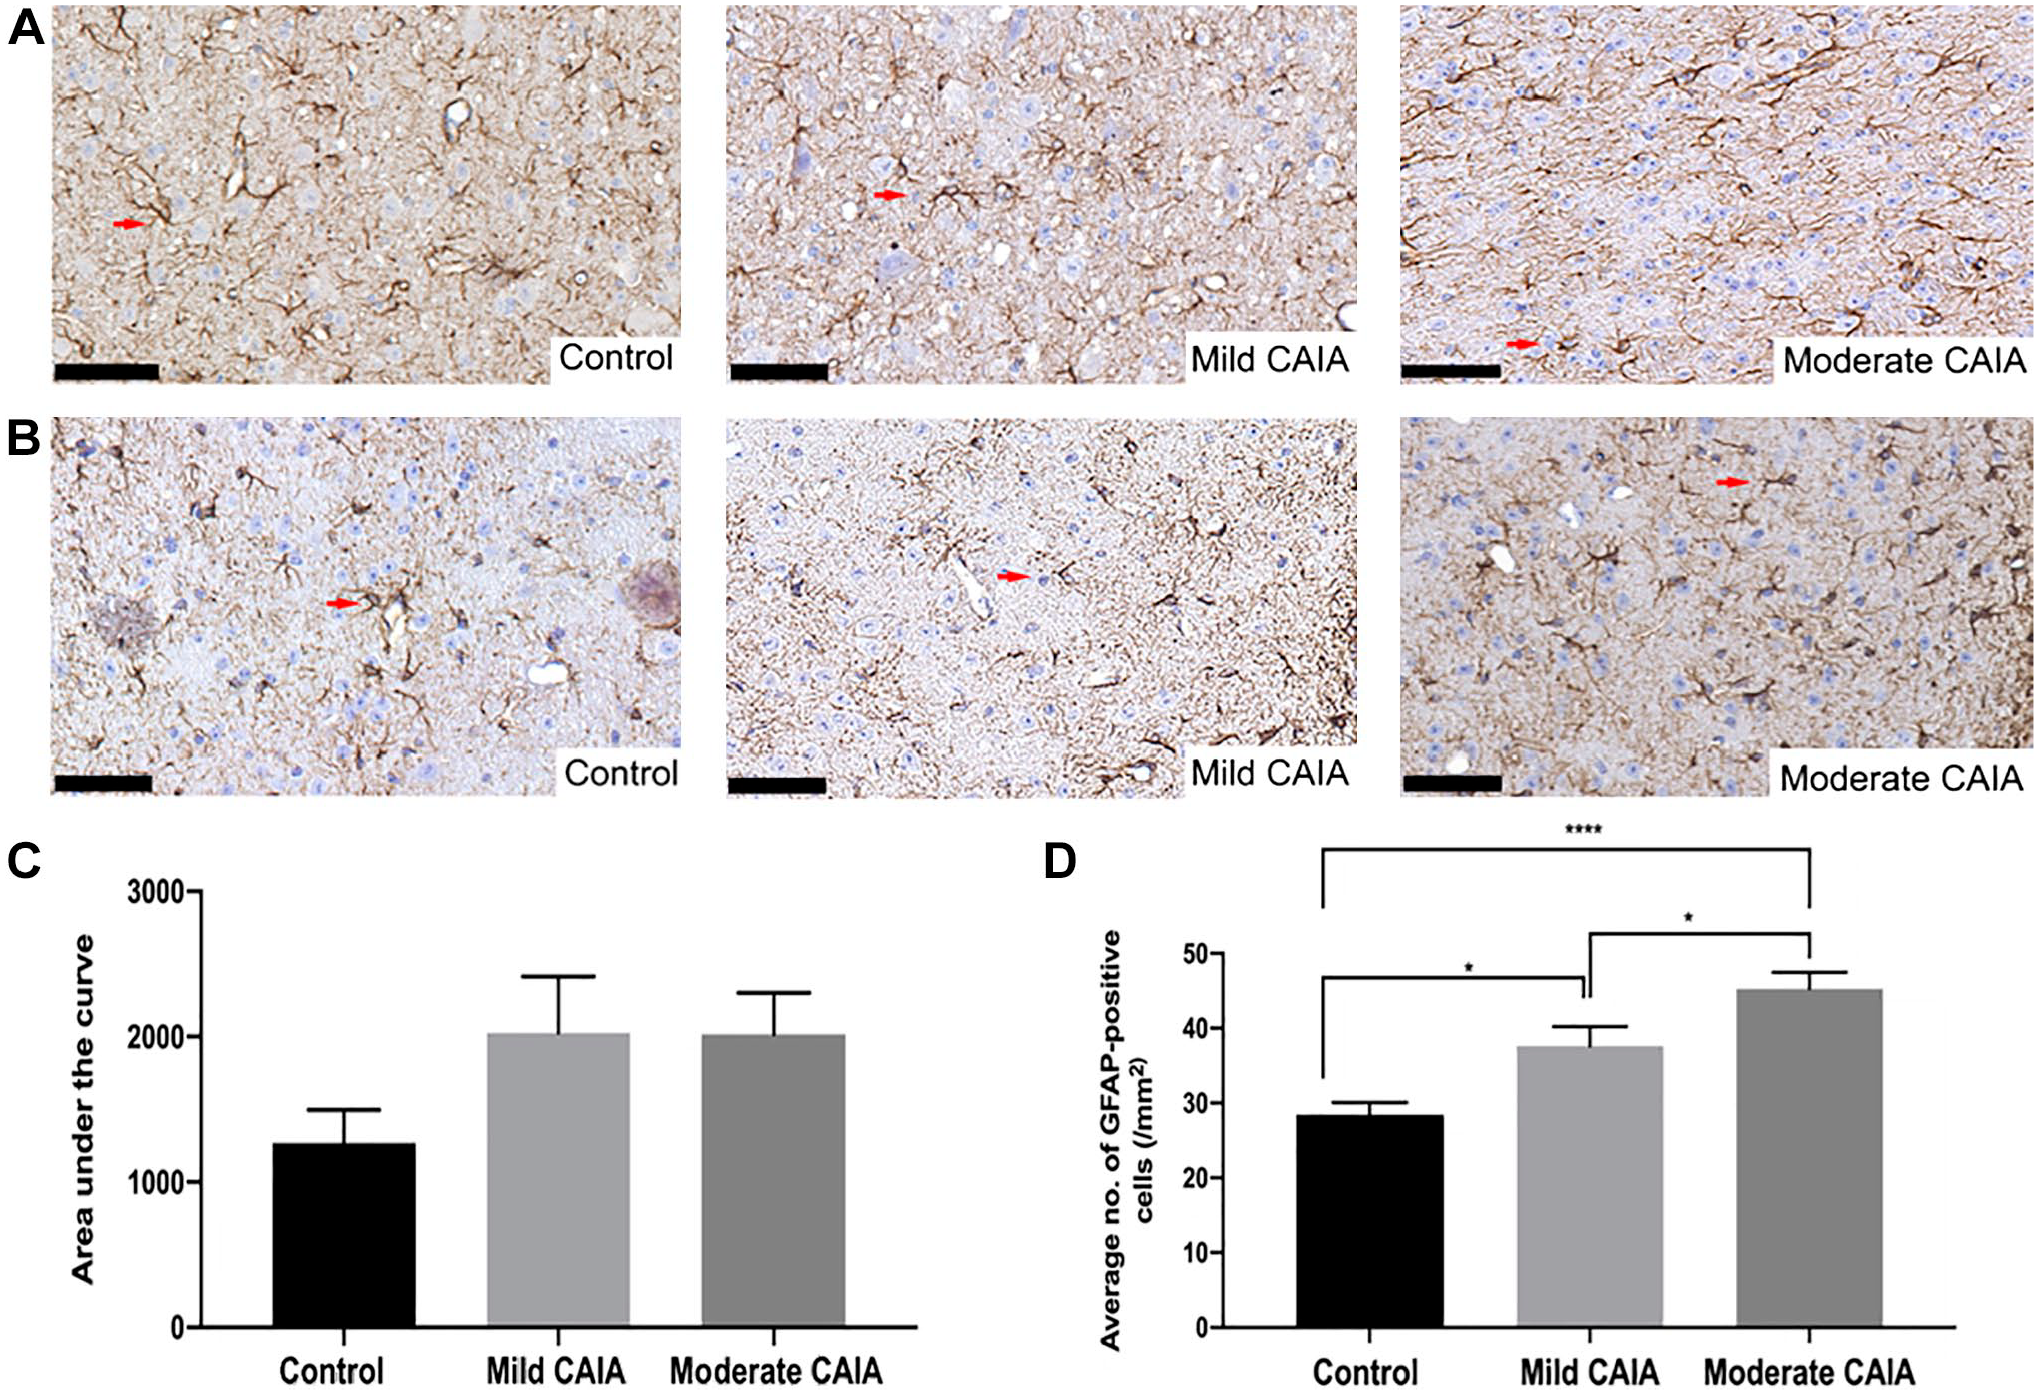
Histological assessment of GFAP-positive cells in the lumbar spinal cord and PAG region of the brain. Representative GFAP-stained tissue (40× magnification) from the lumbar spinal cord (A) and PAG region of the brain (B). Arrows represent GFAP-positive cells. (C) Area under the curve analysis of the average number of GFAP-positive cells in the lumbar spinal cord. (D) Average number of GFAP-positive cells in the PAG region of the brain. Error bars represent SEM (n=5 mice per control and mild CAIA groups, n=8 mice per moderate CAIA groups; *p=0.0134, ****p<0.0001 vs. control, #p=0.0179 vs. mild CAIA). Scale bars represent 50 µm. Abbreviations: CAIA, collagen antibody-induced arthritis; GFAP, glial fibrillary acidic protein; PAG, periaqueductal gray; SEM, standard error of the mean.
The IBA1 Expression Within the CNS
Representative images of IBA1 staining within the lumbar spinal cord and PAG are presented in Fig. 6A and B, respectively. Moderate CAIA mice had a significantly greater number of IBA1-positive cells in the lumbar spinal cord compared with control mice (p=0.0381; Fig. 6C). Moderate CAIA mice had significantly increased number of IBA1-positive cells compared with control mice within the PAG (p<0.001; Fig. 6D). There was also a significantly greater number of IBA1-positive cells within the PAG of moderate CAIA mice (13.18 ± 0.673 cells/mm2) compared with mild CAIA mice (10.71 ± 0.583 cells/mm2, p=0.0144, Fig. 6D).
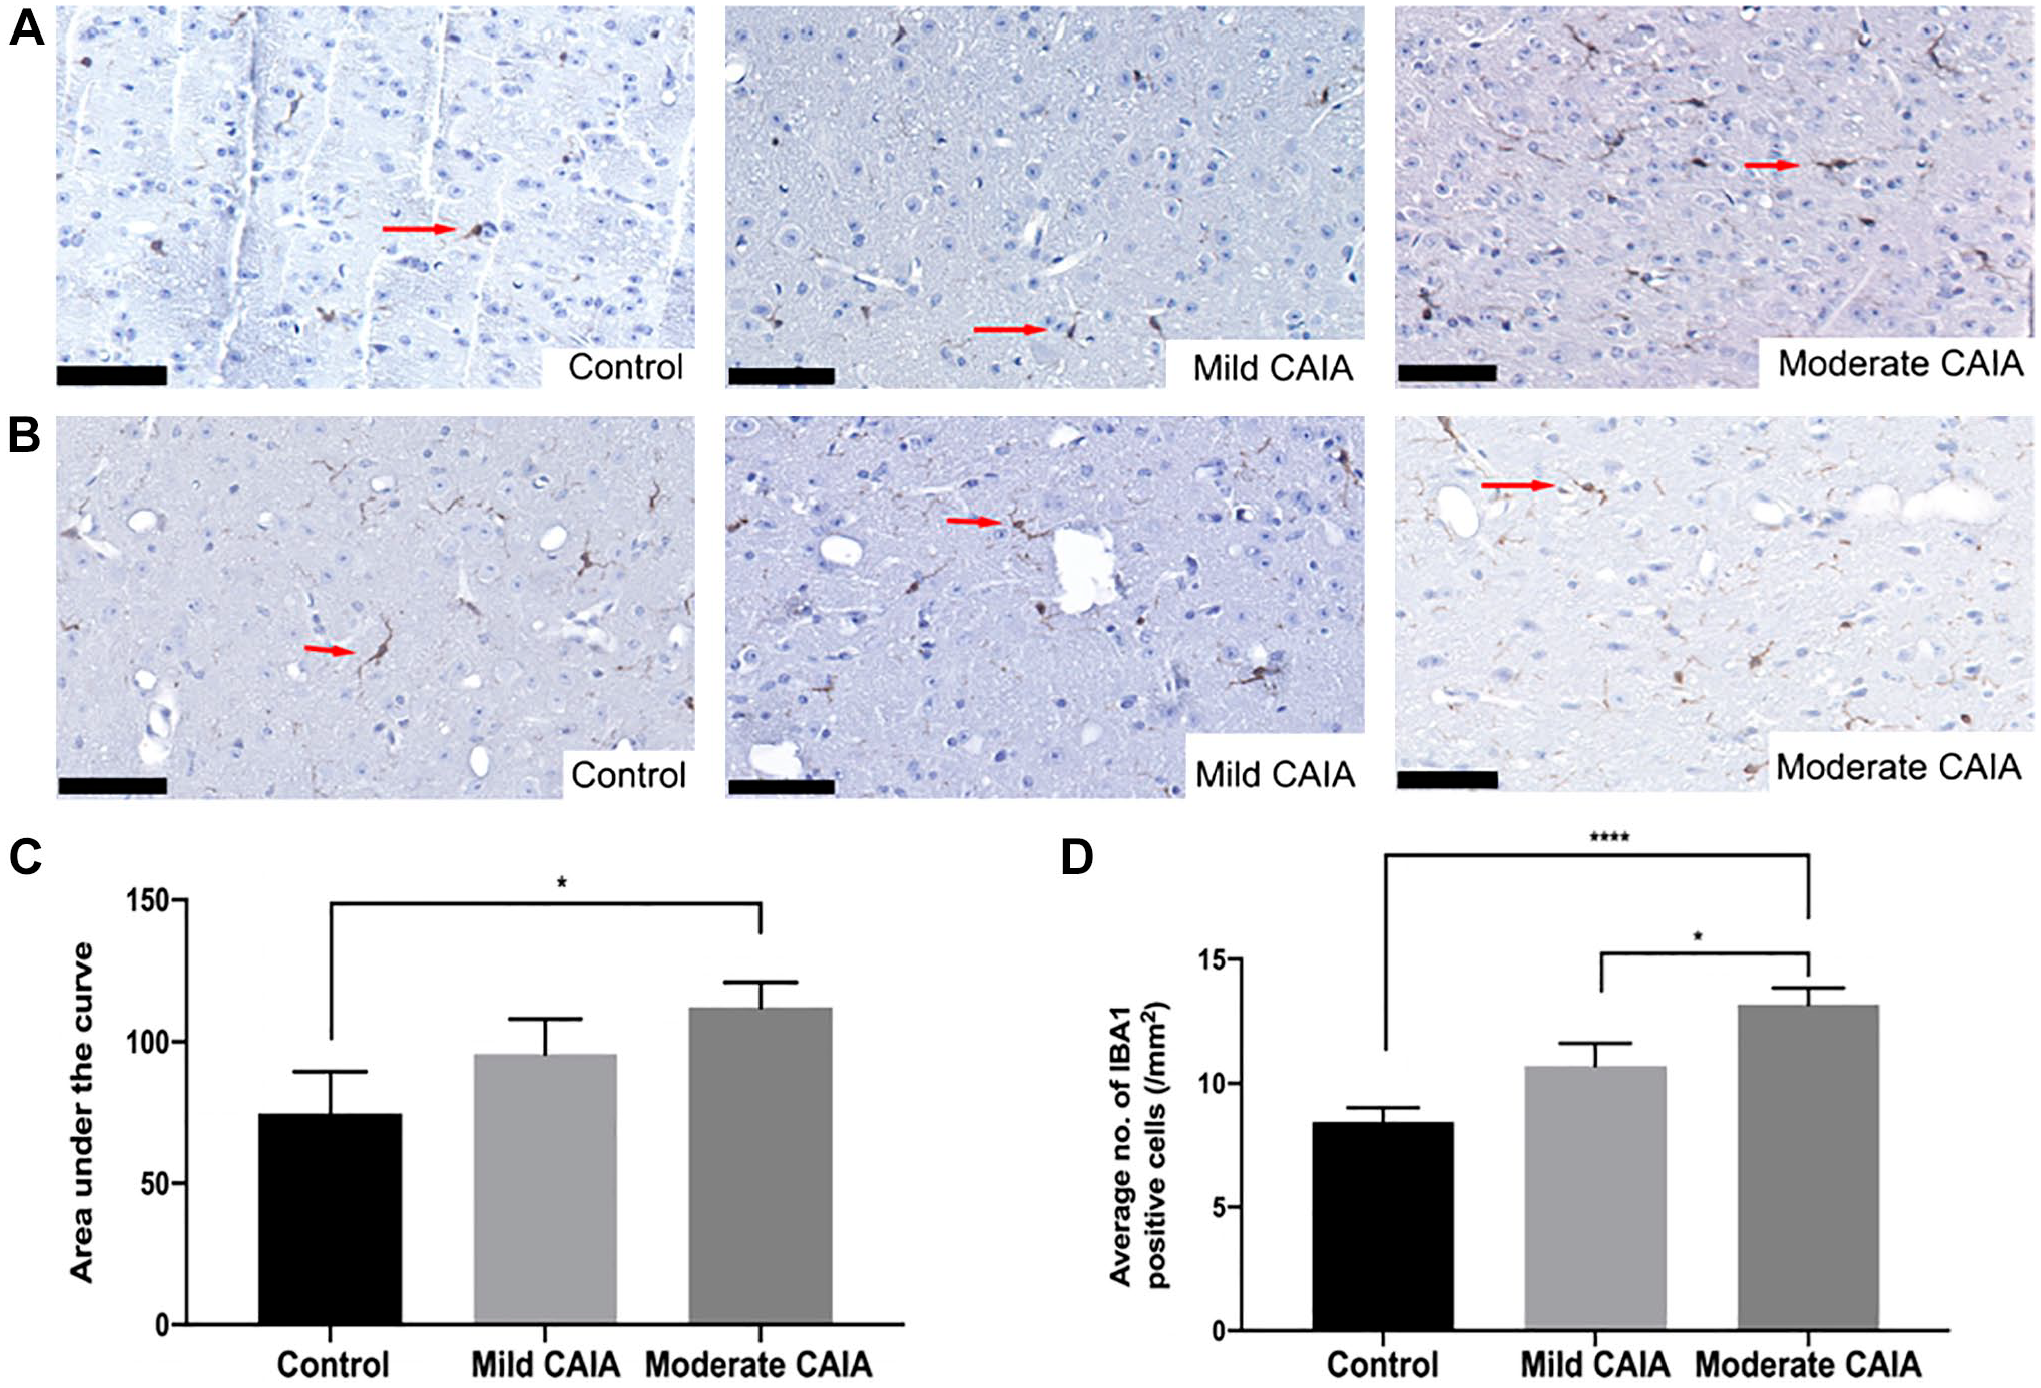
Histological assessment of IBA1-positive cells in the lumbar spinal cord and PAG region. Representative IBA1-stained tissue (40× magnification) of the lumbar spinal cord (A) and PAG region of the brain (B). Arrows represent IBA-1 positive cells. (C) Area under the curve analysis of the average number of IBA1-positive cells in the lumbar spinal cord. (D) Average number of IBA1-positive cells in the PAG region of the brain. Error bars represent SEM (n=5 mice per control and mild CAIA groups, n=8 mice per moderate CAIA groups; *p=0.0381, ****p<0.0001 vs. control, #p=0.0144 vs. mild CAIA). Scale bars represent 50 µm. Abbreviations: CAIA, collagen antibody-induced arthritis; PAG, periaqueductal gray; SEM, standard error of the mean.
Discussion
Currently, there are few animal models of inflammatory arthritis which assess clinical pain or activation within the central and peripheral nervous system concurrently with local joint inflammation and destruction. Furthermore, analysis has previously been carried out in models of inflammatory arthritis of different severities. Consequently, studies elucidating pathophysiology of RA and the effects of potential treatments on disease activity are carried out in models where the varied baseline is not appreciated, resulting in varied effects. Thus, this study aimed to identify whether a dose of 3 mg/mouse monoclonal antibodies in combination with low-dose LPS (10 µg), would produce a more moderate and consistent inflammatory arthritis concurrent with activation of glial cells, in comparison with the mild model, with a dose of 1.5 mg/mouse with 10 µg LPS, previously used.8,9,12
In addition, the current study assessed the effect of various monoclonal antibody doses within a female CAIA cohort only. This is important to note as studies have identified potential sex glial cell differences within inflammatory arthritis mouse models. 25 Fernandez-Zafra et al. 25 intrathecally administered a glial cell inhibitor; minocycline and pentoxifylline, into both female and male mice induced with a mild form (1.5 mg/mouse monoclonal antibody in combination with 25µg/mouse of LPS) of CAIA. Reduced microglial cell numbers were observed within female CAIA mice in comparison with male CAIA mice. 25 However, they do note that overall, there were no significant differences between control and CAIA groups. In addition, Vacca et al. 26 observed increased reactivity in astrocytic and microglial cells within the L4-L5 spinal cord in females compared with males. Thus, the inclusion of both male and female mice in future CAIA models would allow for the greater investigation of sex-specific differences in pain formation.
Our results suggest that inducing CAIA with a higher dose of monoclonal antibodies and low-dose LPS induces a moderate inflammatory response within all paws. As evidence of this, all moderate CAIA mice had significantly greater paw inflammation scores compared with mild CAIA mice throughout the 10-day model, suggesting a more reliable and consistent induction of disease. Assessment of paw inflammation in the CAIA model has previously been based on non-invasive visual assessment methods, including caliper measurements and clinical paw scoring.12,27,28 In the current study, the increased paw scores observed at day 10 in moderate CAIA mice were consistent with significantly increased PV in the front and hind paws as assessed using high-resolution micro-CT. This demonstrates that in comparison with previous studies,8,9,12 the inflammatory response can be enhanced when using a higher dose of monoclonal antibodies while maintaining a low dose of LPS. This also highlights the relevance of the quantification of soft tissue swelling by high-resolution micro-CT as an indicator of disease severity in the CAIA model.
Inflammation in the front paws of moderate CAIA mice was further investigated by histological analysis of the radiocarpal joint using an established scoring system.8,12 Moderate CAIA mice had greater levels of inflammatory cell infiltration and pannus formation compared with control and mild CAIA mice. Although mild CAIA mice had significantly greater paw scores compared with control mice, histological scores were not significant. This was not expected as we have previously reported significantly greater histological scores in mild CAIA models when compared with control mice.9,12 The conflicting findings when compared with past studies may be a result of the variable penetrance of the mild form of disease in Balb/c mice as joints are randomly affected due to the systemic administration.5,11 Thus, it is evident that the moderate CAIA model achieved a more effective and consistent result by producing the desired pathogenic features of RA joint destructions. Further to this, histopathology can still be assessed, while with severe disease induction, joint destruction is so severe that mice are either euthanised or histological assessment is problematic.
Micro-CT analysis of BV was carried out on the front and hind paws to assess the systemic effects of disease induction more thoroughly. BV was significantly reduced in both the front and hind paws of the moderate CAIA mice compared with control mice, whereas mild CAIA mice exhibited BV only in the hind paws. This is consistent with a previous study by our group, which also assessed BV by micro-CT (9 µm/pixel) in the front paws of mild CAIA at day 10 and was unable to detect significant changes. 8 Of note, the limited (hence not significant) change in BV in the front paws in mild CAIA compared with control is not consistent with the significantly greater number of TRAP positive multinucleated cells found within the radiocarpal joints in mild CAIA mice, but could be attributed to the arthritic response being too mild to detect BV changes volumetrically at the macroscopic level, despite using high-resolution micro-CT analysis.
We report for the first time the observation of resorption pits on the bone surface in the 3D micro-CT images of the hind paws. Consistent with our TRAP findings, these appeared to be bigger in moderate CAIA hind paws compared with mild CAIA (qualitative observation). However, these were not sufficient to generate detectable BV differences in the hind paws between the two diseased groups. Future studies may aim at quantifying these pits. Together, our macroscopic and microscopic analysis of the joints suggest that inducing moderate pathogenic features of RA in mice allows for a more effective assessment of bone changes and offers a potential modification to the CAIA model, which could be implemented for the accurate assessment of new therapeutics on joint inflammation and bone destruction.
Pain-like behavior has been previously investigated and is known to be induced through anticollagen II administration.10,29 However, limited studies have assessed regions of the brain and spinal cord that have been associated with pain in the CAIA model. GFAP and IBA1 positive cells are representative of astrocyte and microglia, respectively, which have been shown to be involved in responding to inflammation within the CNS. 30 Within the lumbar spinal cord, IBA1 but not GFAP-positive cells were significantly greater in the moderate CAIA group compared with control mice. There was no significant increase in the average number of GFAP or IBA1 positive cells in moderate CAIA mice compared with mild CAIA mice within the lumbar spinal cord, suggesting that there is no dose effect on glial reactivity as the higher monoclonal antibody dose did not increase glial reactivity within the CAIA model. This suggests that a moderate monoclonal antibody dose of 3 mg/mouse is required to elicit an increase in glial reactivity within the lumbar spinal cord. These findings are not consistent with a previous study by our laboratory, which showed a significant increase in both GFAP and IBA1 positive cells within the lumbar spinal cord of mild (1.5 mg/mouse monoclonal antibody + 10 µg LPS) CAIA mice compared with control mice. 20
In the PAG region of the brain, there was a significant increase in GFAP-positive cells for both moderate and mild CAIA mice compared with control mice. This finding is consistent with a previous study from our laboratory, which observed a significant increase in GFAP-positive cells in the PAG of mild CAIA (1.5 mg/mouse monoclonal antibody and 10 µg LPS) mice compared with control. 20 However, within the current study, IBA1 positive cells were only significantly increased in moderate CAIA mice compared with control. A significant increase in GFAP and IBA1 positive cells was observed in the PAG in moderate CAIA mice compared with mild CAIA mice, suggesting that a moderate CAIA model can produce a stronger glial reactivity response compared with the mild CAIA model allowing a variance in disease severity without resulting in a detrimental inflammatory response. The significant increase in glial cells in moderate CAIA mice compared with mild CAIA mice was observed in the PAG, however not in the lumbar spinal cord. This is interesting to note as it highlights the importance of investigating the brain as well as the lumbar spinal cord when examining the effects of peripheral inflammation within the CAIA mouse model.
The glial modulation observed in the PAG may be a result of disruption to the BBB. Previous studies have identified an increase in cerebrovascular permeability in male mice following CIA induction. 17 In addition, microgliosis and astrogliosis have been reported to be significantly increased within the brains of female rats with CIA and this was associated with a significant increase in BBB permeability. 31 Although BBB permeability was not directly measured within the current study, the systemic inflammation observed within the CAIA model could potentially decrease BBB integrity, allowing pro-inflammatory cytokines to cross the BBB resulting in the glial modulation observed within the CNS. Therefore, the increase in glial cells within the PAG indicates that the differing severity of inflammatory arthritis not only influences the peripheral nervous system but also the central processing pathway of pain. These findings indicate that a higher dose of monoclonal antibody in combination with low-dose LPS in the CAIA murine model induces more consistent histopathological features, without excessive joint destruction. Moderate CAIA induced greater paw swelling than mild CAIA and a more consistent bone loss. In addition, moderate CAIA induced greater IBA1 and GFAP-positive cells within the PAG indicating significant changes in glial reactivity. Although the number of TRAP positive multinucleated cells were not consistent with BV measurements, the observed resorption pits on the hind paws indicates active resorption which may not yet be detectable through volumetric analysis of high-resolution micro-CT. Overall, these findings highlight the complex mechanisms associated with the progression of joint destruction and pain, and the importance of the optimal chosen dose for studying RA in a female murine model.
Footnotes
Acknowledgements
We would like to acknowledge Adelaide Microscopy at the University of Adelaide and the University of Adelaide Animal Laboratory Services for assistance with the animal model and imaging, as well as, the Histology Laboratory at the University of Adelaide for their assistance with processing tissues.
Competing Interests
The author(s) declared no potential conflicts of interest with respect to the research, authorship, and/or publication of this article.
Author Contributions
All authors have contributed to this article as follows: BW: conceptualization, methodology, investigation, formal analysis, writing—original draft preparation; FL: methodology, investigation, formal analysis, writing—review, draft preparation and editing; HT: investigation, formal analysis, writing—review and editing; MH: supervision, writing—review and editing; EP: resources, supervision, investigation, writing—review & editing; and TNC: conceptualization, supervision, writing—review and editing. The final manuscript was read and approved by all authors listed.
Funding
The author(s) disclosed receipt of the following financial support for the research, authorship, and/or publication of this article: B.W. was supported by an Australian Government Research Training Program Scholarship. F.L. is a recipient of the University of Adelaide Faculty of Health and Medical Science’s Divisional Scholarship and the Commonwealth Scholarships Program for South Australia. M.R.H. is a recipient of an Australian Research Council Research Fellowship (DP110100297 up to 2016) and Future Fellowship (FT180100565 from 2018).