
Abstract
Sjögren’s syndrome (SS) is a chronic inflammatory autoimmune disorder that causes secretory dysfunction of the salivary glands leading to dry mouth. Previous studies reported that tight junction (TJ) proteins are down-regulated and lose polarity in human minor salivary glands with SS, suggesting that TJ structure is compromised in SS patients. In this paper, we utilized the NOD/ShiLtJ mouse with the main goal of evaluating this model for future TJ research. We found that the organization of apical proteins in areas proximal and distal to lymphocytic infiltration remained intact in mouse and human salivary glands with SS. These areas looked comparable to control glands (i.e., with no lymphocytic infiltration). TJ staining was absent in areas of lymphocytic infiltration coinciding with the loss of salivary epithelium. Gene expression studies show that most TJs are not significantly altered in 20-week-old NOD/ShiLtJ mice as compared with age-matched C57BL/6 controls. Protein expression studies revealed that the TJ proteins, zonula occludens-1 (ZO-1), occludin, claudin-12, as well as E-cadherin, do not significantly change in NOD/ShiLtJ mice. Our results suggest that ZO-1, occludin and E-cadherin are not altered in areas without lymphocytic infiltration. However, future studies will be necessary to test the functional aspect of these results.
Introduction
Sjögren’s syndrome (SS) is an autoimmune disorder characterized by dry mouth and dry eyes (Gannot et al. 2000; Hayashi 2011). Patients with hyposalivation are predisposed to dental caries, oropharyngeal infections and mucositis. Furthermore, they experience difficulty in speaking and swallowing food, which decreases the quality of life for the afflicted patients (Lawrence et al. 2008; Thomson et al. 2006). The hyposalivation observed in SS is associated with extensive lymphocytic infiltration into the salivary tissue (Gannot et al. 2000), thus destroying or replacing the acinar cells (Kassan and Moutsopoulos 2004; Niki et al. 2006). Although extensive research has been done to understand the ethiopathogenesis of SS, little is known about changes in cell polarity that occur in salivary glands during the progression of the disease.
Tight junctions (TJs) in salivary glands allow cell compartmentalization and unidirectional saliva secretion (Maria et al. 2008). Previous studies evaluated the expression, distribution and localization of TJ proteins from histopathologically normal submandibular glands (SMG) and parotid glands. Specifically, they demonstrated that claudin-1, -2, -3 and -4 were expressed in both acinar and ductal cells from these glands (Maria et al. 2008). We have shown that pro-inflammatory cytokines associated with SS caused disruption to TJ and secretory function in salivary epithelium in vitro (Baker et al. 2008). Other studies in human minor salivary glands (hMSGs) with SS have shown that zonula occludens-1 (ZO-1) and occludin were significantly down-regulated whereas claudin-1 and claudin-4 were up-regulated (Ewert et al. 2010). Additionally, the organization of the TJ proteins claudin-3 and -4 were redistributed from the apical to basolateral membrane. Collectively, these results indicate that TJs are expressed in salivary gland epithelium and some TJ proteins are likely altered in SS.
In this study, we looked at the organization of the cell junction proteins ZO-1, occludin and E-cadherin in mouse and hMSGs with and without SS. Additionally, we expanded TJ expression studies to the NOD/ShiLtJ SS mouse model, which can be studied at two time points: the pre-disease stage (~4-6 weeks) and after the onset of clinical SS-like disease (16–20 weeks), which is characterized by secretory dysfunction and lymphocytic infiltration (Robinson et al. 1998; Yamano et al. 1999). We utilized NOD/ShiLtJ mice during these two stages as a model for SS. The use of this mouse model was in preparation for future in vivo assays to understand TJ function during saliva secretion.
Our results indicate that the organization of ZO-1, occludin and E-cadherin remain intact in areas proximal and distal to lymphocytic infiltration in both mouse and hMSGs with SS. TJ staining is absent in areas of lymphocytic infiltration coinciding with a loss of salivary epithelium. Gene expression studies show that TJs are not significantly altered in 20-week NOD/ShiLtJ mice as compared with age-matched C57BL/6 controls, with the exception of claudin-12, membrane protein palmitoylated 5, occludin and Rhoa, which are significantly up-regulated. We also found that the expression of ZO-1, occludin, claudin-12 and E-cadherin do not significantly change in NOD/ShiLtJ mice. These findings suggest that lymphocytic infiltration does not affect the organization of ZO-1, occludin and E-cadherin in salivary glands with SS. Additionally, the overall TJ gene and protein levels in NOD/ShiLtJ mice is not affected.
Materials & Methods
Experimental Animals
Female C57BL/6 and NOD/ShiLtJ mice at 5 and 20 weeks of age were anesthetized via intraperitoneal injection with 80–100 mg/kg ketamine and 5 mg/kg xylazine. Mice were euthanized by abdominal exsanguination, and the SMGs were removed and frozen with isopentane in liquid nitrogen for histological, RNA and protein analyses. All animal usage, anesthesia and surgery were conducted under the strict guidelines and approval of the State University of New York at Buffalo Institutional Animal Care and Use Committee (Animal Welfare Assurance Number: A3354-01).
Human Studies
Formalin-fixed, paraffin-embedded lower lip salivary glands from female subjects between 22-87 years of age were obtained from the Sjögren’s Syndrome International Collaborative Clinical Alliance (SICCA) Repository University of California, San Francisco. All human specimen usage was conducted under the strict guidelines and approval of the State University of New York at Buffalo Health Sciences Institutional Review Board (HSIRB), under the exempt criteria 45 CFR 46.101(b)(4). The HSIRB approved the use of the de-identified samples which do not fall under any of the regulatory provisions of HIPAA.
To assure proper diagnosis, an oral pathologist evaluated all biopsies using the 2012 American College of Rheumatology Classification Criteria for SS to determine the focus score (the number of focal mononuclear infiltrates with ≥50 mononuclear cells per 4 mm2). Grade was determined by histopathologically examining the tissue and graduating for lymphocyte infiltration (focus): grade 0: absent; grade 1: slight; grade 2: moderate non-focal infiltration; grade 3: 1 focus (> or =50 lymphocytes) per 4 mm2; grade 4: >1 focus. Grade 3 infiltrates corresponded to a focus score of 1, which is one of four disease-classifying criteria acknowledged for diagnosis (Krenn et al. 2010; Shiboski et al. 2012). hMSG with a focus score of 0 were used as controls.
Histology
Formalin-fixed, paraffin-embedded, 5-µm sections from SS and non-SS patients were prepared at the Peninsula Histopathology Laboratory (Campbell, CA). Flash-frozen, 10-µm sections from C57BL/6 and NOD/ShiLtJ mice were prepared at The University at Buffalo, Histological Services, Department of Pathology and Anatomical Sciences.
hMSG sections were stained with Hematoxylin & Eosin (see Supplemental data, Materials and Methods) and examined under an Olympus BH-2 microscope (Olympus Optical Company, LTD. Japan). hMSG sections showing microscopic features consistent with a diagnosis of SS (i.e., grade 4 and focus score >2) (Chisholm and Mason 1968; Greenspan et al. 1974) were used as SS samples. Other hMSG sections showing microscopic features consistent with mild chronic sialadenitis (i.e., grade <1; focus score, 0) were used as non-SS controls (see Supplemental Figure 1).
Immunofluorescence
Frozen mouse SMG (mSMG) tissue sections were fixed in 4% paraformaldehyde (w/v) for 10 min at room temperature, incubated with 0.1% Triton X-100 (v/v) in 1× phosphate-buffered saline (PBS) for 5 min and washed with PBS. Tissue sections were then incubated with 5% goat serum (v/v) in PBS for 1 hr at room temperature and washed three times with PBS. Sections were dual-incubated overnight at 4°C with rabbit anti-ZO-1 (1:100 dilution in 5% goat serum; Invitrogen, Carlsbad, CA) with mouse anti-E-cadherin (1:100 dilution in 5% goat serum; BD Biosciences, San Jose, CA), or rabbit anti-occludin (1:100 dilution in 5% goat serum; Millipore, Bedford, MA) with mouse anti-E-cadherin (1:100 dilution in 5% goat serum; BD Biosciences). The following day, the slides were warmed to room temperature for 20 min and washed three times for 5 min each with PBS. Tissue sections were incubated for 1 hr with Alexa Fluor 488-conjugated goat anti-rabbit (1:500 dilution in 5% goat serum; Sigma-Aldrich, St. Louis, MO) and Alexa Fluor 633-conjugated goat anti-mouse (1:500 dilution in 5% goat serum, Sigma-Aldrich) then washed three times with PBS. Tissues were stained for 1 hr with propidium iodide nucleic acid stain (1:3,000 dilution in 2× sodium citrate, Invitrogen). Images were taken using a Carl Zeiss 510 Confocal microscope and the localization of TJ proteins was visualized using the ZEN software (black edition; Carl Zeiss, Thornwood, NY). All microscope settings; (i.e., pinhole and laser power) were kept consistent for all samples. Exposure times of secondary antibody controls (negatives, see Supplemental Fig. 2) were matched to their corresponding experimental images (see individual figure legends).
Formalin-fixed, paraffin-embedded hMSG were deparaffinized by three washes for 5 min each in 100% xylene. Sections were washed twice for 5 min in 100% ethanol, twice for 5 min in 95% ethanol, followed by 5 min washes in 80%, 70%, and 50% ethanol and twice in distilled water, respectively. Antigen retrieval was performed by placing the slides in a pressure cooker (Nesco, Two Rivers, WI) filled with 1× sodium citrate for 6 min. Sections were allowed to cool to room temperature. Sections were then rinsed in PBS followed by permeabilization with 0.1% Triton X-100 (v/v) for 45 min at room temperature. Finally, sections were washed three times for 5 min each in PBS and incubated with primary antibodies (as described for mouse frozen sections) for 48 hr.
RNA Extraction and Preparation of cDNA
Total RNA from six different frozen mSMG (three SMG from C57BL/6 and three SMG from NOD/ShiLtJ) was extracted using an RNeasy tissue kit (Qiagen, Valencia, CA) according to the manufacturer’s instructions. RNA quantity was assessed using a BioTek Epoch microplate spectrophotometer and corresponding software Gen 5 Ver. 1.11.5 (BioTek, Winooski, VT). Each sample was diluted to 30 ng/µl in RNAse-free water. RNA purity was assessed by measurement of A260/A280 in a BioTek Epoch microplate spectrophotometer.
RNA (0.5 μg) was then reverse transcribed to cDNA using the RT2 First Strand kit (Qiagen). The RNA integrity was analyzed by agarose gel to determine the quality and integrity values to RNA measurements.
PCR Array
Detection and quantification of mouse TJ gene expression was performed with three different mSMG specimens per mouse strain (i.e., SS vs non-SS) using an RT2 Profiler mouse TJ kit, according to the manufacturer’s instructions (SABiosciences, Valencia, CA). This kit profiles the expression of 84 genes encoding proteins that form the TJ barriers important in regulating cell polarity. Quantitative PCR was performed for each sample individually using a CFX-96 Touch Thermocycler (Bio-Rad, Hercules, CA). All threshold cycle [CT] values were normalized to the housekeeping gene glucuronidase beta (Gusβ) to generate the ΔCT values. This housekeeping gene was used for consistency between the multiple comparisons of replicates. All replicates were then pooled to determine the relative expression level of each gene between the control and NOD/ShiLtJ mSMG groups. The difference between the ΔCT value of the sample versus control sample was calculated as ΔΔCT [CT] using the adaptive baseline function in the CFX Manager software, version 3.0 (Bio-Rad). A Genomic DNA Control (GDC) primer set that specifically detects non-transcribed genomic DNA contamination with a high level of sensitivity was included in the PCR array. GDC [CT] values were greater than 35 for all replicate PCR samples run, indicating that the level of genomic DNA contamination was minimal and did not affect gene expression profiling results. Data were analyzed using the online RT2 Profiler PCR Array Data Analysis version 3.5 (SABiosciences). Significance was determined using a t-test.
Western Blot Analysis
Western blot analyses were performed using mSMG sample. A single mSMG was lysed in 300 μl of 2× Laemmli buffer (120 mM Tris-HCl, pH 6.8, 10% (v/v) glycerol, 2% (w/v) SDS, 1 mM dithiothreitol and 0.002% (w/v) bromophenol blue), sonicated for 60 sec with a Sonic Dismembrator (model 120; microtip; amplification 45%; Fisher Scientific, Pittsburgh, PA), and boiled for 5 min. Twenty microliters of mSMG lysates were subjected to electrophoresis with 4–15% (w/v) Mini-Protean TGX gels (Bio-Rad) and transferred to nitrocellulose membranes (Bio-Rad). Membranes were blocked for 1 hr with 3% (w/v) BSA in Tris-buffered saline [0.137 M NaCl, 0.025 M Tris (hydroxymethyl)-aminomethane, pH 7.4] containing 0.1% (v/v) Tween-20 (TBST). Membranes were then immunoblotted overnight at 4°C in TBST containing 3% (w/v) BSA with primary antibodies: rabbit anti-ZO-1 (1:100 dilution; Invitrogen), rabbit anti-occludin (1:500 dilution; Millipore), rabbit anti-claudin-12 (1:100 dilution; Santa Cruz Biotechnology, Dallas, TX), and rabbit anti-E-cadherin (1:500 dilution; Cell Signaling Technology, Danvers, MA). After incubation, membranes were washed three times for 20 min each with TBST and incubated for 1 h with peroxidase-linked goat anti-rabbit IgG antibody (1:5,000 dilution; Cell Signaling Technology). The membranes were treated with Clarity™ Western ECL Substrate (Bio-Rad), and protein bands were visualized and quantitated using a ChemiDoc® MP and Image Lab v4.1 software (Bio-Rad). Membranes were treated with Restore™ Western Blot Stripping Buffer (Thermo Scientific, Rockford, IL) and re-probed with rabbit (α-β-tubulin) (1:500 dilution; Cell Signaling Technology) for signal normalization followed by peroxidase-linked goat anti-rabbit IgG antibody (1:5,000 dilution; Cell Signaling Technology).
Statistical Analysis
Data are the mean ± SEM of results from three or more determinations. P values <0.05, calculated from a two tailed t-test, represent significant differences between experimental groups.
Results
ZO-1, Occludin and E-cadherin Remain Intact in Areas Proximal to Lymphocytic Infiltration in Salivary Glands with SS
To determine whether ZO-1 was altered during the progression of SS, we compared SMG from NOD/ShiLtJ mice displaying disease onset (i.e., 20 weeks of age) to SMG from control mice (i.e., NOD/ShiLtJ mice at 5 weeks of age and C57BL/6 mice at 20 weeks of age). SMG from NOD/ShiLtJ mice at disease onset displayed dense nuclear staining, indicative of areas of lymphocytic infiltration (Fig. 1A; red arrow), which were absent in the control mice (Fig. 1E–1L). We did not observe any apical ZO-1 staining (Fig. 1A, 1C, 1D) or E-cadherin staining (Fig. 1A, 1B, 1D) in areas of lymphocytic infiltration. Areas proximal to lymphocytic infiltration displayed ZO-1 apical localization in acinar and ductal structures (Fig. 1C; white arrow). E-cadherin showed basolateral localization in acini and ducts (Fig. 1B; yellow arrow) from areas without lymphocytic infiltration. We also examined the localization of occludin in NOD/ShiLtJ mSMG at 20 weeks, which displayed an absence of apical occludin staining in areas within lymphocytic infiltration (Fig. 2A–2D; red arrow). In contrast, areas proximal and distal to lymphocytic infiltration showed apical occludin expression, despite being adjacent to lymphocytic infiltrates (Fig. 2C; white arrow). Control mice exhibited apical occludin (Fig. 2E, 2G, 2H, 2I, 2K, 2L; white arrows) and E-cadherin (Fig. 2E, 2F, 2H–2J, 2L; yellow arrows) localization in both acinar and ductal cells, similar to what we observed with ZO-1.
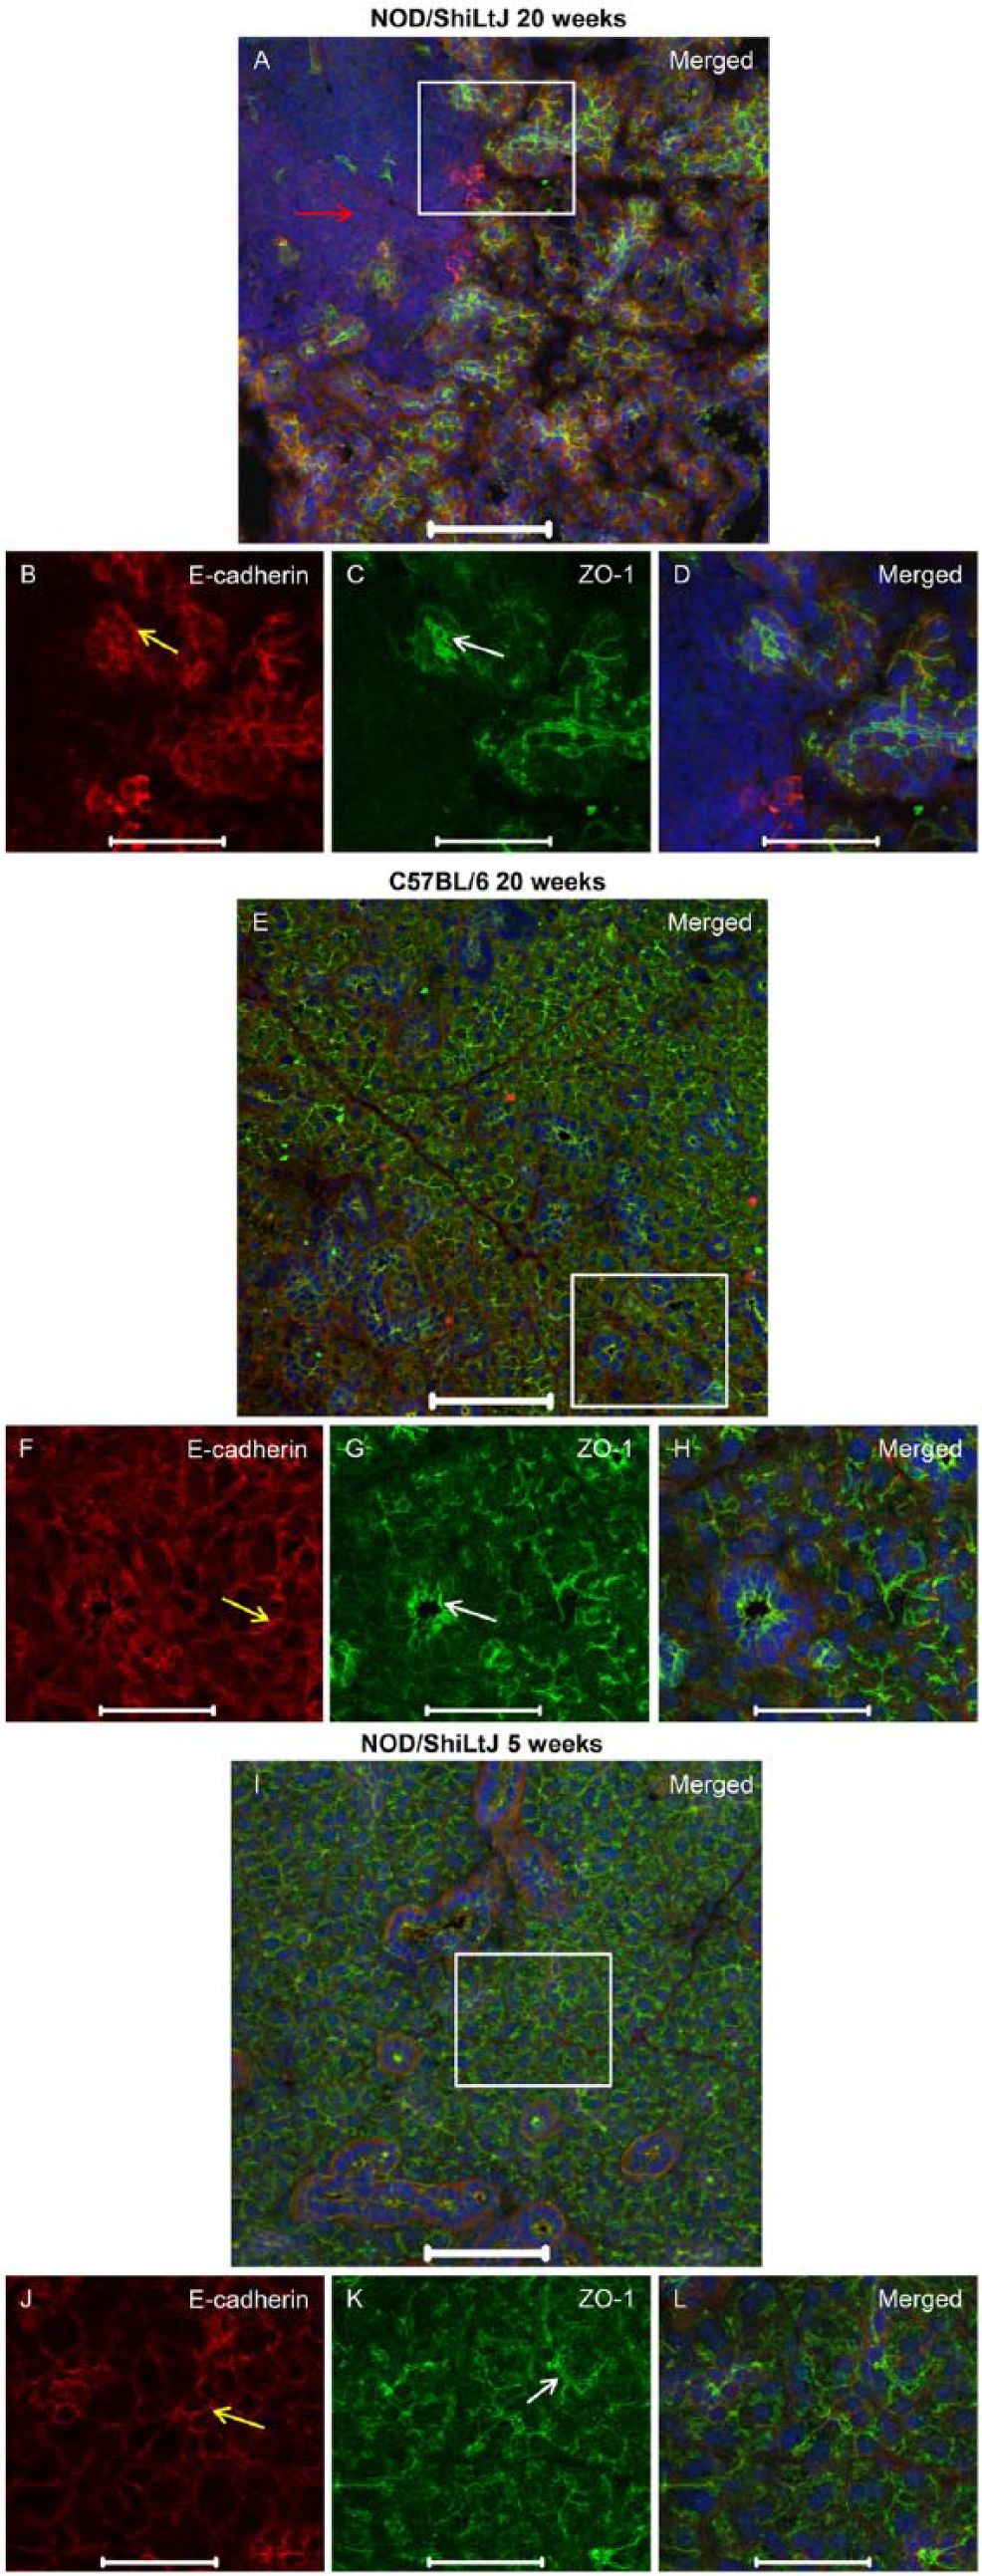
ZO-1 organization remains intact in areas adjacent to lymphocytic infiltration in NOD/ShiLtJ mouse submandibular glands. Submandibular glands from NOD/ShiLtJ and C57BL/6 mice were frozen and fixed as described in the Materials & Methods. Localization of ZO-1 was determined using immunofluorescence, as follows: rabbit anti-ZO-1 (green; A, C–E, G–I, K, L), mouse anti-E-cadherin (red; A, B, D–F, H–J, L) and propidium iodide nucleic acid stain (blue; A, D, E, H, I, L). The red arrow in (A) indicates an area of lymphocytic infiltration in the NOD/ShiLtJ mice where protein expression is absent. White and yellow arrows indicate areas where ZO-1 and E-cadherin (respectively) are expressed and organized. Images are maximum intensity projections of z-stacks. White boxes in (A), (E) and (I) are enlarged in the images beneath. Scale (A, E, I), 100 μm; (B-D, F–H, J–L), 50 μm.
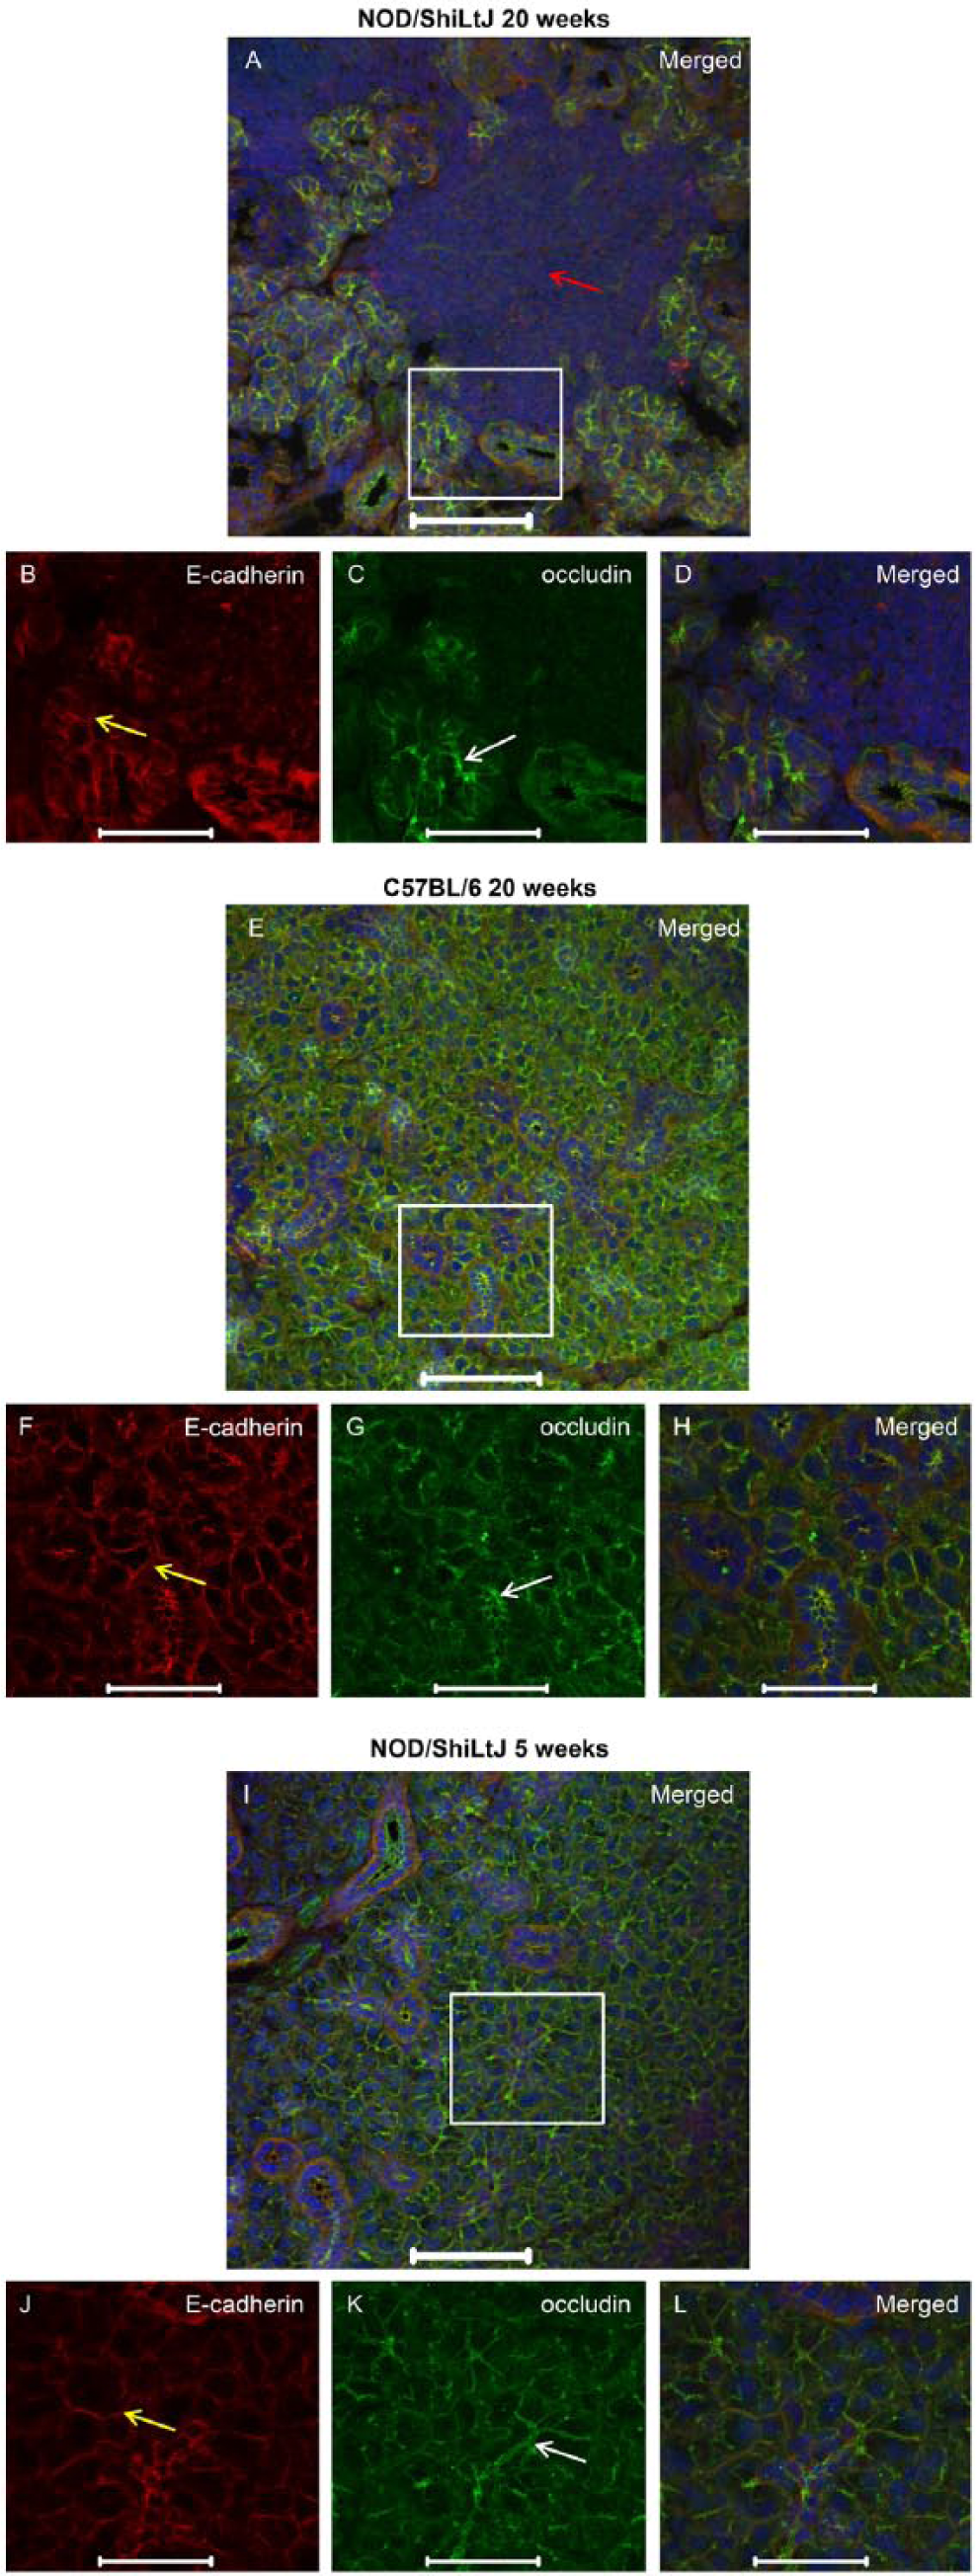
Occludin organization remains intact in areas adjacent to lymphocytic infiltration in NOD/ShiLtJ mouse submandibular glands. Submandibular glands from NOD/ShiLtJ and C57BL/6 mice were frozen and fixed as described in the Materials & Methods. Localization of occludin was determined using immunofluorescence, as follows: rabbit anti-occludin (green; A, C–E, G–I, K, L), mouse anti-E-cadherin (red; A, B, D–F, H, I, J, L) and propidium iodide nucleic acid stain (blue; A, D, E, H, I, L). The red arrow in (A) indicates an area of lymphocytic infiltration in the NOD/ShiLtJ mice where protein expression is absent. White and yellow arrows indicate areas where occludin and E-cadherin (respectively) are expressed and organized. Images are maximum intensity projections of z-stacks. White boxes in (A), (E) and (I) are enlarged in the images beneath. Scale (A, E, I), 100 μm; (B–D, F–H, J–L), 50 μm.
To verify whether similar changes occur in humans, we studied hMSG with and without SS. As shown in Figures 3 and 4, hMSG with SS displayed an absence of ZO-1 (Fig. 3A, 3C, 3D; red arrow), occludin (Fig. 4A, 4C, 4D; red arrow) and E-cadherin (Fig. 3A, 3B, 3D as well as Figs. 4A, 4B, 4D; yellow arrows) organization in the areas within lymphocytic infiltration. In contrast, areas proximal and distal to the lymphocytic infiltration showed apical ZO-1 (Fig. 3E, 3G, 3H; white arrows), apical occludin (Fig. 4E, 4G, 4H; white arrows) and basolateral E-cadherin (Fig. 3E, 3F, 3H and 4E, 4F, 4H; yellow arrows). It is important to mention that the representative area in the sections of hMSG with SS (Fig. 3A white boxed area and Fig. 3B–3D) show a discontinuous punctate ZO-1 staining pattern. In contrast, in the representative area in hMSG without SS (Fig. 3E white boxed area and Fig. 3F–3H), ZO-1 is organized and continuous to the apical borders. It is less common to observe a continuous ZO-1 staining pattern in hMSG with SS (Supplemental Fig. 4A, yellow box, 4C, 4D, white arrows) or a discontinuous punctate staining pattern in hMSG without SS (Supplemental Fig. 4E, yellow box, 4G, 4H, white arrows). In contrast, we did not see a discontinuous pattern in hMSG without SS (Fig. 4C) but saw both a continuous and punctate pattern in hMSG with SS (Fig. 4A, Supplemental Fig. 5A, yellow box, 5C, 5D, white arrows).
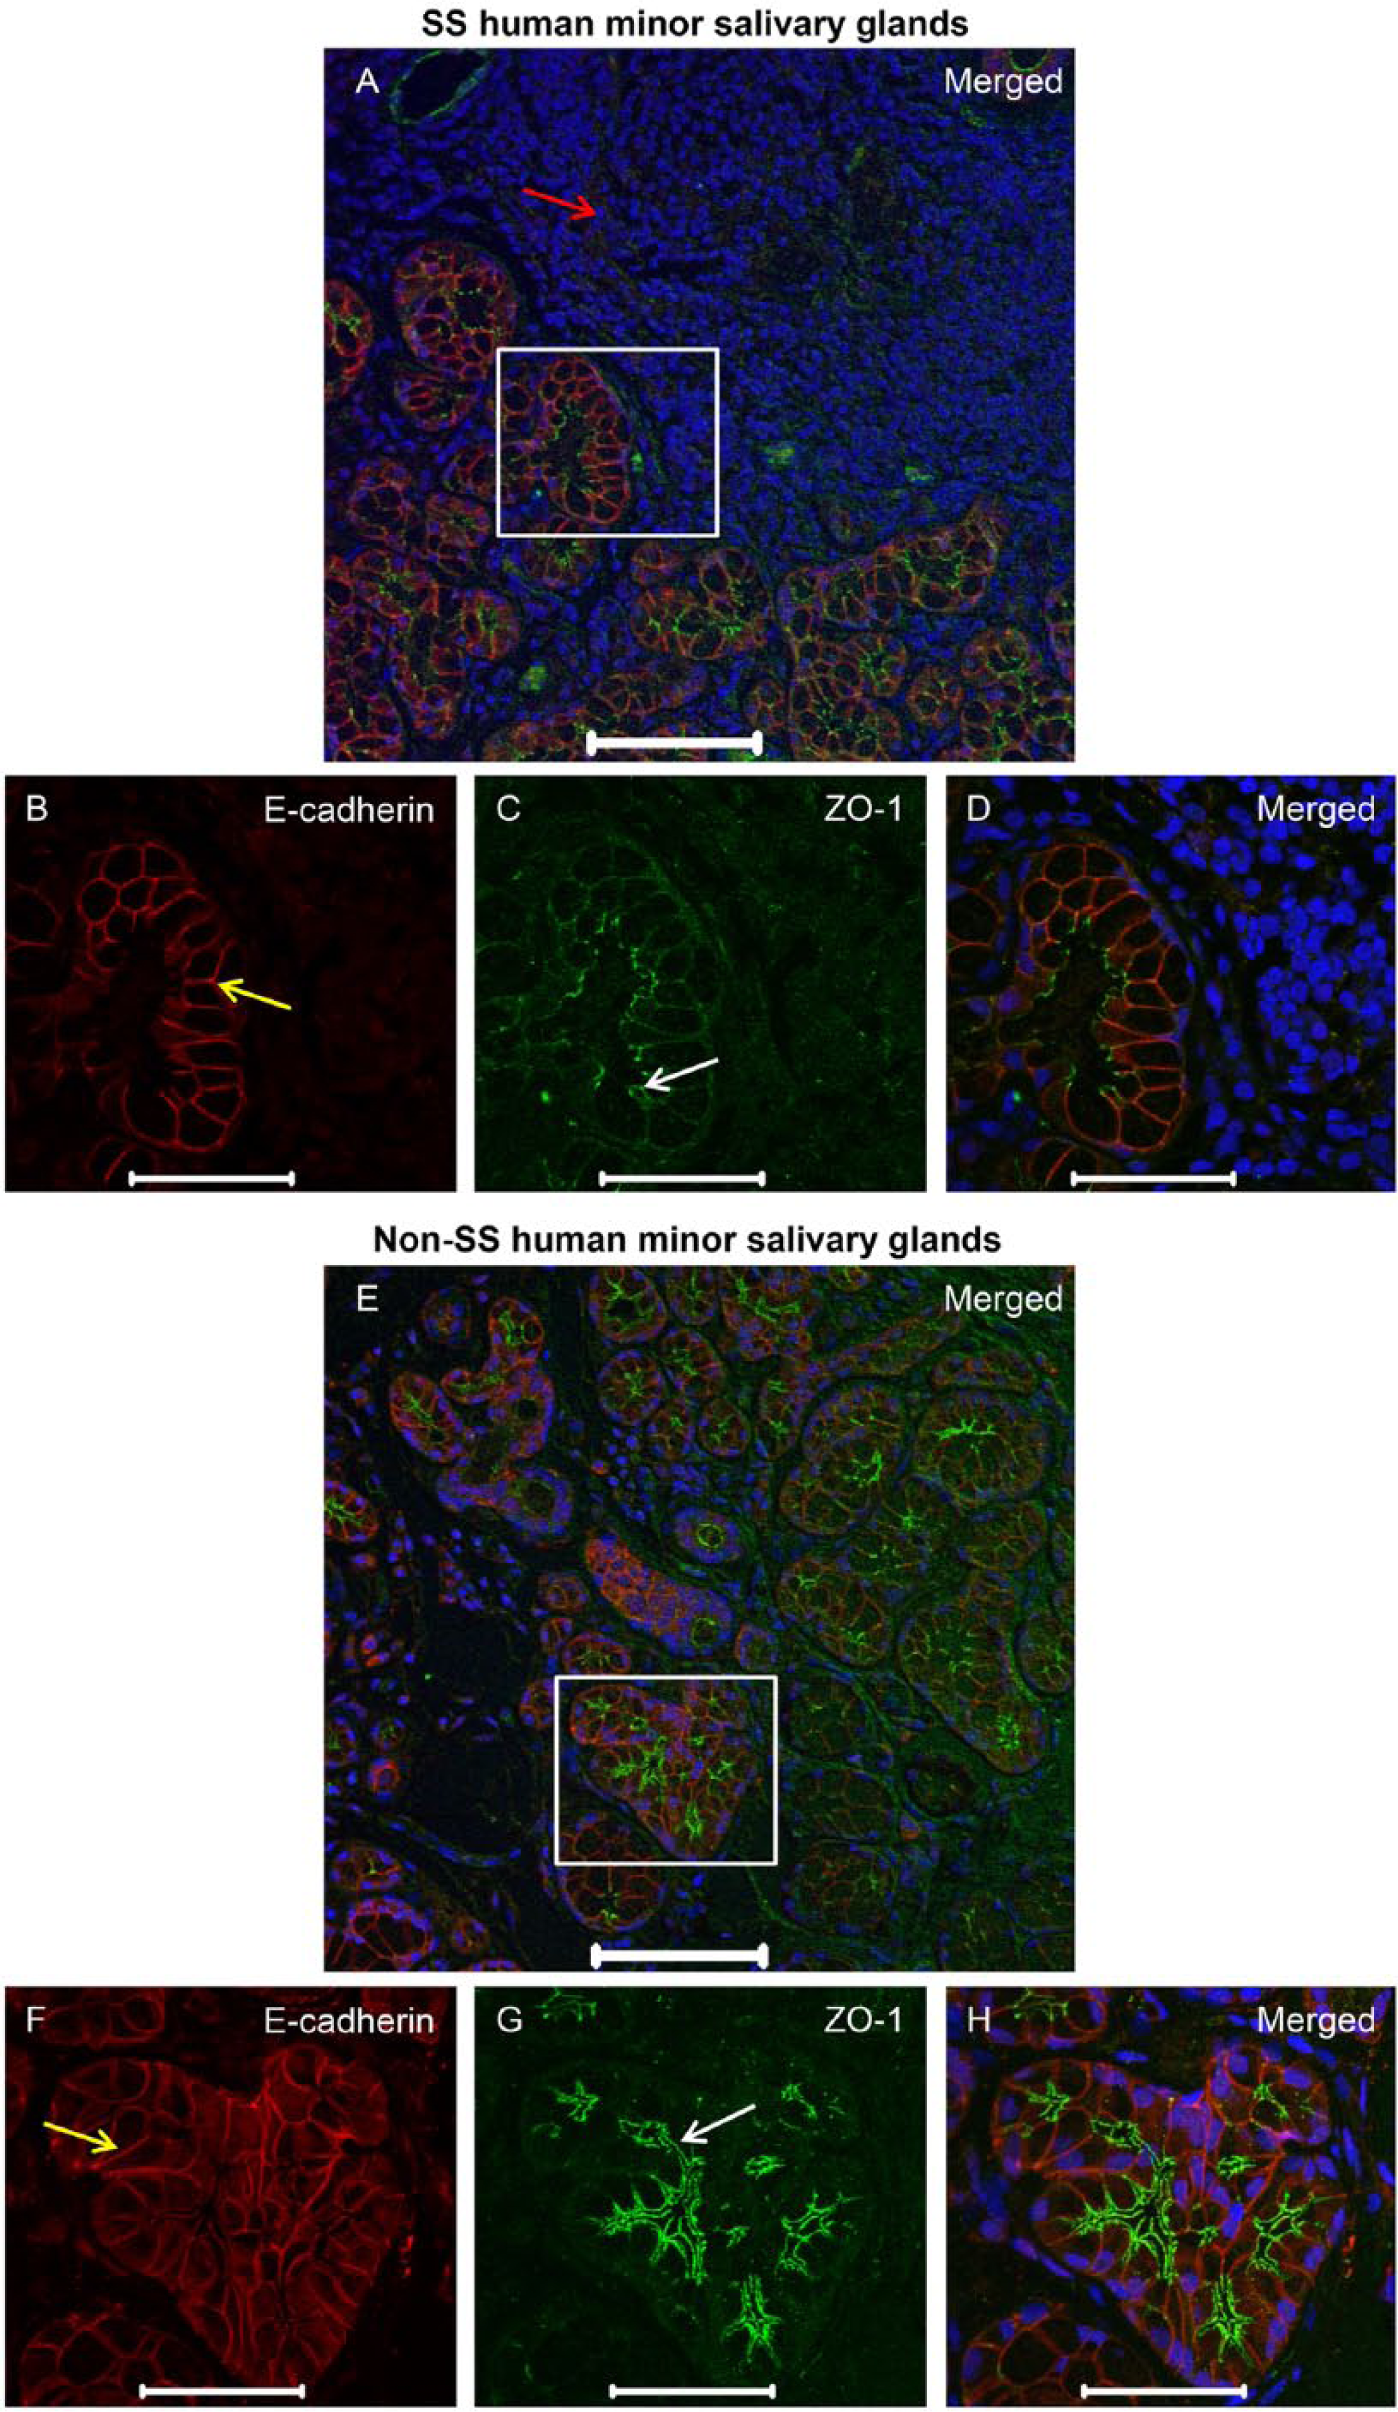
ZO-1 organization remains intact in areas adjacent to lymphocytic infiltration in human minor salivary glands (hMSG) from patients with Sjögren’s syndrome (SS). Formalin-fixed, paraffin-embedded hMSG sections were fixed as described in the Materials & Methods. Expression of ZO-1 was detected using immunofluorescence, as follows: rabbit-anti-ZO-1 (green; A, C–E, G, H); mouse-anti-E-cadherin (red; A, B, D–F, H) and propidium iodide nucleic acid stain (blue; A, D, E, H). Red arrow in (A) indicates areas of lymphocytic infiltration where protein expression is absent. White and yellow arrows indicate areas where ZO-1 and E-cadherin (respectively) are expressed and organized. Images are maximum intensity projections of z-stacks. White boxes in (A) and (E) are enlarged in the images beneath. Scale (A, E), 100 μm; (B–D, F–H), 50 μm.
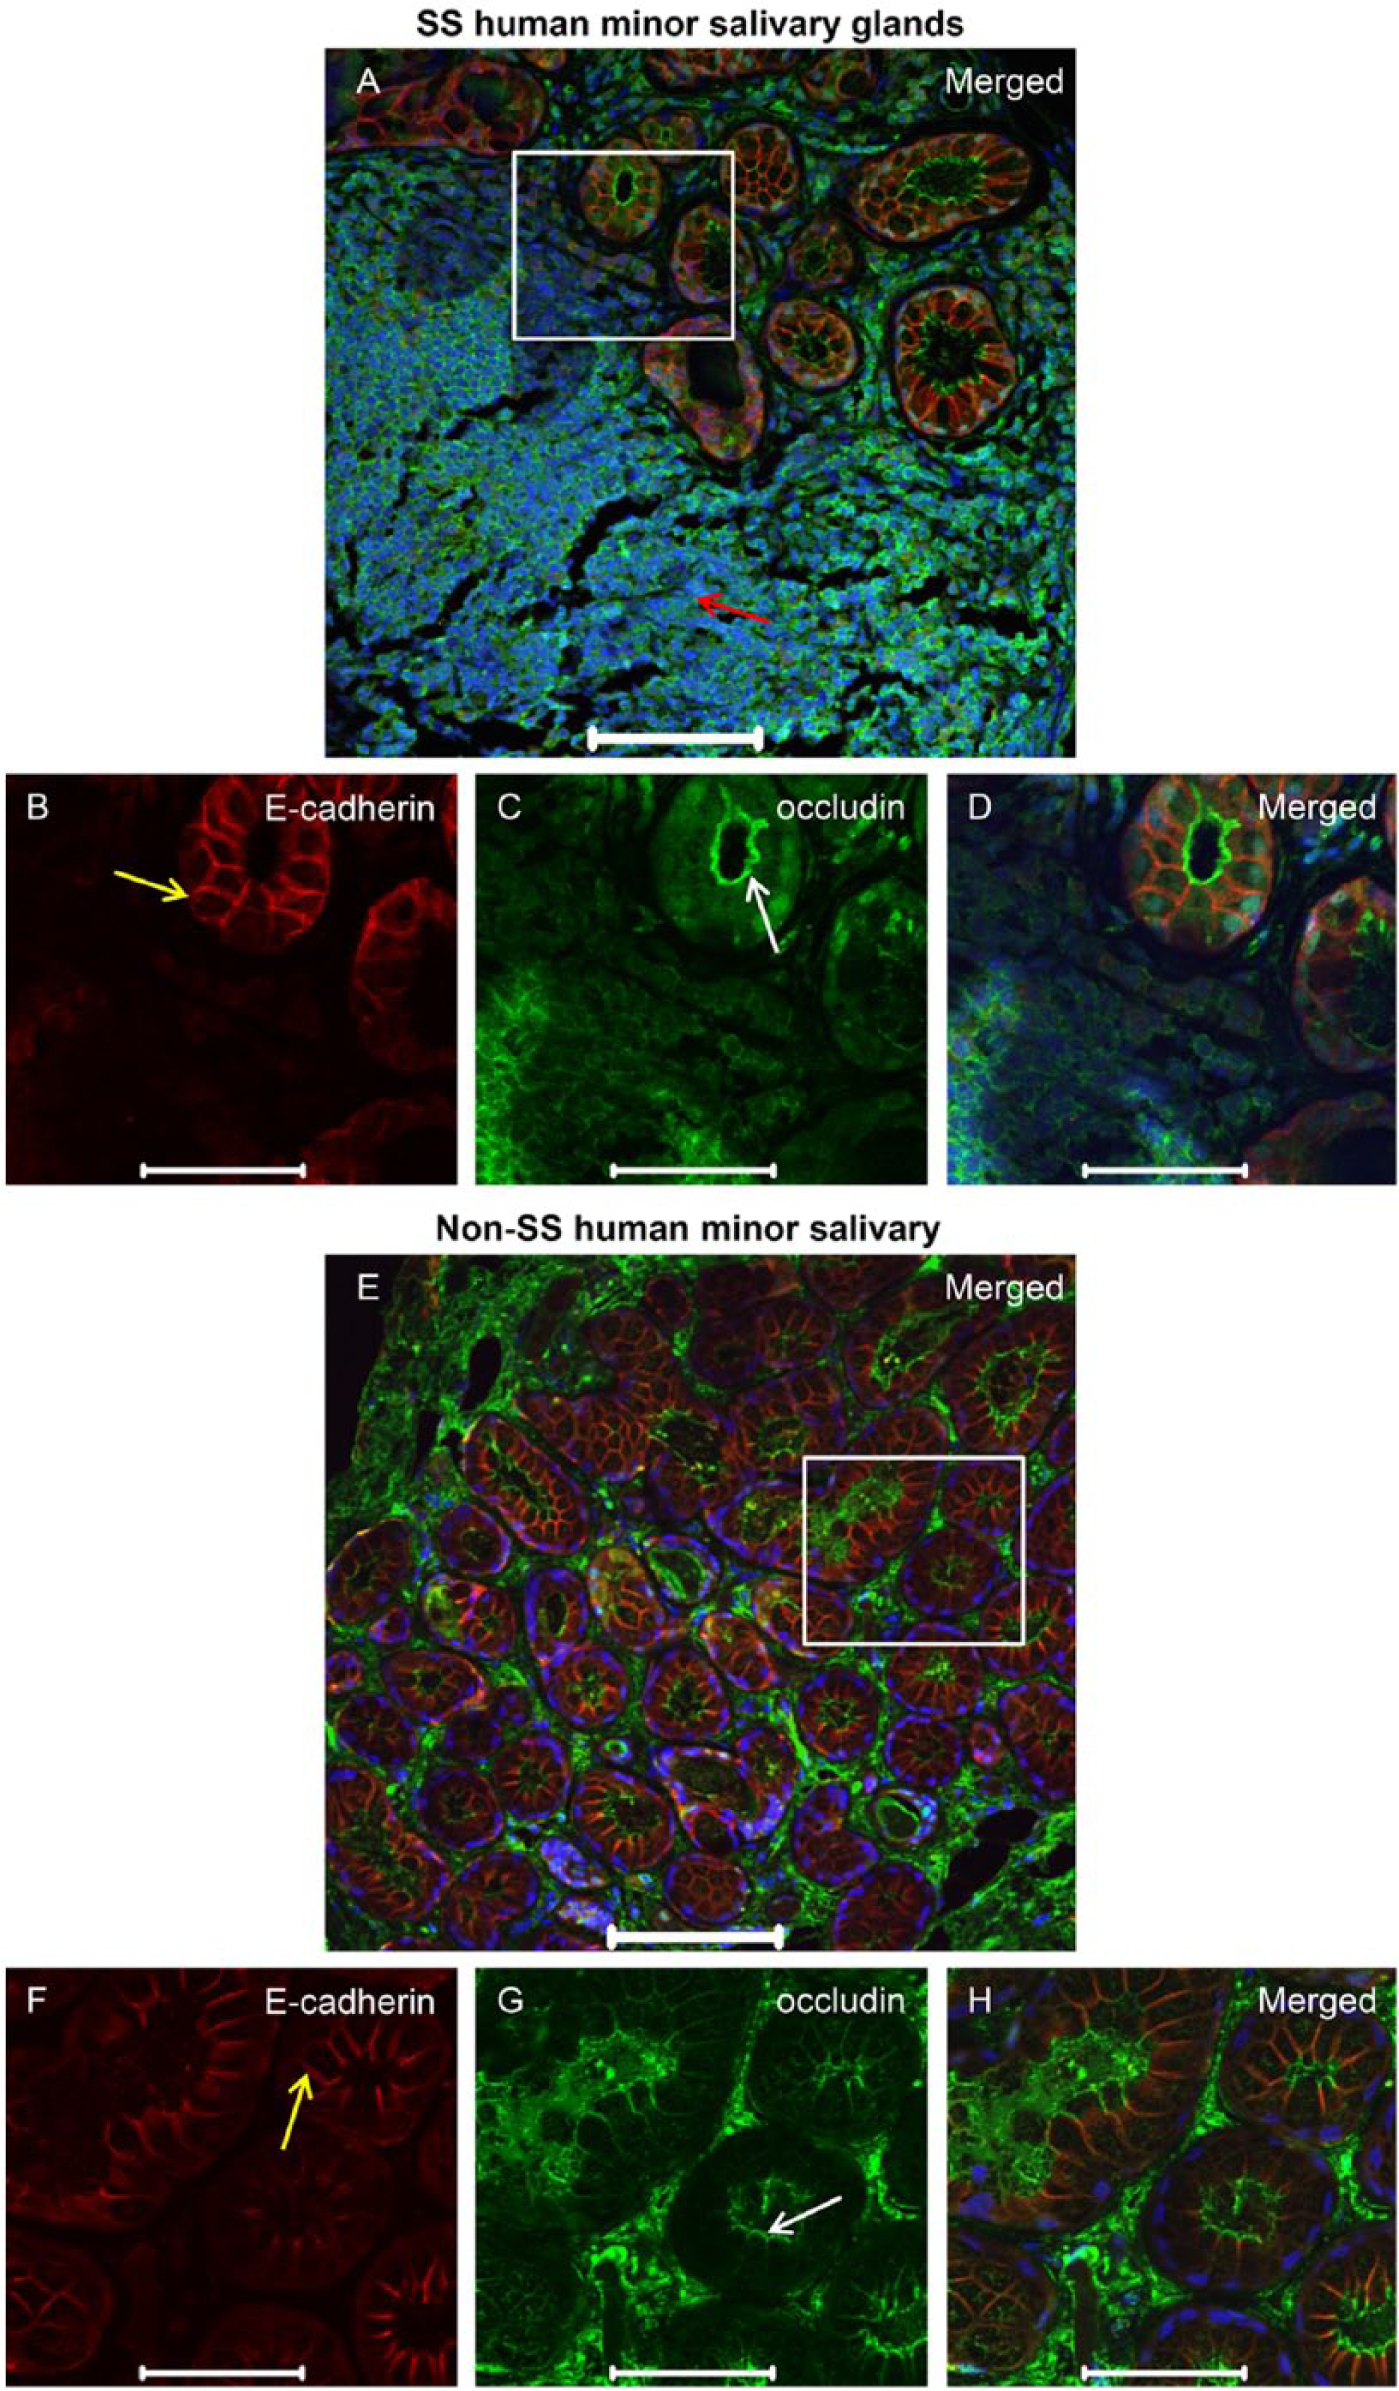
Occludin organization remains intact in areas adjacent to lymphocytic infiltration in human minor salivary glands (hMSG) from patients with Sjögren’s syndrome (SS). Formalin-fixed paraffin-embedded hMSG sections were fixed as described in the Materials & Methods. Expression of occludin was detected using immunofluorescence, as follows: rabbit-anti-occludin (green; A, C–E, G, H); mouse-anti-E-cadherin (red; A, B, D–F, H) and propidium iodide nucleic acid stain (blue; A, D, E, H). Red arrow in (A) indicates areas of lymphocytic infiltration where protein expression is absent. White and yellow arrows indicate areas where occludin and E-cadherin (respectively) are expressed and organized. Images are maximum intensity projections of z-stacks. White boxes in (A) and (E) are enlarged in the images beneath. Scale (A, E), 100 μm; (B–D, F–H), 50 μm.
TJ Gene Expression Studies in NOD/ShiLtJ mSMG
To determine TJ gene expression in 20-week-old NOD/ShiLtJ and age-matched C57BL/6 mice, we used the TJ RT2 Profiler PCR Array and generated a scatter plot report (Fig. 5A). Our results indicate several noteworthy genes based on a 2-fold difference in expression between the NOD/ShiLtJ and the C57BL/6 mSMG samples at 20 weeks of age. Of the 84 TJ-related genes in the array (Supplemental Table 1), claudin-12, membrane protein palmitoylated 5, occludin and Rhoa, were the only genes that displayed a significant up-regulation in NOD/ShiLtJ at 20 weeks of age as compared with the age-matched C57BL/6. We did not observe a significant down-regulation in any TJ genes (Fig. 5A and 5B) and the remaining genes were unchanged. Significant changes (shown in red) were determined using a t-test.
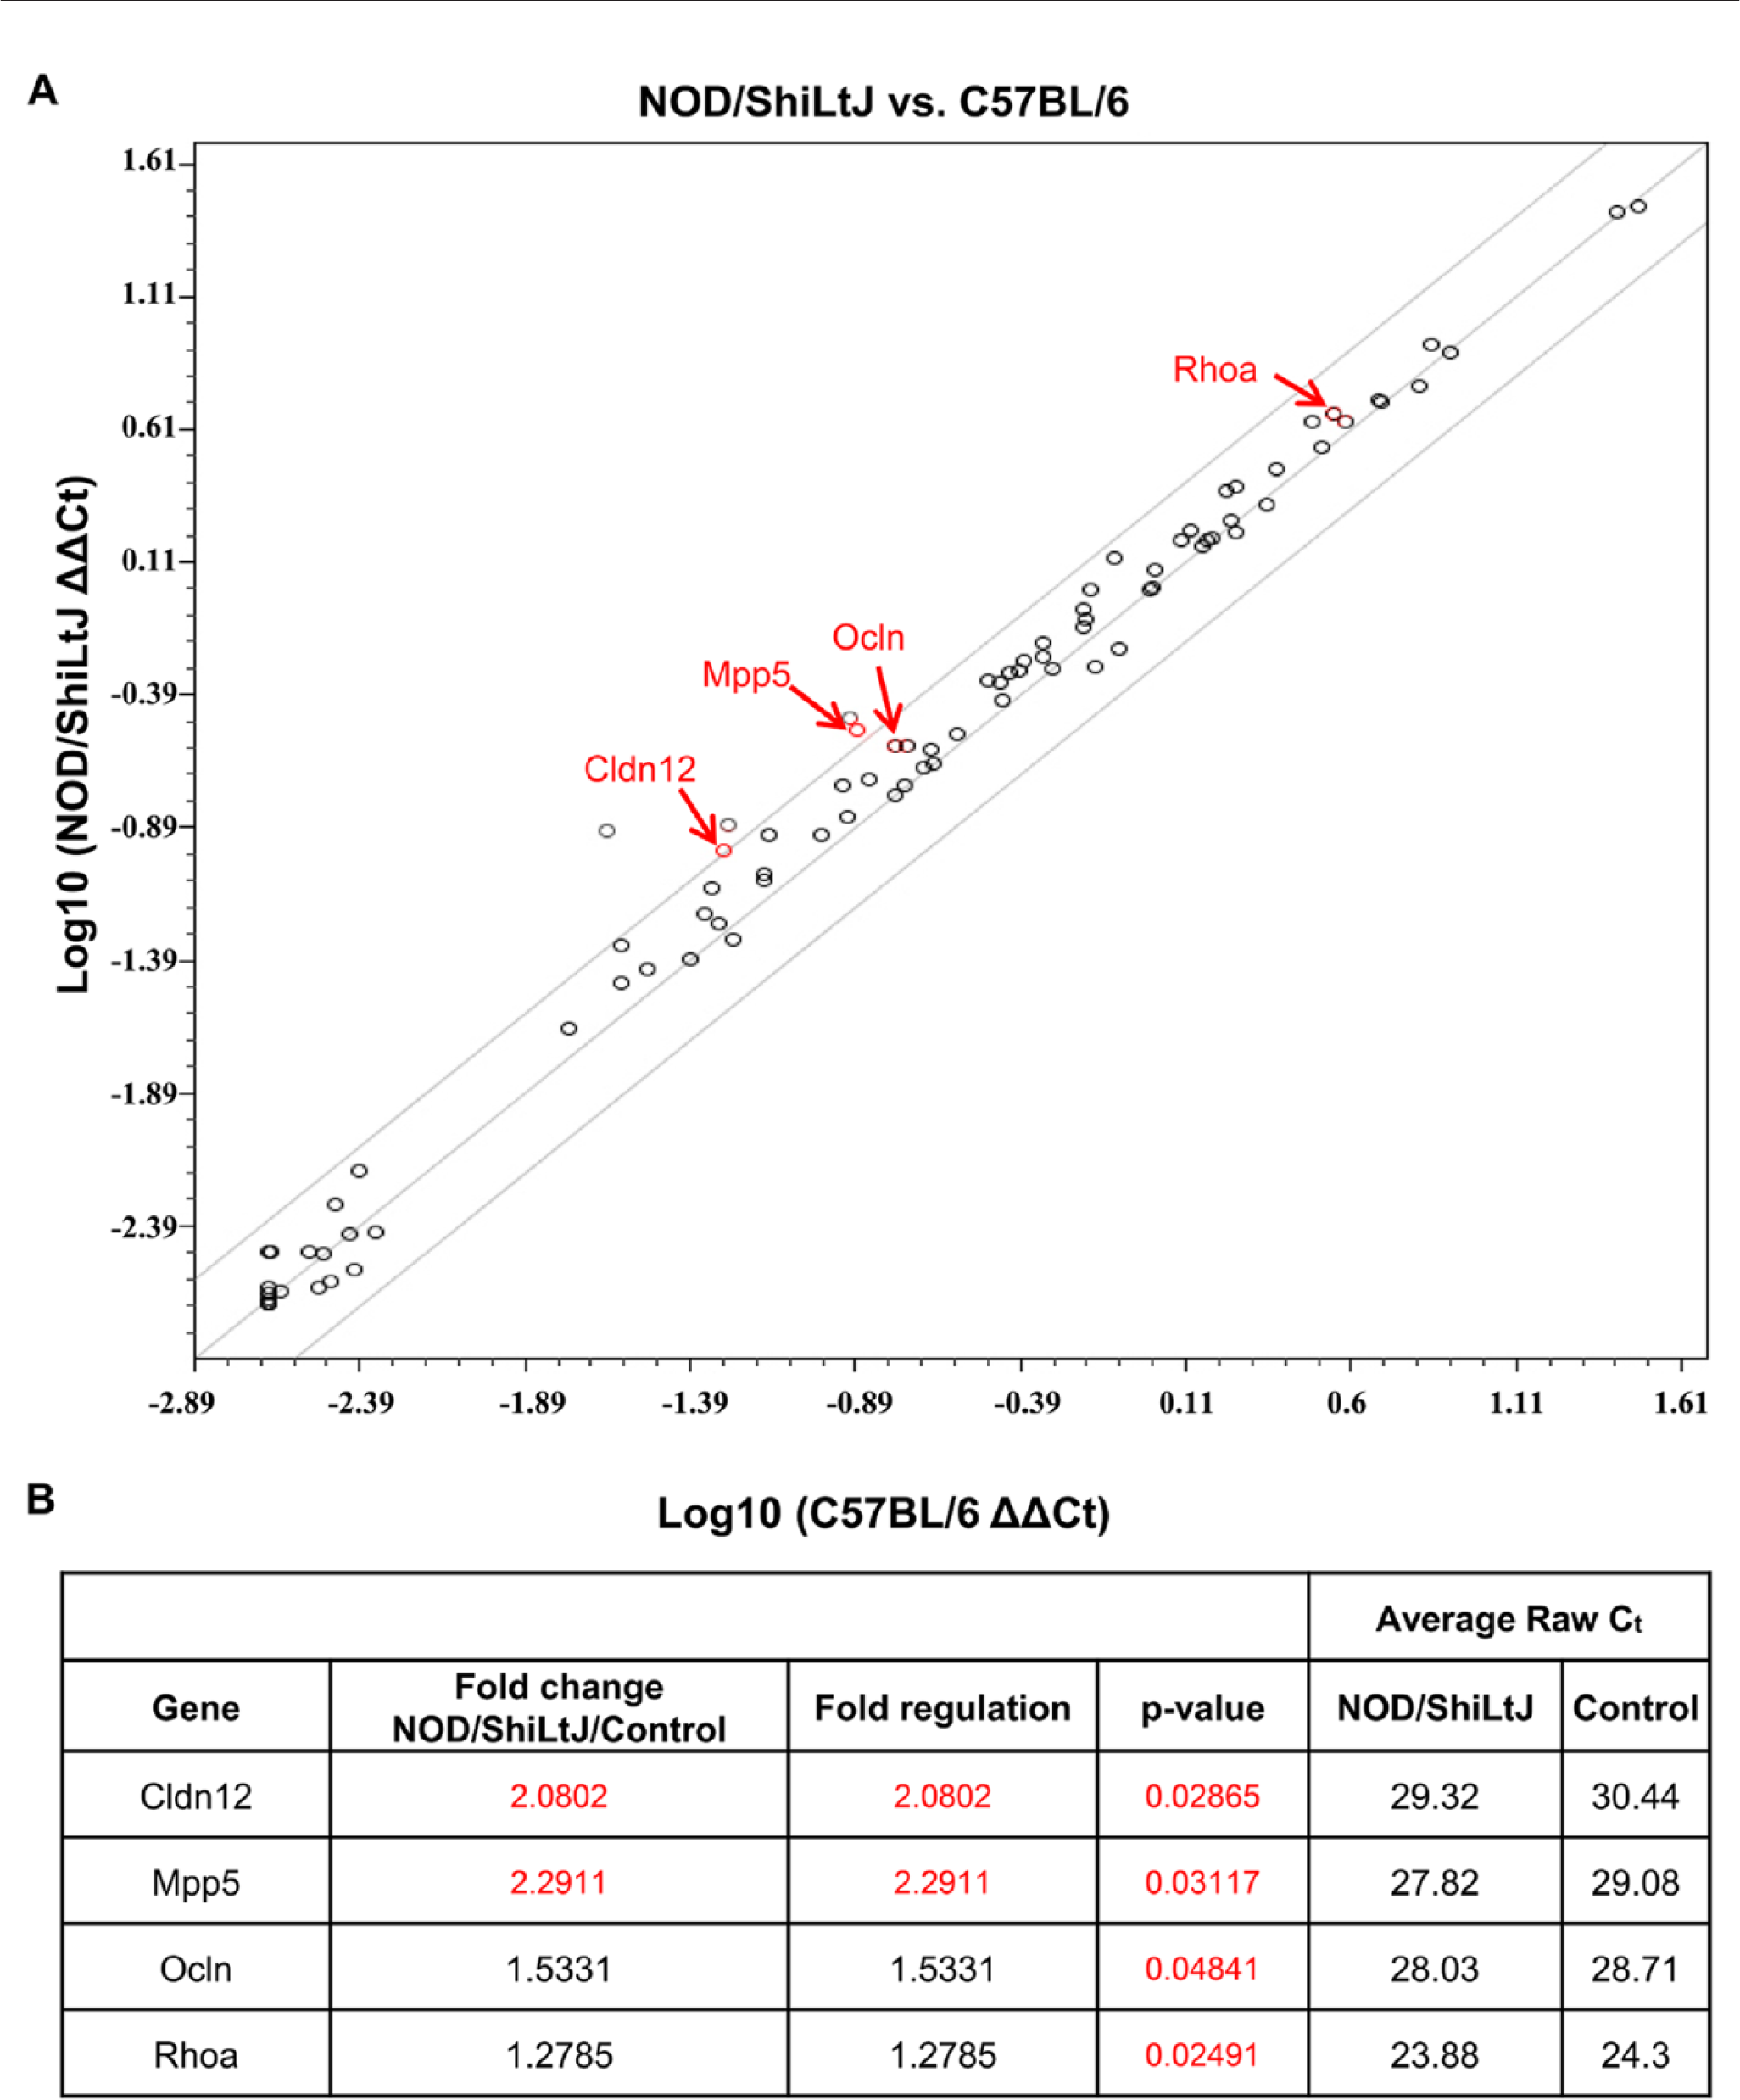
Tight junction (TJ) genes are unchanged or up-regulated in NOD/ShiLtJ mouse submandibular gland (mSMG). Total RNA was extracted from frozen C57BL/6 and NOD/ShiLtJ mSMG as described in the Materials & Methods. Detection and quantification of mouse TJ gene expression was performed using an RT2 Profiler mouse TJ kit. (A) Positions of several noteworthy genes based on a 2-fold difference in expression between the NOD/ShiLtJ and C57BL/6 mSMG samples are shown. Significance indicated by red text. (B) Changes in expression for TJ-related genes between NOD/ShiLtJ and C57BL/6 mSMG at 20 weeks of age. Claudin-12 (Cldn 12), membrane protein palmitoylated 5 (Mpp5), occludin (Ocln), and Ras homology gene family, member A (Rhoa) displayed a significant fold-change in NOD/ShiLtJ at 20 weeks as compared with the control strain C57BL/6 at 20 weeks. Significance indicated by red text.
ZO-1, Occludin, Claudin-12 and E-cadherin Expression Studies in NOD/ShiLtJ mSMG
We investigated whether gene expression studies correlated with changes in protein expression levels. We selected occludin and claudin-12 given their observed gene upregulation (Fig. 5). ZO-1 was chosen because it links occludin to the cytoskeleton and E-cadherin was chosen as a basolateral marker. As shown in Fig. 6A–6D, mSMG from NOD/ShiLtJ at 5 and 20 weeks of age showed no significant changes in ZO-1, occludin, claudin-12 or E-cadherin protein expression.
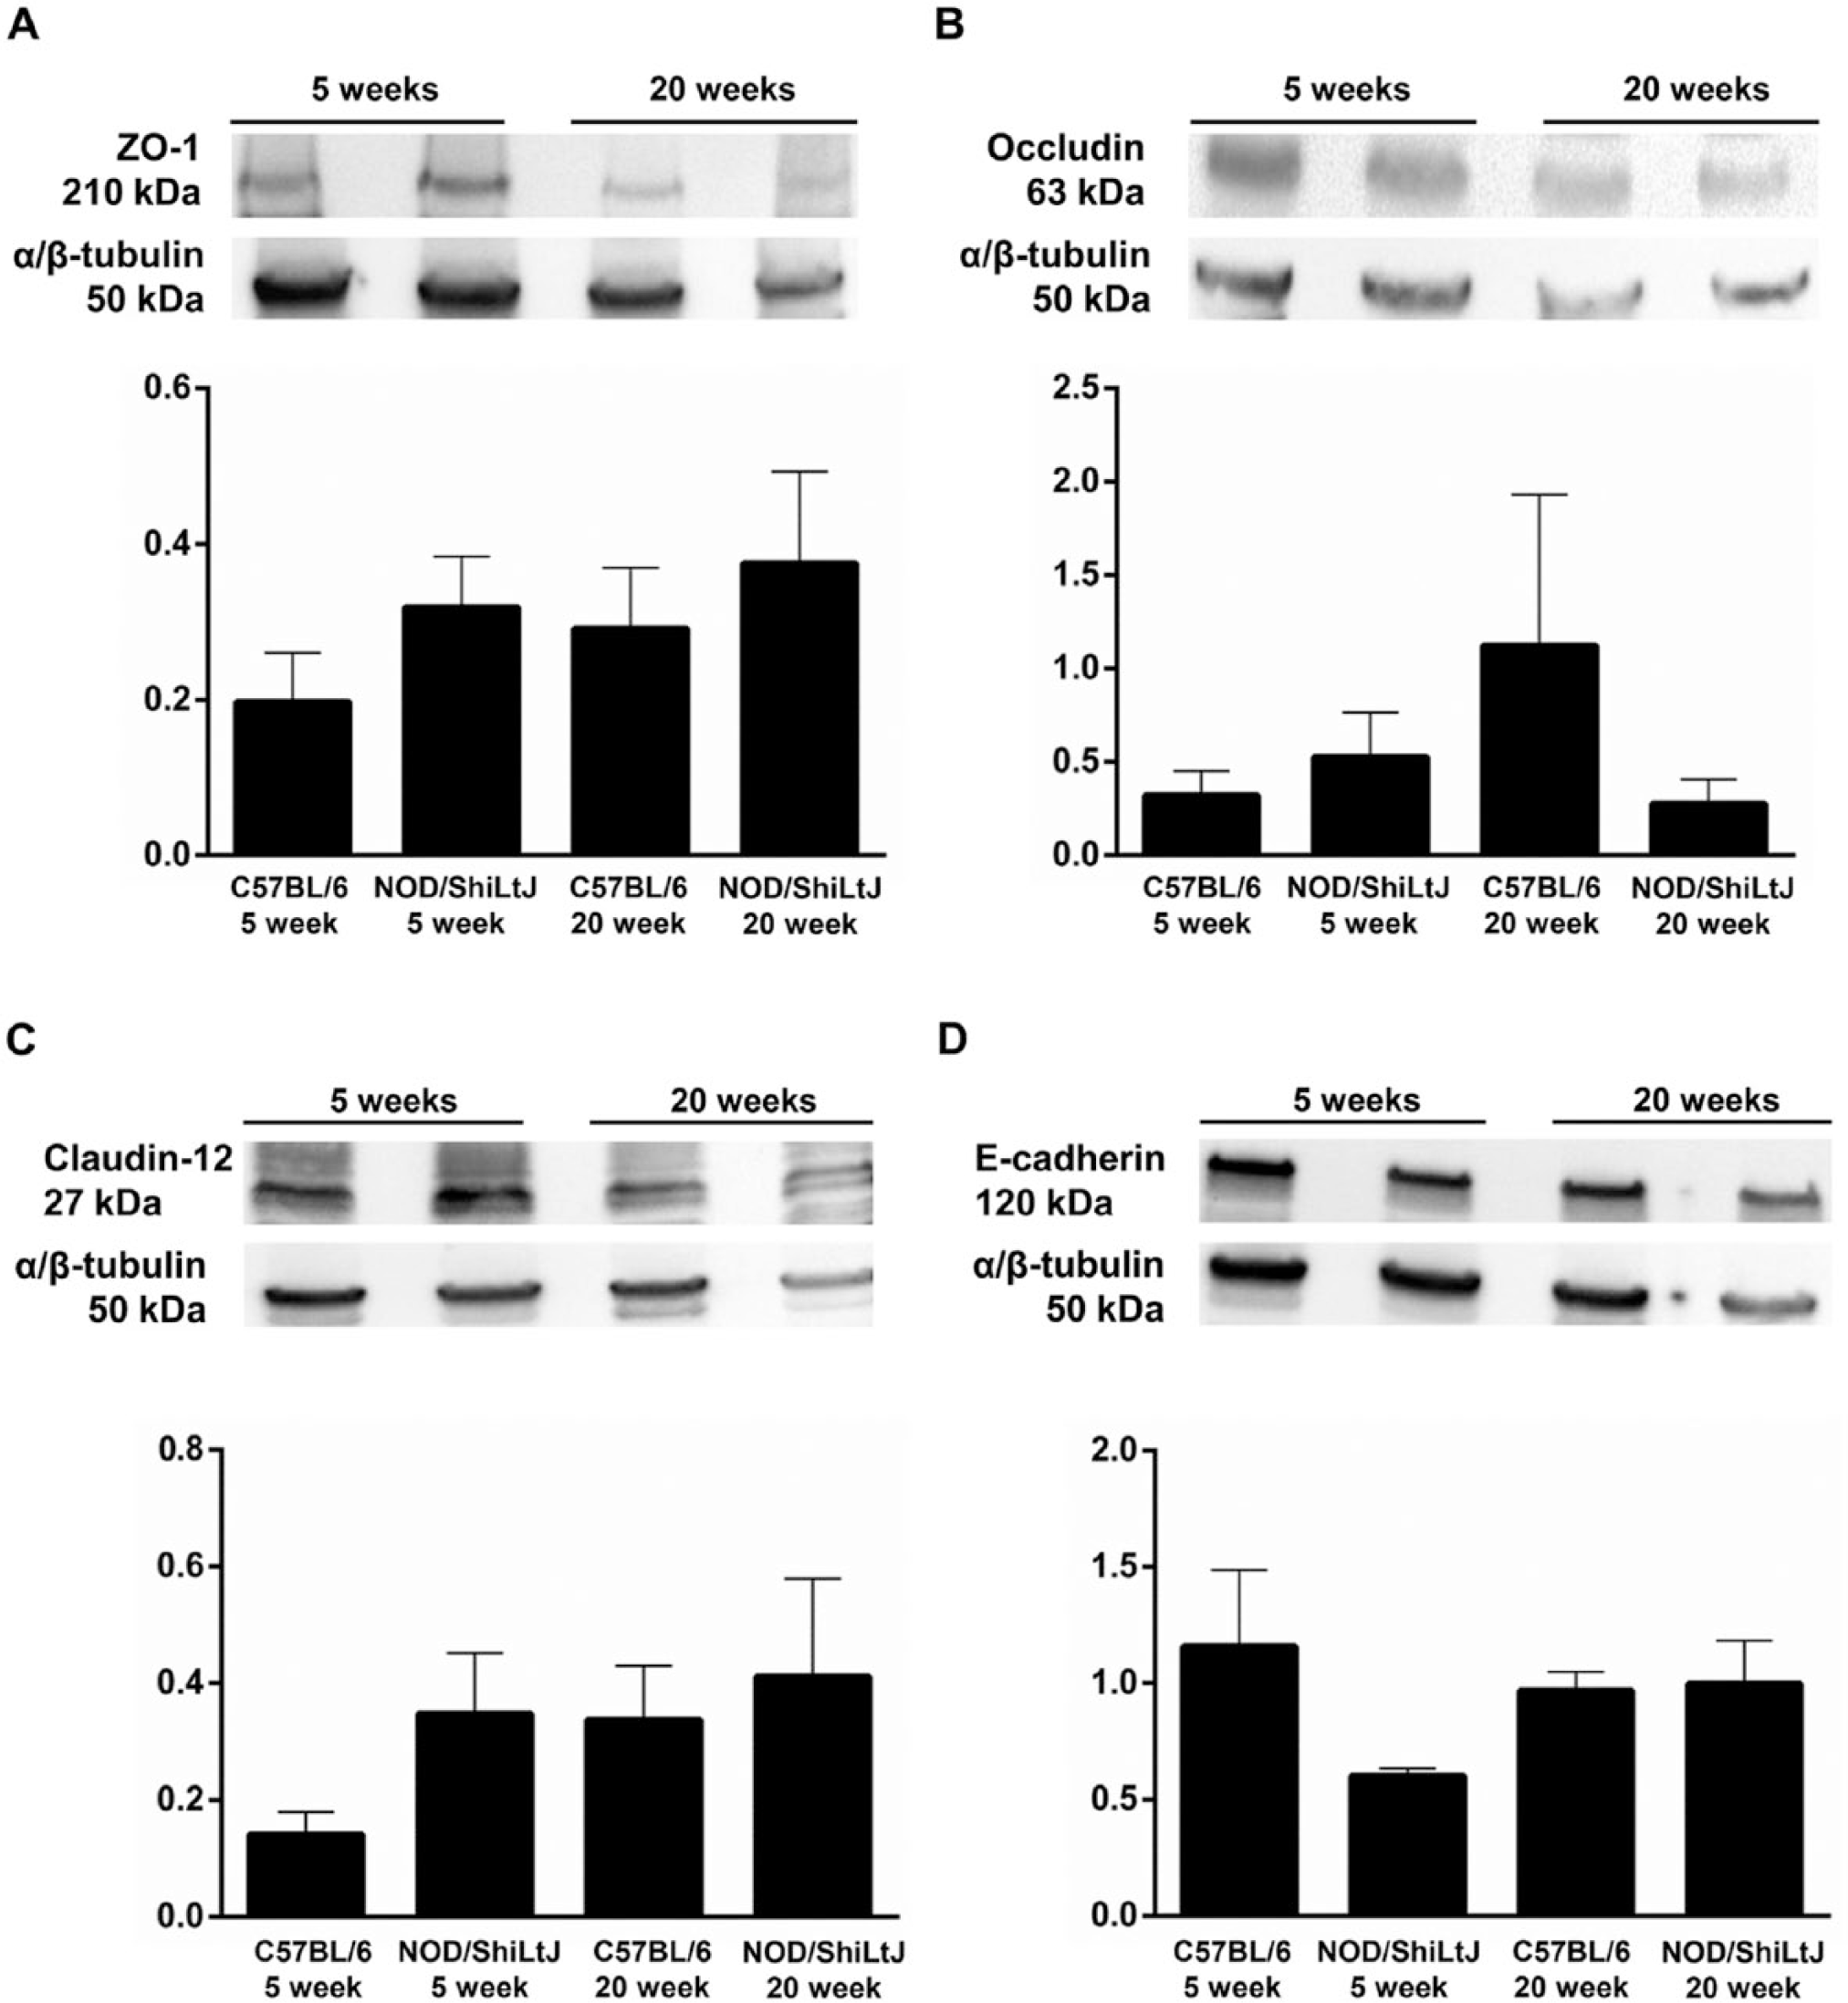
Tight junction protein expression is unaltered in NOD/ShiLtJ mouse submandibular glands (mSMG). Frozen mSMGs were lysed with 2× Laemmli buffer and the expression of (A) ZO-1, (B) occludin, (C) Claudin-12, and (D) E-cadherin were detected by western blot analysis and normalized against α/β-tubulin expression, as described in the Materials & Methods. Data represent the mean ± SEM of the results from five experiments where p < 0.05 represented significant differences between experimental groups. Results from a representative experiment are shown.
Discussion
In hMSG with SS, lymphocytes take over the functional epithelium, and this coincides with decreased exocrine secretion and consequential dry mouth (Mavragani and Moutsopoulos 2010). Lymphocytic infiltration has been seen in several pathological conditions including breast cancer, thyroid disease and inflammatory bowel disease (Ohashi et al. 1992; Suidan et al. 2008). We believe that interactions between lymphocytes and salivary epithelium could potentially contribute to the loss of glandular tissue (e.g., by upregulation of inflammatory cytokines (Baker et al. 2008)) and might have an impact on epithelial integrity.
We investigated the organization of the apical proteins ZO-1 and occludin. ZO-1 is one of three zonula occludens proteins belonging to a family of multi-domain proteins known as the membrane-associated guanylate kinase homologs (MAGUKs) (Fanning et al. 1998). Previous studies have shown MAGUKs are not only essential structural proteins at the site of tight and gap junctions but also function in signal transduction pathways related to gene expression and cell behavior (Bauer et al. 2010). ZO-1 is found in acinar and ductal cells of salivary epithelium (Maria et al. 2008) and is critical for claudin polymerization (Umeda et al. 2006). We were able to demonstrate that ZO-1 protein expression levels are unaltered in NOD/ShiLtJ mice as compared with control mice (Fig. 6A). Additionally, ZO-1 organization remains intact in areas proximal and distal to the lymphocytic infiltration observed in salivary glands from NOD/ShiLtJ mice and humans with SS (Figs. 1 and 3).
Occludin is a transmembrane protein that forms part of the TJ and contributes to barrier function and the formation of aqueous pores within TJ strands (Furuse et al. 1993; Tsukita et al. 2001). Previous studies using a polarized rat parotid gland epithelial cell line have shown that the functional role of occludin in salivary epithelium is a critical component in TJ organization (Li and Mrsny 2000). Additionally, it may control phenotypic changes associated with epithelium oncogenesis (Li and Mrsny 2000). We observed that occludin gene expression is up-regulated in NOD/ShiLtJ mice at 20 weeks of age as compared with control animals (Fig. 5). However, occludin protein expression levels are unaltered in NOD/ShiLtJ mice at 20 weeks of age (Fig. 6B). We believe these results could be attributed to changes in occludin translational or post-translational modifications (i.e., ubiquitination). Similar to ZO-1, we observed that occludin organization remains intact in areas proximal and distal to the lymphocytic infiltration in salivary glands from NOD/ShiLtJ mice and humans with SS (Figs. 2 and 4).
The findings observed in the SMG from NOD/ShiLtJ mice (when compared with controls) indicate that there are no visible alterations to TJ protein expression and organization except for areas of lymphocytic infiltration. Our results in hMSGs (Figs. 3 and 4) are consistent with a previous study showing that ZO-1 and occludin expression maintain their apical localization in hMSG with SS (Ewert et al. 2010). However, the previous studies indicated a decrease in staining for these proteins in hMSG with SS, whereas we did not see such differences. Our results show similar findings between SMG from mice as compared with hMSG.
The transmembrane adhesion molecule E-cadherin, which localizes basolaterally, has a pivotal role in epithelial cell behavior and tissue architecture (Knudsen et al. 1995; Lien et al. 2006; Tunggal et al. 2005). E-cadherin supports cell–cell adhesion and can affect a wide range of cellular functions, including activation of cell signaling pathways, regulation of the cytoskeleton and control of cell polarity (Larue et al. 1994; Tunggal et al. 2005). Recent work has shown that an absence of E-cadherin leads to improper localization of key TJ proteins, resulting in permeable TJ and altered epidermal resistance (Tunggal et al. 2005). We observed that E-cadherin protein expression levels are unaltered in NOD/ShiLtJ mice as compared with controls (Fig. 6D), and that E-cadherin organization remains intact in areas without lymphocytic infiltration in salivary glands from NOD/ShiLtJ mice (Figs. 1 and 2) and hMSG with SS (Figs. 3 and 4). Our results differ from previous studies, which found that E-cadherin organization was altered in SMG from NOD/ShiLtJ mice at embryonic stages and was lost in hMSG with SS (Enger et al. 2013). This difference observed in NOD/ShiLtJ mice could be due to the use of mSMG at embryonic versus post-natal stages (Enger et al. 2013). It is important to state that the presence of E-cadherin at the basolateral membranes is not always reflective of mature or stable adherens junctions (Van den Bossche et al. 2012). We have previously examined actin labeling in mSMG and hMSG with and without SS. However, we found no evident morphological differences between the two groups (Nelson et al. 2014). To determine if adherens junctions in SS tissues are functional, future studies should examine interactions between these complexes and the actin cytoskeleton.
In this study, we found that claudin-12 gene expression is upregulated in NOD/ShiLtJ mice at 20 weeks of age as compared with controls (Fig. 5). This outcome led us to investigate claudin-12 at the protein level. Our results indicate that claudin-12 protein levels are unaltered in SMG from these mice (Fig. 6C), similar to the results observed for occludin. Claudin-12 has not been previously studied in salivary glands; however, this protein is present in the inner ear and bladder epithelium, and it is over-expressed in colorectal carcinomas (Acharya et al. 2004; Grone et al. 2007). Additionally, claudin-12 is necessary for vitamin D-dependent Ca2+ absorption in intestinal epithelium (Fujita et al. 2008). Future functional studies will be necessary to understand the role of claudin-12 in salivary glands.
In summary, we have determined that ZO-1, occludin and E-cadherin remain intact in areas proximal and distal to lymphocytic infiltration in salivary glands with SS. Additionally, areas with lymphocytic infiltration show an absence of glandular tissue. Protein expression studies in mice show that ZO-1, occludin and E-cadherin expression levels are unaltered. Occludin and claudin-12 gene expression was up-regulated in NOD/ShiLtJ mice as compared with control animals, indicating that alteration of these proteins in SS occurs at the translational and post-translational levels. We found that mRNA levels did not all correlate with protein levels; this could be due to multiple factors, including, low protein expression levels, technological sensitivities, sample processing, or actual biological differences between transcript and protein abundance. The lack of correlation between mRNA and protein levels is a common problem and has been widely described in the literature (Greenbaum et al. 2003; Maier et al. 2009; Pascal et al. 2008; Vogel and Marcotte 2012). These studies are relevant to understanding the physical changes that occur during SS progression.
Although our results show intact acinar and ductal apicobasal polarity in hMSG with SS, it is still possible that ZO-1, occludin and E-cadherin function could be altered. There are several limitations of this study: (1) we did not investigate all claudin family members (which greatly contribute to barrier function); (2) we did not measure TJ protein–protein interactions in SS; and 3) we did not perform functional assays in vivo. Although these studies should be performed in the future, it will also be important to look at TJ function in normal salivary glands; specifically, examining TJ protein–protein interactions in acinar and ductal cells during saliva secretion (which are likely to be different from each other given the low water permeability in ducts as compared to acini).
Footnotes
Acknowledgements
The authors would like to acknowledge Dr. Alfredo Aguirre, Program Director Oral Pathology, Department of Oral Diagnostic Sciences, The State University of New York at Buffalo (UB), for grade and focus scoring of salivary glands and Dr. Wade J. Sigurdson, Director of the Confocal Microscopy and 3-Dimensional Imaging Core Facility of the School of Medicine and Biomedical Sciences, UB, for assistance in imaging and real-time PCR. Any underlying research materials related to this paper (i.e., samples or models) can be accessed.
Declaration of Conflicting Interests
The authors declared no potential conflicts of interest with respect to the research, authorship, and/or publication of this article.
Funding
The authors disclosed receipt of the following financial support for the research, authorship, and/or publication of this article: This work was supported by the
References
Supplementary Material
Please find the following supplemental material available below.
For Open Access articles published under a Creative Commons License, all supplemental material carries the same license as the article it is associated with.
For non-Open Access articles published, all supplemental material carries a non-exclusive license, and permission requests for re-use of supplemental material or any part of supplemental material shall be sent directly to the copyright owner as specified in the copyright notice associated with the article.