
Abstract
The DNA damage response (DDR) coordinates DNA repair with cell cycle checkpoints to ameliorate or mitigate the pathological effects of DNA damage. Automated quantitative analysis (AQUA) and Tissue Studio are commercial technologies that use digitized immunofluorescence microscopy images to quantify antigen expression in defined tissue compartments. Because DDR is commonly activated in cancer and may reflect genetic instability within the lesion, a method to quantify DDR in cancer offers potential diagnostic and/or prognostic value. In this study, both AQUA and Tissue Studio algorithms were used to quantify the DDR in radiation-damaged skin fibroblasts, melanoma cell lines, moles, and primary and metastatic melanomas. Digital image analysis results for three markers of DDR (γH2AX, P-ATM, P-Chk2) correlated with immunoblot data for irradiated fibroblasts, whereas only γH2AX and P-Chk2 correlated with immunoblot data in melanoma cell lines. Melanoma cell lines displayed substantial variation in γH2AX and P-Chk2 expression, and P-Chk2 expression was significantly correlated with radioresistance. Moles, primary melanomas, and melanoma metastases in brain, lung and liver displayed substantial variation in γH2AX expression, similar to that observed in melanoma cell lines. Automated digital analysis of immunofluorescent images stained for DDR biomarkers may be useful for predicting tumor response to radiation and chemotherapy.
Keywords
Introduction
The DNA damage response (DDR) is a complex but coordinated collection of biochemical reactions that serve to ameliorate or mitigate the effects of endogenous and induced DNA damage (Ciccia and Elledge 2010; Rimm 2006). Many biological functions are represented in the DDR, including DNA repair, cell cycle checkpoints, replication fork stabilization, transcriptional regulation, metabolism, and apoptosis. The DDR is activated not only in cancer, but also in pre-neoplastic lesions (Bartkova et al. 2005; Gorgoulis et al. 2005). These findings suggest that DNA damage occurs even in the early stages of carcinogenesis and that activation of the DDR may serve as a marker of developing or incipient genetic instability. DDR signaling has also been shown to be involved in oncogene-induced senescence (OIS), which is an important barrier to neoplastic progression (Halazonetis et al. 2008). Both DDR and OIS include induction of phospho-H2AX (γH2AX), a marker of DNA double-strand breaks and stalled DNA replication forks, as well as phosphorylation and activation of p53, ATM and Chk2 (Bartkova et al. 2006; Di Micco et al. 2006). Because the expression of DDR biomarkers may change during progression of benign precursors to malignancy (Gorgoulis et al. 2005; Gray-Schopfer et al. 2006; Michaloglou et al. 2005), it is important to determine the activation state of the DDR during different stages of malignant transformation. For example, whereas normal human melanocytes displayed low levels of expression of γH2AX, melanoma cell lines displayed significantly increased levels of this marker (Warters et al. 2005). These and other observations recently reported in the literature (Negrini et al. 2010) have generated considerable interest in the development of robust DDR biomarkers.
Although genomics studies have proven useful in dissecting the molecular complexities of cancer by providing unprecedented molecular resolution, cancer is ultimately a protein-level disease characterized by dysregulated intracellular signaling (Hanahan and Weinberg 2000; Liotta and Petricoin 2000; Weinstein 2002). Proteomics approaches, including 2-D electrophoresis/mass spectrometry and protein arrays, have been utilized to systematically profile signaling pathways in cancer (Petricoin et al. 2005; Petricoin et al. 2002). Yet, like microarray-based genomics, proteomics techniques require biomolecular analytes derived from tumor lysates. Thus, tumor morphology and the spatial relationships among different constituent cell types within individual tumors are destroyed using these approaches. Tumors are molecularly heterogeneous, and it is widely thought that this heterogeneity ultimately leads to post-therapy disease recurrence and patient mortality.
IHC is an established method for molecular classification of human breast cancer and stratification of patients to endocrine or biological therapies (Kumaki et al. 2011; Tang et al. 2008). Automated quantitative analysis (AQUA) (Histo Rx; Branford, CT) (Camp et al. 2002) and Tissue Studio (Definiens, Munich, Germany) are software programs designed for automated quantification of protein expression in histological sections. Both systems rely upon standard protocols for the detection of protein by immunofluorescence microscopy and new techniques in computer-assisted imaging technology to quantify protein expression in specific cells and sub-cellular compartments of interest. Furthermore, technical advances have made it possible to perform quantitative expression profiling in high-density tissue blocks (tissue microarrays [TMA]) constructed from hundreds of donor tissue blocks. Compared with traditional manual, pathologist-based, semi-quantitative (categorical) scoring of IHC staining, these digital analysis programs have improved reproducibility and sensitivity. For example, AQUA generates a near-continuous metric of protein expression (McCabe et al. 2005), has a greater dynamic range (4 logs) compared with manual IHC scoring (0.5 log) (Rimm 2006), and has been utilized for the discovery of novel tumor sub-classes (Berger et al. 2005; Camp et al. 2003) and clustering of tumors based upon protein expression profiles (Dolled-Filhart et al. 2006). Alternatively, Definiens software has the ability to analyze and export data for individual cells, which allows for distinguishing different cellular populations to address tumor heterogeneity. In addition, it has been used recently to determine the relative levels of nuclear (Varela et al. 2011) and cytoplasmic (Herrmann et al. 2012) protein markers in defined cellular populations and to assess the morphometric stromal features that are linked to breast cancer survival (Beck et al. 2011).
In this report, automated digital image analysis technology was used to quantify three biomarkers of the DDR in normal fibroblast and melanoma cell lines. The results show that in situ expression of DDR biomarkers in cell lines measured by both AQUA and Tissue Studio technologies correlate well with protein expression levels determined by immunoblot analyses and can be successfully applied to measure expression of DDR biomarkers in TMA. The results also reveal substantial variation in the expression of DDR biomarkers in melanoma cell lines and tumor samples. This variation may provide insight into both the biological defects in melanoma cells as well as provide information for therapeutic choices for melanoma treatment.
Materials & Methods
Human Samples
Formalin-fixed paraffin-embedded human tissues (moles and primary and malignant melanomas) used in this study were obtained from the UNC Hospitals surgical pathology archive under the guidelines of (and protocol approved by) the UNC Institutional Review Board 04-0986 and 08-0242.
Cell Culture
The human fibroblast line NHF1-hTERT—a cell line derived from normal neonatal foreskin fibroblasts (Boyer et al. 1991) and immortalized by ectopic expression of the catalytic subunit of telomerase (Heffernan et al. 2002)—was grown and treated with ionizing radiation (IR), as previously described (Heffernan et al. 2007). Melanocytes and melanoma cell lines were grown as previously described (Kaufmann et al. 2008; Sambade et al. 2011).
Antibodies
Rabbit polyclonal antibodies against ATM, H2AX, phospho-thr68-Chk2 (P-Chk2), rabbit monoclonal anti-γ-Tubulin, and mouse monoclonal anti-Chk2 were from Cell Signaling Technology (Danvers, MA). Rabbit monoclonal anti-phospho-ser198-ATM (P-ATM) was from Epitomics Inc. (Burlingame, CA) and mouse monoclonal anti-phospho-ser139-H2AX (γH2AX) from Millipore (Billerica, MA). Goat polyclonal anti-actin and anti-goat IgG were from Santa Cruz Biotechnology (Dallas, TX). Anti-rabbit and mouse IgGs were from Amersham Pharmacia Biotech (Piscataway, NJ). Rabbit polyclonal anti-phospho-ser15-p53 was from Abcam (Cambridge, MA). Polyclonal rabbit antibodies to cytokeratin (CK) and S100 were from DakoCytomation (Carpinteria, CA).
Immunoblots
Protein concentrations were determined using the Bio-Rad DC Protein Assay (Bio-Rad, Hercules, CA). Equal amounts of cell lysate were loaded onto polyacrylamide gels. Phospho-proteins were detected using rabbit monoclonal antibodies against P-ATM, P-Chk2 and mouse monoclonal γH2AX, as previously described (Kaufmann et al. 2008). Total protein was detected using rabbit polyclonal antibodies to ATM and H2AX and a mouse monoclonal antibody to Chk2. γ-Tubulin and actin were used as loading controls for melanoma cell lines. Proteins were detected with horseradish peroxidase-conjugated secondary antibodies using the Amersham ECL reagent (Amersham Pharmacia Biotech Inc.). Pixel intensities of target bands were determined using Image J (NIH, Bethesda, MD).
Cell Line Block Preparation and Construction of Cell Line Arrays
All cell lines were confirmed to be free of mycoplasma contamination using the GenProbeR kit (Gen-Probe Inc., San Diego, CA), according to the manufacturer’s protocol. Cell pellets were fixed in 10% buffered formalin for 16–24 hr, washed twice in 70% ethanol, clotted in 2% low-melting agarose (#BP-165-25, Fisher Scientific, Pittsburgh, PA), and processed and embedded in paraffin (#23-021-400, Fisher Scientific). Individual cell line blocks were sectioned and stained with hematoxylin and eosin (H&E) (Richard Allan Scientific, Kalamazoo, MI) to verify the quality of the prepared cell clots and guide Cell Line Array (CLA) construction. Three 1-mm diameter cores were removed from each donor cell line block and randomly embedded into recipient CLA blocks.
Tissue Selection and Tissue Microarray (TMA) Construction
Formalin-fixed paraffin-embedded tissues of moles (n=20), primary melanomas (n=19) and metastatic melanomas to brain (n=11), lung (n=6), and liver (n=3) were obtained from the UNC-CH pathology archives. A pathologist (P.G.) reviewed H&E-stained sections of moles and primary melanoma to confirm the diagnosis and adequacy of the specimens. H&E-stained slides of the selected metastatic melanoma cases were reviewed by a surgical pathologist (C.R.M.) and representative areas of tumor and adjacent normal tissues were circled for coring.
Two TMA blocks, containing triplicate cores (0.6 mm) of melanoma metastases or adjacent normal tissues, were constructed. Both contained triplicate 0.6-mm cores from one preparation of sham and ionizing radiation (IR)-treated NHF1-TERT cells to serve as internal calibrators for fluorescent immunohistochemistry (IF) quantification.
Five micron thick whole tissue sections (WTS) of primary melanoma and moles and CLA and TMA block sections were placed on positively charged glass slides. H&E-stained slides of melanoma and normal TMA were histopathology examined by light microscopy. TMA sections adjacent to the reviewed H&E slides were used for IF.
Fluorescent Immunohistochemistry
Single IF stains of CLA and sequential dual stains of TMA and WTS slides were carried out using a Bond fully-automated slide staining system (Leica Microsystems, Norwell, MA). Slides were deparaffinized in Bond dewax solution (AR9222) and hydrated in Bond wash solution (AR9590). Antigen retrieval for all antibodies was performed for 30 min at 100C in Bond epitope retrieval solution 1, pH 6.0 (AR9961). For single IF (CLA), after incubation with primary antibody (8 hr for P-Chk2, γH2AX and 1 hr for P-ATM), sections were incubated with an appropriate secondary antibody using the Bond polymer refine detection system (DS9800), followed with tyramide Cy5 amplification (PerkinElmer, Boston, MA). For sequential dual IF, TMA slides were first incubated with γH2AX followed by the Bond polymer (DS9800) and tyramide Cy5 amplification (PerkinElmer), respectively. After completion of γH2AX staining, a second primary antibody (S100 or CK) was applied for 1 hr, followed by Alexa-555–labeled goat anti-rabbit secondary antibody (Invitrogen, Carlsbad, CA). To stain nuclei and preserve the fluorescent signals, ProLong Gold antifade reagent containing 4′,6-diamidino-2-phenylindole (DAPI) was used (Molecular Probes, Eugene, OR) on CLA and TMA slides. Nuclei of WTS and accompanying control CLA slides were stained with Hoechst 33258 (Invitrogen) and slides were mounted with ProLong Gold antifade reagent (Molecular Probes).
Staining Controls
In order to normalize for staining variability and to ensure that antibody staining/detection was not saturated, the same preparation of sham-treated and irradiated NHF1-TERT cells were incorporated into the (1) TMAs containing metastatic melanomas and surrounding tissues, (2) the CLA containing melanoma cell lines, and (3) the CLAs that were stained along with each batch of whole tissue sections of primary melanomas and moles. After antibody staining and digital imaging, TMA/CLA cores containing sham and irradiated fibroblasts were analyzed to ensure that a dose-response was detected (signal from antibody staining remained in the linear detection range). Specific information on how intensity data from fibroblast controls were used for data normalization is described further in the figure legends.
AQUA Analyses
H&E-stained CLA, TMA, and WTS sections were digitally imaged (20× objective) using the Aperio ScanScope XT (Aperio Technologies, Vista, CA). High-resolution acquisition (20× objective) of CLA and TMA IF slides in the DAPI, Cy3 and Cy5 channels was performed using a PM2000 (HistoRx, New Haven, CT) as described in detail (Camp et al. 2002). Images were analyzed using HistoRx AQUA software version 2.2. The AQUA algorithm was used to score expression of DDR biomarkers (target proteins) labeled by Cy5 in DAPI-specific and S100- or CK-specific masks for cell lines and TMA, respectively. S100 was used to define melanoma metastases, while CK was used to define epithelial cells in adjacent normal lung and liver. Monochromatic and merged high-resolution (512×512 pixel, 1-µm resolution) images for each spot were generated. An illustration of AQUA methodology is shown in Fig. S1. All IF slides, including ones that were scanned in PM2000, were scanned in Aperio FL and images were archived in Aperio Spectrum.
Tissue Studio Analyses
For biomarker analysis using Definiens Tissue Studio (ver 3.0; Munich, Germany), slides were analyzed in the IF TMA Portal using the Nuclear Positive/Negative algorithm with minor alterations. An illustration of Tissue Studio nuclear segmentation can be found in Fig. S2.
Statistics
Microsoft Excel 2010 was used to calculate Pearsoncorrelation coefficient R values. Linear regression was performed using GraphPad Prism 5 (La Jolla, CA). P-values less than or equal to 0.05 were considered statistically significant.
Results
Expression of DDR Biomarkers in NHF1-hTERT Cells Treated with IR
Four DDR phospho-proteins were initially evaluated in cell lines and normal skin specimens: γH2AX, P-p53, P-ATM and P-Chk2. Diploid human fibroblasts were treated with IR to induce DNA double-strand breaks and then harvested 30 min after irradiation when the responses to DNA damage were maximal (data not shown). Although the P-p53 antibody reliably detected induction of P-p53 by western immunoblotting in irradiated human fibroblasts and melanocytes (Kaufmann et al. 2003; Kaufmann et al. 2008), the antibody produced unacceptably high cytoplasmic background in skin keratinocytes (data not shown) and was, therefore, not studied further. The other three phospho-proteins were induced by DNA damage in human skin fibroblasts as determined by western immunoblot analysis. Figure 1A shows the dose-response curve for induction of phospho-proteins over IR doses spanning from 0.06-1.5 Gray (Gy). The phosphorylated forms of all three proteins were detected at background levels in untreated fibroblasts and IR induced a dose-dependent increase in the phosphorylation of the target protein. After normalizing phospho-protein signal to the signal from each corresponding total protein band and setting the value of the sham-treated control to unity, treatment with 1.5 Gy IR increased the expression of the biomarkers by up to 147-fold over the sham-treated controls. In a separate experiment, immunoblots were performed using the entire nylon membrane to test for non-specific, cross-reacting bands. The γH2AX antibody detected no non-specific bands, whereas the P-Chk2 and P-ATM antibodies detected cross-reacting bands (data not shown). AQUA analysis (described below) suggested that the P-ATM cross-reacting protein was nuclear and contributed to background IF signals in fibroblast nuclei. The cross-reacting protein bands seen with P-Chk2 antibody did not appear to be nuclear and did not produce a substantial nuclear IF signal background. For each of the three DDR biomarkers, expression was stringently dependent upon the applied dose of IR (Fig. 1A).
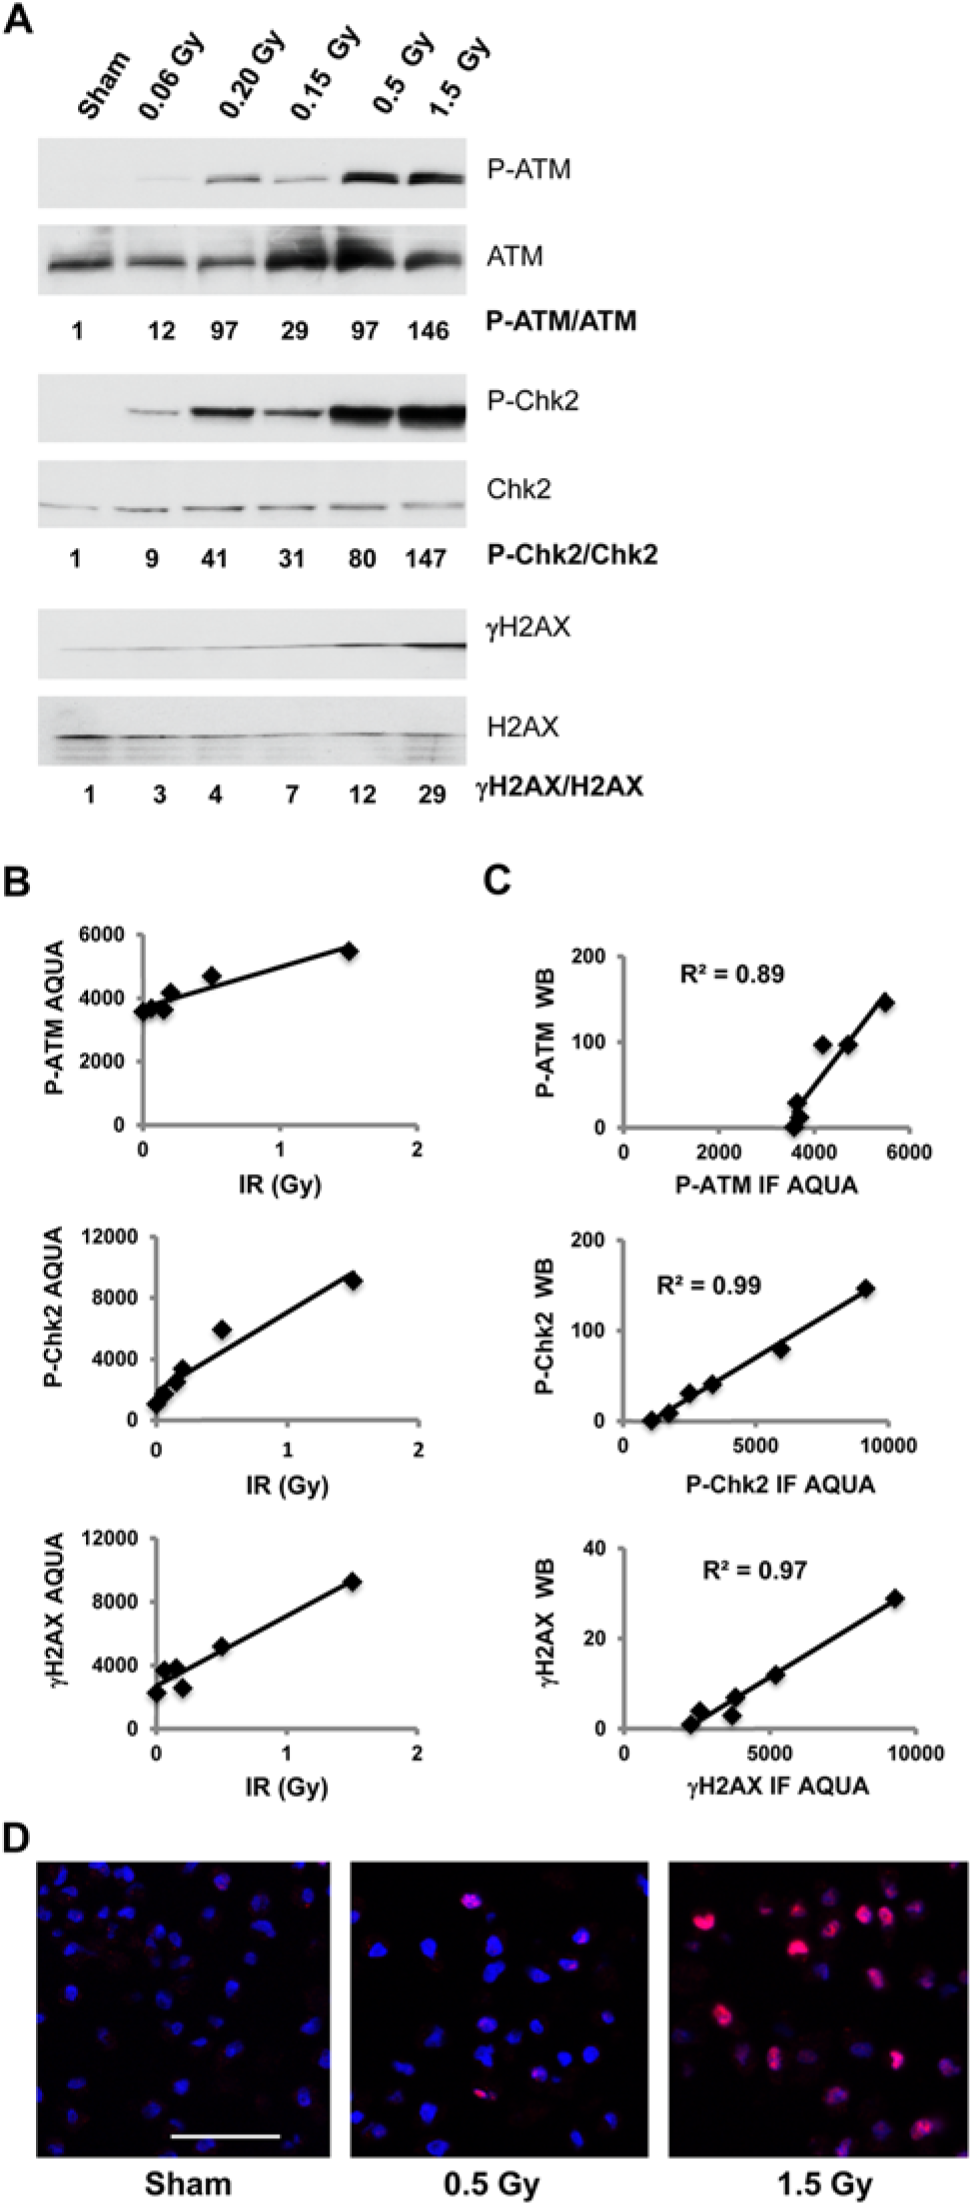
Correlation between western immunoblot and IF scores for DNA damage response (DDR) biomarker expression. (A) Cells from the diploid human skin fibroblast line, NHF1-hTERT, were harvested for western immunoblot analysis of protein expression 30 min after sham treatment or treatment with various doses of IR. Phospho-proteins were detected using antibodies against P-ATM, P-Chk2 and γH2AX. Total biomarker protein was detected using antibodies against ATM, Chk2 and H2AX. Pixel intensities in protein bands were determined using Image J. Values in IR-treated samples (beneath each set of blots) are expressed relative to the sham-treated control. (B) Aliquots of cell lines isolated at the same time as those used for the western blots were used for cell line array (CLA) construction, as described in the Materials & Methods. The CLA sections were stained with the same primary phospho-antibodies used for immunoblot analysis. Target proteins were visualized with tyramide Cy5 amplification. The stained slides were scanned at 20× magnification in PM2000 (HistoRx) and digitized images were analyzed to determine Cy5 pixel intensities over DAPI-stained nuclei. Panels show mean fluorescence signals from the three cores for each sample. Variation among the three cores was minimal (<10%). (C) Scatterplots show the correlations between AQUA intensity score and western immunoblot signals for the sham-treated and irradiated cell preparations with linear regression lines. (D) Photomicrographs showing IR–dose-dependent expression of P-Chk2 in fibroblast nuclei. High-resolution (512×512 pixel, 1-μm resolution; Bar = 50 µm) images were obtained using HistoRx AQUA version 2.2.
Aliquots of the same cell preparations that were tested in Figure 1A were fixed in formalin, embedded in paraffin and processed for IF analysis of phospho-protein expression as described in the Materials & Methods. The DDR biomarkers were visualized by tyramide Cy5 amplification (red), and nuclei were stained with DAPI (blue). AQUA quantified the total level of red in the regions of the section that were stained blue with the DAPI (cell nuclei). All three biomarkers displayed a linear increase in IF signal as the level of IR-induced DNA damage was increased (Fig. 1B). The P-Chk2 biomarker displayed the greatest dynamic range by AQUA with the expression signal in 1.5 Gy-treated cells being increased to nearly 10-times the background measured in the sham-treated controls. Photomicrographs show the IR–dose-dependent increase in P-Chk2 IF signal in human fibroblast nuclei (Fig. 1D). The IR-induced signal of γH2AX after 1.5 Gy was 5-times that of the control, and the induced signal of P-ATM was less than twice that of the control background. The high background for the IF signal seen with the P-ATM marker likely reflects the presence of the cross-reacting protein that was detected by immunoblot analysis.
The Cy5 fluorescence intensities over fibroblast nuclei (AQUA IF scores) were highly correlated with the expression of DDR phospho-proteins as measured by western immunoblots (Fig. 1C). The correlations between western immunoblot detection of phospho-protein and AQUA quantification were high (P-ATM, R2=0.89, P=0.005; P-Chk2, R2 =0.99, P≤0.0001; γH2AX, R2=0.97, P=0.0003).
To demonstrate that the correlation between IF-determined levels and western blot data for DDR proteins was independent of the analysis methodology, we used Tissue Studio to determine P-Chk2 and γH2AX levels. Using IF-stained digital images from a CLA containing sham-treated and irradiated NHF1 cells, which were not collected at the same time as cells used for the western blot analysis described above, we found a linear dose-response to IR and a high correlation between Tissue Studio IF-determined levels of P-Chk2 and γH2AX and western blot data (R2=0.97, P=0.0151 and R2=0.99, P=0.0069, respectively; Fig. S3). These data indicate that the IF quantification of P-Chk2 and γH2AX is reproducible across digital analysis programs and platforms and CLA preparations.
Expression of DDR Biomarkers in Melanoma Cell Lines
To assess DDR biomarker quantification further, nine human melanoma cell lines were compared for biomarker expression by western immunoblot and AQUA. After harvesting cells, the preparations were split in two, with half being processed for immunoblot analysis and half being used to construct a small CLA for IF. Because the levels of ATM, Chk2 and H2AX varied across the melanoma cell lines, phospho-protein expression was normalized using γ-Tubulin or actin as loading controls (Fig. 2A). The melanoma cell lines displayed substantial variation in biomarker expression as determined by immunoblot analysis. A positive control of IR-treated fibroblasts was included in the immunoblot and AQUA analyses so that biomarker expression in the melanoma cell lines could be expressed relative to a reference. AQUA and immunoblot quantifications of biomarker expression were correlated for the P-Chk2 and γH2AX markers (Fig. 2B: R2=0.47 with P=0.04 for P-Chk2, R2=0.51 with P=0.03 for γH2AX), but not correlated for the P-ATM marker (R2=0.04 with P=0.6). This may be because of a large background signal for the IF due to cross-reacting proteins. The high molecular weight cross-reacting species seen in the fibroblasts was not present in the melanoma cell lines, but additional lower molecular weight cross-reacting species were present in the melanoma cell lines (data not shown). Photomicrographs document the great variation in P-Chk2 expression in melanoma cell lines (Fig. 2C).
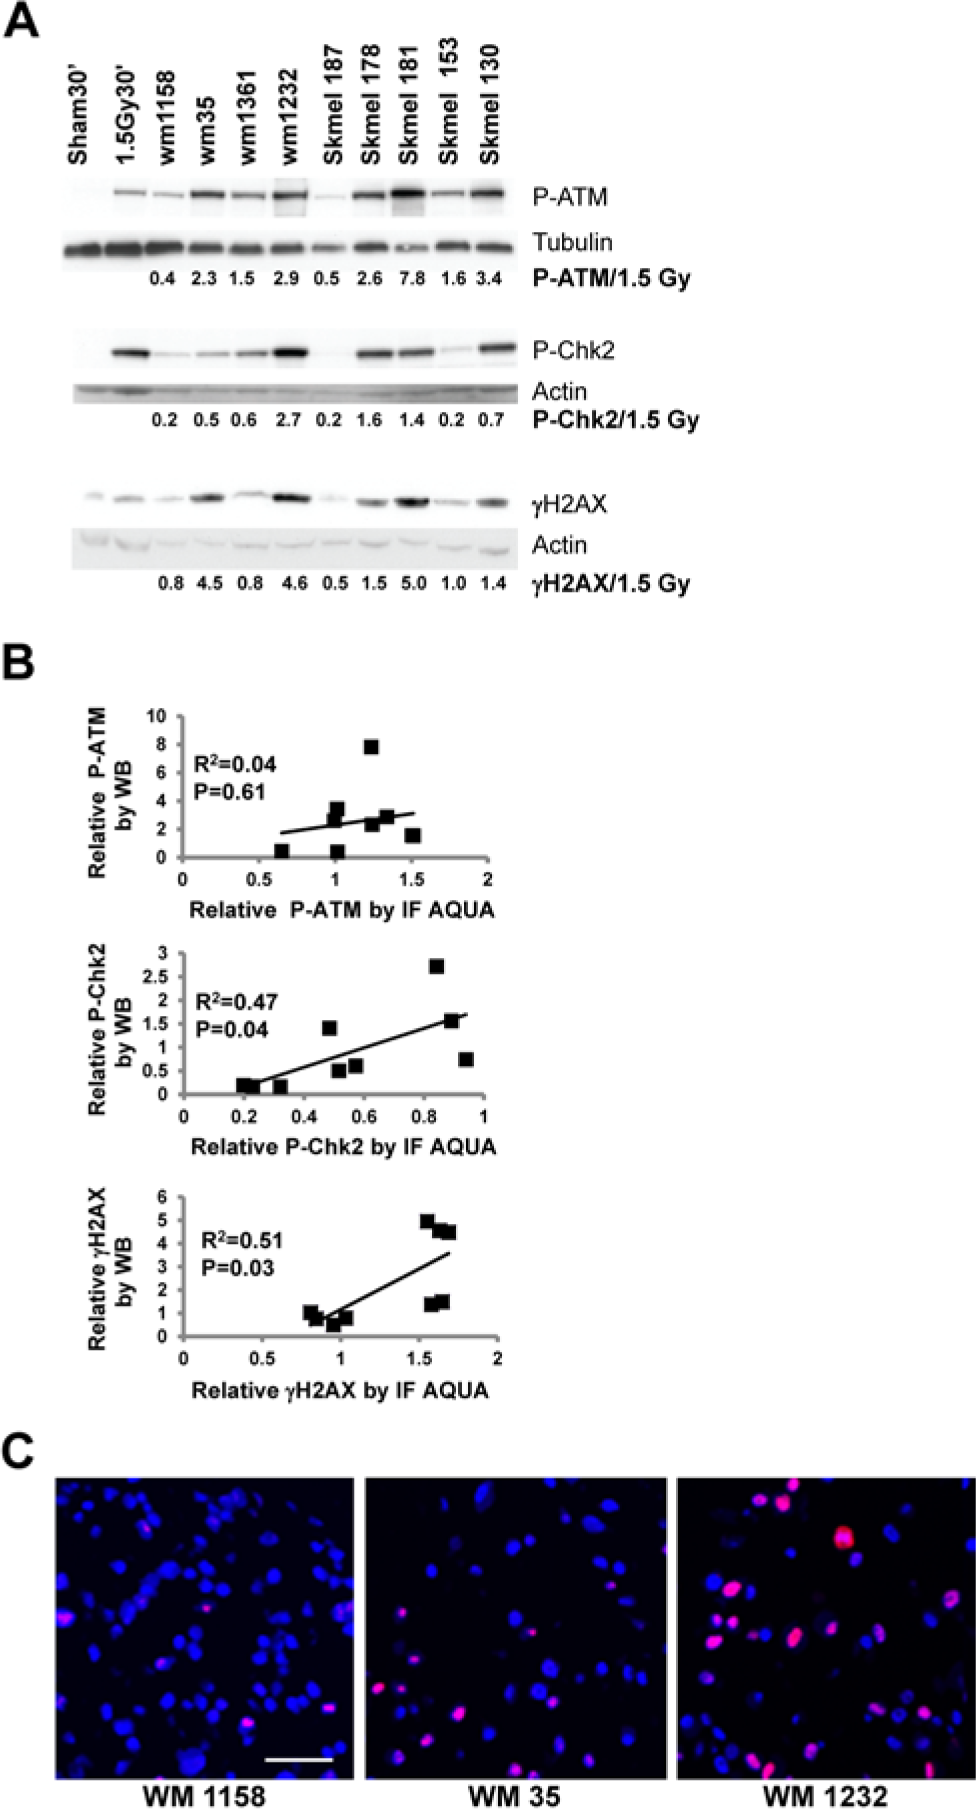
Correlation between immunoblot and AQUA quantification of DNA damage response (DDR) biomarkers in melanoma cell lines. (A) Western immunoblot. Nine melanoma cell lines were harvested when in logarithmic growth and processed for western immunoblot and AQUA analyses of DDR phospho-protein expression. The NHF1-hTERT line that was sham-treated or exposed to 1.5 Gy 30 min before cell harvest served as negative and positive controls, respectively, for biomarker expression. Equal amounts of cell protein lysate were loaded onto polyacrylamide gels. γ-Tubulin and Actin were used as internal controls for protein loading. The pixel intensities of phospho-protein bands were determined and expressed relative to the positive control fibroblasts that were treated with 1.5 Gy, with normalization to the loading control. (B) AQUA correlation with immunoblot. Companion aliquots of melanoma cell line pellets used for the western immunoblots in (A) were fixed in formalin to prepare cell line blocks for cell line array (CLA). After IF and AQUA processing, the mean fluorescence intensities of each biomarker for melanoma nuclei were expressed relative to the NHF1-hTERT fibroblasts that were treated with 1.5 Gy 30 min before harvest and included in the CLA. Scatter plots show the correlations between relative biomarker expression by immunoblot and AQUA. (C) Photomicrographs showing variable expression of P-Chk2 in melanoma cell lines. High resolution (512×512 pixel, 1-µm resolution; Bar = 50 µm) images were obtained using HistoRx AQUA version 2.2.
Having demonstrated that AQUA-determined levels of the P-Chk2 and γH2AX biomarkers correlated well with western immunoblot data, a larger CLA, containing cell pellets of 40 melanoma cell lines and one normal human melanocyte culture (Sambade et al. 2011), was analyzed using these markers. Sham- or IR-treated normal human fibroblasts (NHF1-hTERT) were included in the CLA as controls. Figure 3A (P-Chk2) and Figure 4 (γH2AX) show that the normal melanocyte culture displayed low levels of P-Chk2 and γH2AX biomarker expression, which were similar to the value scored for the sham-treated control fibroblasts. Two other melanocyte cultures were examined by immunoblot and shown to express low levels of γH2AX similar to those levels seen in NHF1-hTERT (data not shown). In contrast, the 40 melanoma cell lines displayed a range in the expression of P-Chk2 and γH2AX, varying from the low level seen in normal melanocytes to a level of expression equivalent to or higher than that measured in fibroblasts after 1.5 Gy. For γH2AX, 78% (31/40) of melanoma cell lines displayed AQUA scores that exceeded the level expressed in 1.5 Gy-IR fibroblasts; this represents a dose of radiation well within the range of the clinical doses used to treat patients (Fig. 4). Similarly, 43% (17/40) of melanoma cell lines displayed levels of P-Chk2 that exceeded the value of this marker in fibroblasts treated with 0.5 Gy of IR (Fig. 3A). We also analyzed IF images for this CLA using Tissue Studio, and found a high correlation between AQUA IF and Tissue Studio scores for both P-Chk2 (R2=0.86, P<0.0001; Fig. 3B) and γH2AX (R2=0.68, P<0.0001; Fig. S4A).
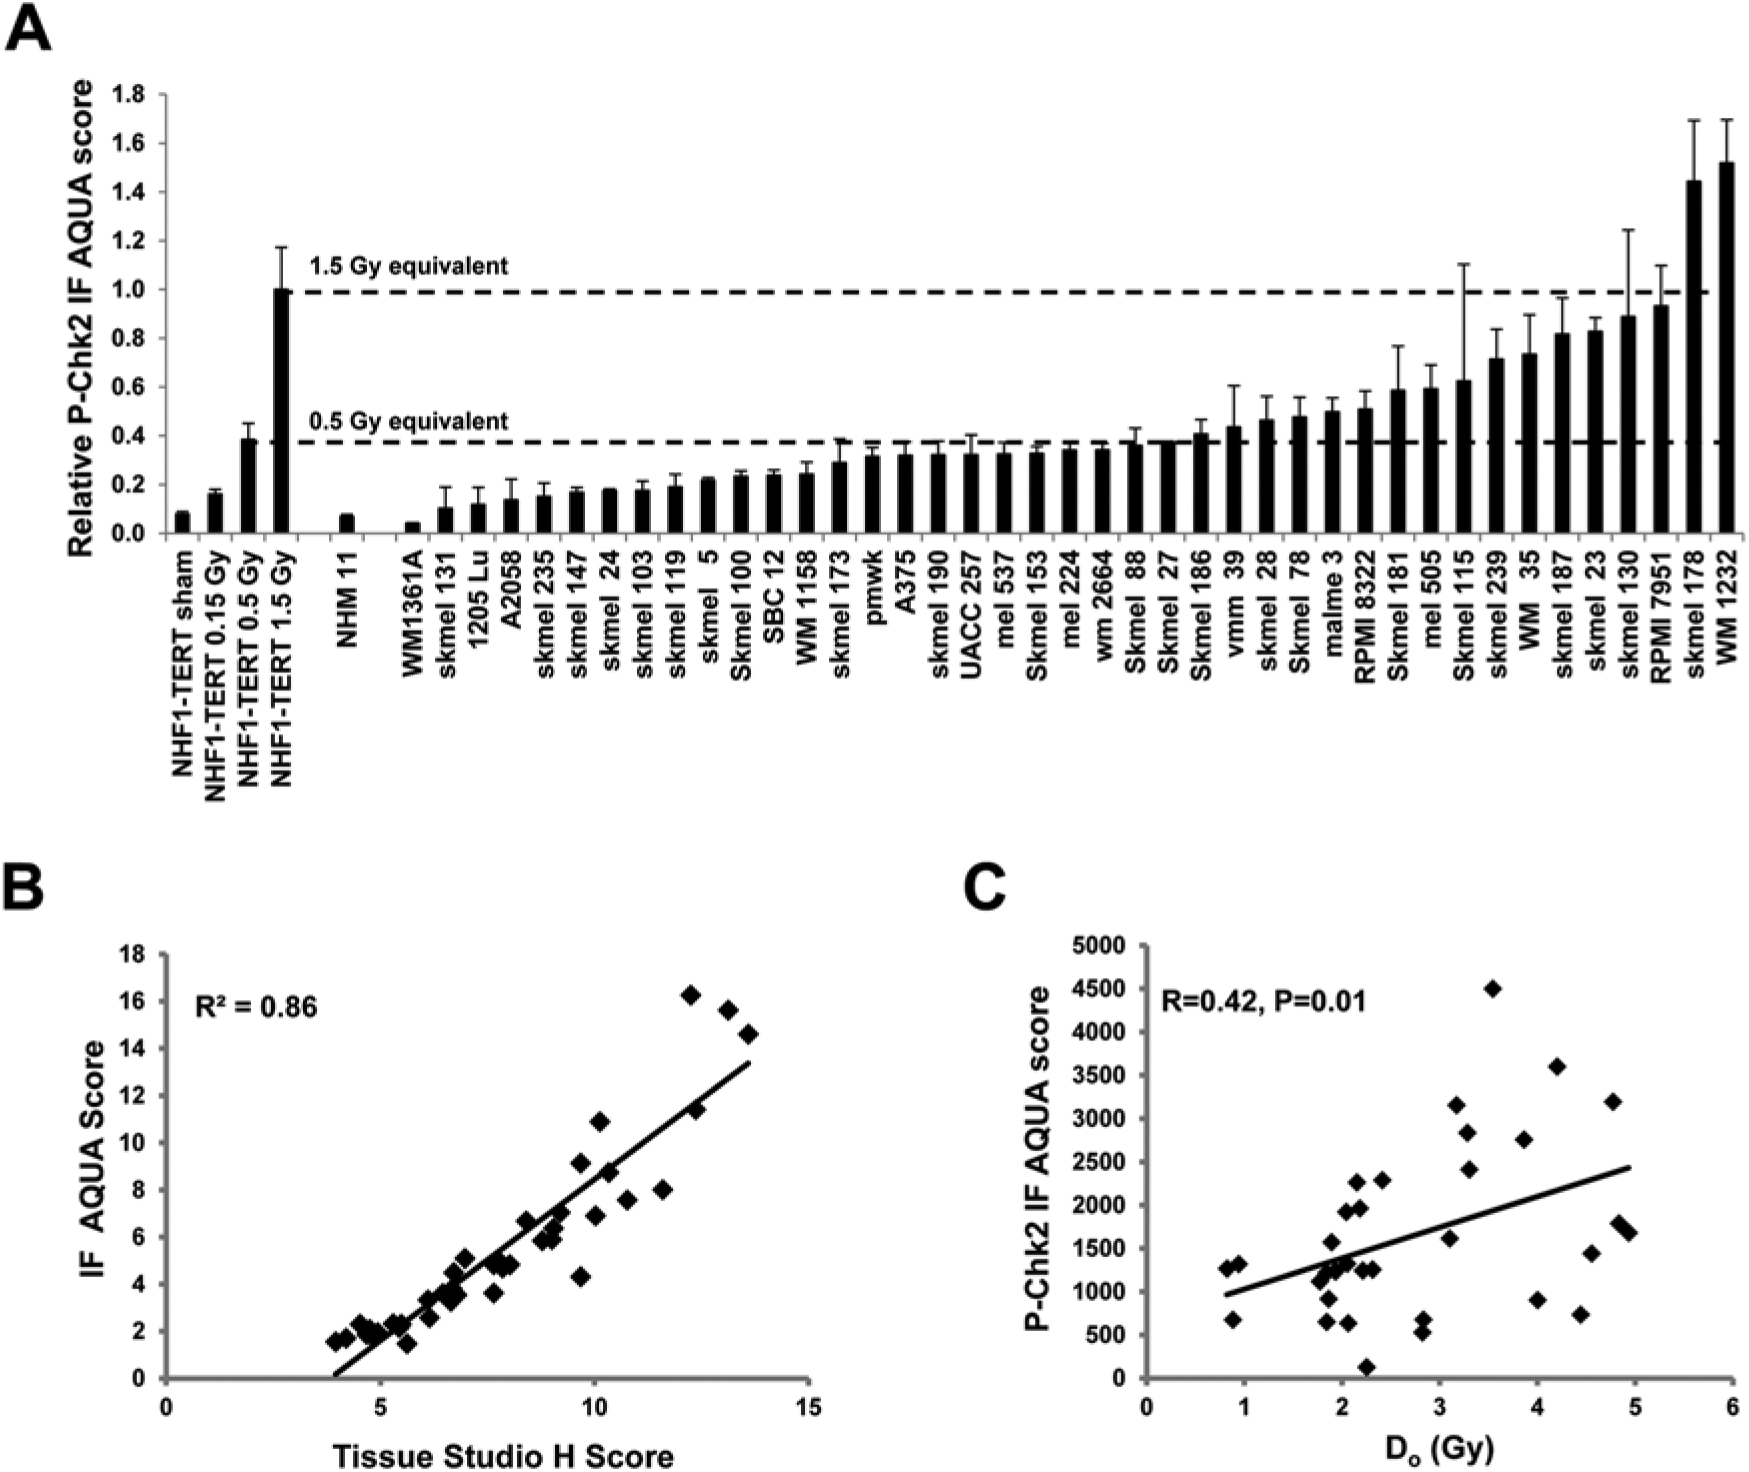
IF quantification of P-Chk2 in melanoma cell lines. (A) AQUA quantification of P-Chk2 expression. One normal human melanocyte culture (NHM11) and 40 melanoma cell lines were harvested when in logarithmic growth, fixed in formalin and embedded in paraffin for construction of a cell line array (CLA). NHF1-hTERT fibroblasts that were sham-treated or exposed to various doses of IR 30 min before harvest were included in the CLA as negative and positive controls, respectively, and for data normalization. Results were normalized to the 1.5 Gy equivalent for fibroblasts and show mean + SEM. (B) Correlation of IF analysis data from AQUA and Tissue Studio. Images from IF labeling of the melanoma CLA were scanned using Aperio FL and nuclei were analyzed for the expression levels of P-Chk2. All data were normalized to NHF1 sham-treated samples from the same CLA. (C) P-Chk2 DNA damage response (DDR) biomarker expression in melanoma cell lines is correlated with radiosensitivity. Melanoma cell lines were assayed for radiation-induced inactivation of colony formation and D0, as a measure of radiosensitivity, was calculated as previously described (Sambade et al. 2011). D0 data were statistically compared to AQUA-determined P-Chk2 levels.
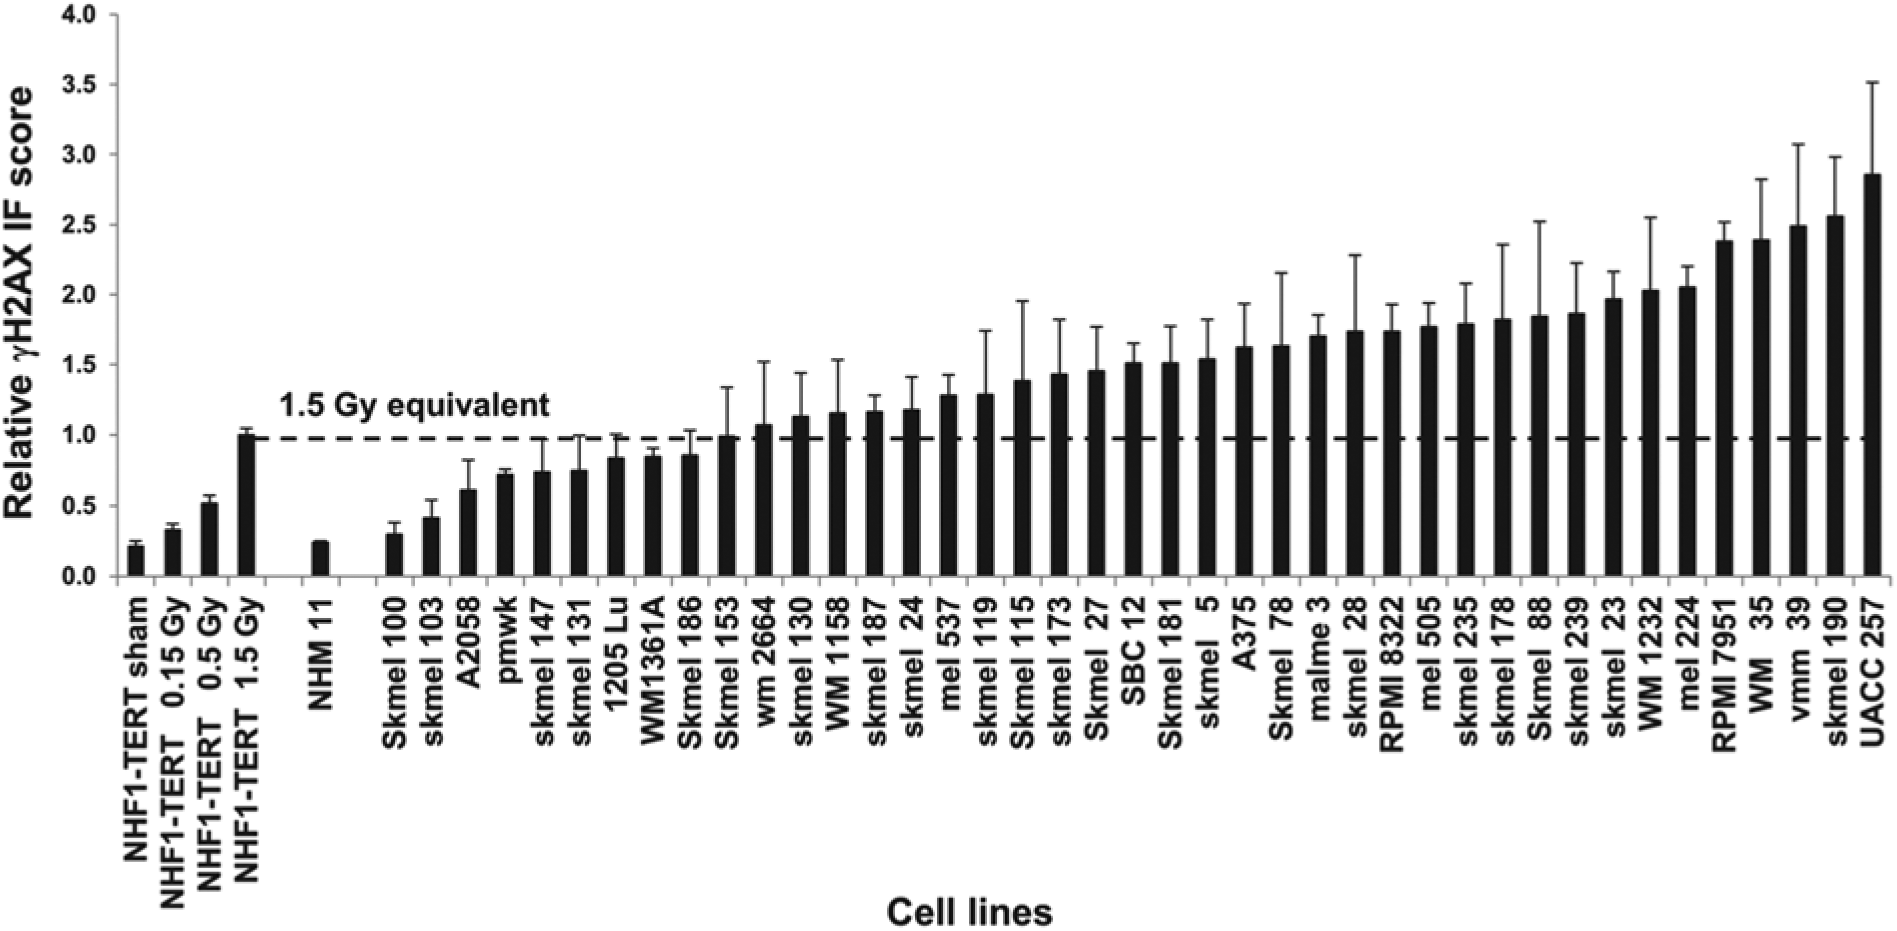
IF quantification of γH2AX in melanoma cell lines. NHF1-hTERT fibroblasts that were sham-treated or exposed to various doses of IR 30 min before harvest were included in the cell line array (CLA) as negative and positive controls, respectively, and for data normalization. AQUA quantification of the expression of γH2AX in the melanoma cell line CLA (see CLA description for Fig. 3A). Results were normalized to the 1.5 Gy equivalent for fibroblasts and the graph shows the mean + SEM.
Given the great variation in AQUA scores among melanoma cell lines, it was of interest to determine whether the biomarkers were correlated with some biological property of the lines. Radiosensitivity was previously assessed for these cell lines as a continuous variable quantified as the D0 from killing curves in radiation dose-response studies (Sambade et al. 2011). The AQUA P-Chk2 level in melanoma cell lines was found to be positively correlated with their radioresistance (Fig. 3C, R=0.42, P=0.01). A comparison of Tissue Studio IF scores with D0 scores for radiosensitivity also showed a significant correlation (R=0.36, P=0.04; data not shown). Although the expression of P-Chk2 was also correlated with the expression of γH2AX (R = 0.41), the expression of γH2AX was not well correlated with radiosensitivity (R=0.21, P=0.2367) in this experimental series. These results demonstrate that not only can DDR biomarker expression be quantified by automated digital image analysis in melanoma cell lines, but the levels of biomarker expression might provide an index of biological function. In the case of P-Chk2, biomarker expression correlated with radiosensitivity.
Expression of γH2AX in Moles, Primary Melanomas, Metastatic Melanomas and Surrounding Normal Tissues
A TMA of metastatic melanoma tissues was analyzed to assess the application of the AQUA technology to quantify the DDR in clinical specimens. A composite image of γH2AX in melanoma shows a high expression of γH2AX in nuclei within the S100 tumor mask (Fig. S1). As was seen in the melanoma cell lines, cells from the metastatic melanoma tumors displayed substantial variation in the expression of γH2AX. Four of the 20 specimens displayed an expression of γH2AX at a level exceeding that induced by 1.5 Gy IR in fibroblasts, and 85% (17/20) of samples displayed AQUA γH2AX scores that exceeded that induced in fibroblasts with 0.5 Gy IR (Fig. 5A). Tissue Studio analysis of IF images from the same TMA was highly correlated with AQUA data (R2=0.88, P < 0.0001; Fig. S4B). Normal lung and liver tissue was collected from tumor blocks to score AQUA γH2AX in matched pairs of tumor and surrounding normal tissue. In comparison with both the lung and liver normal tissue controls, the melanoma metastases displayed higher AQUA γH2AX signals (Fig. 5B). The expression of γH2AX in WTS of moles and primary melanomas was also examined using AQUA. Similar to the results with melanoma cell lines and metastatic melanomas, both moles and primary melanomas displayed substantial variation in the expression of γH2AX (Fig. 5C), with moles showing higher average γH2AX AQUA scores relative to primary melanomas in this dataset (P=0.023).
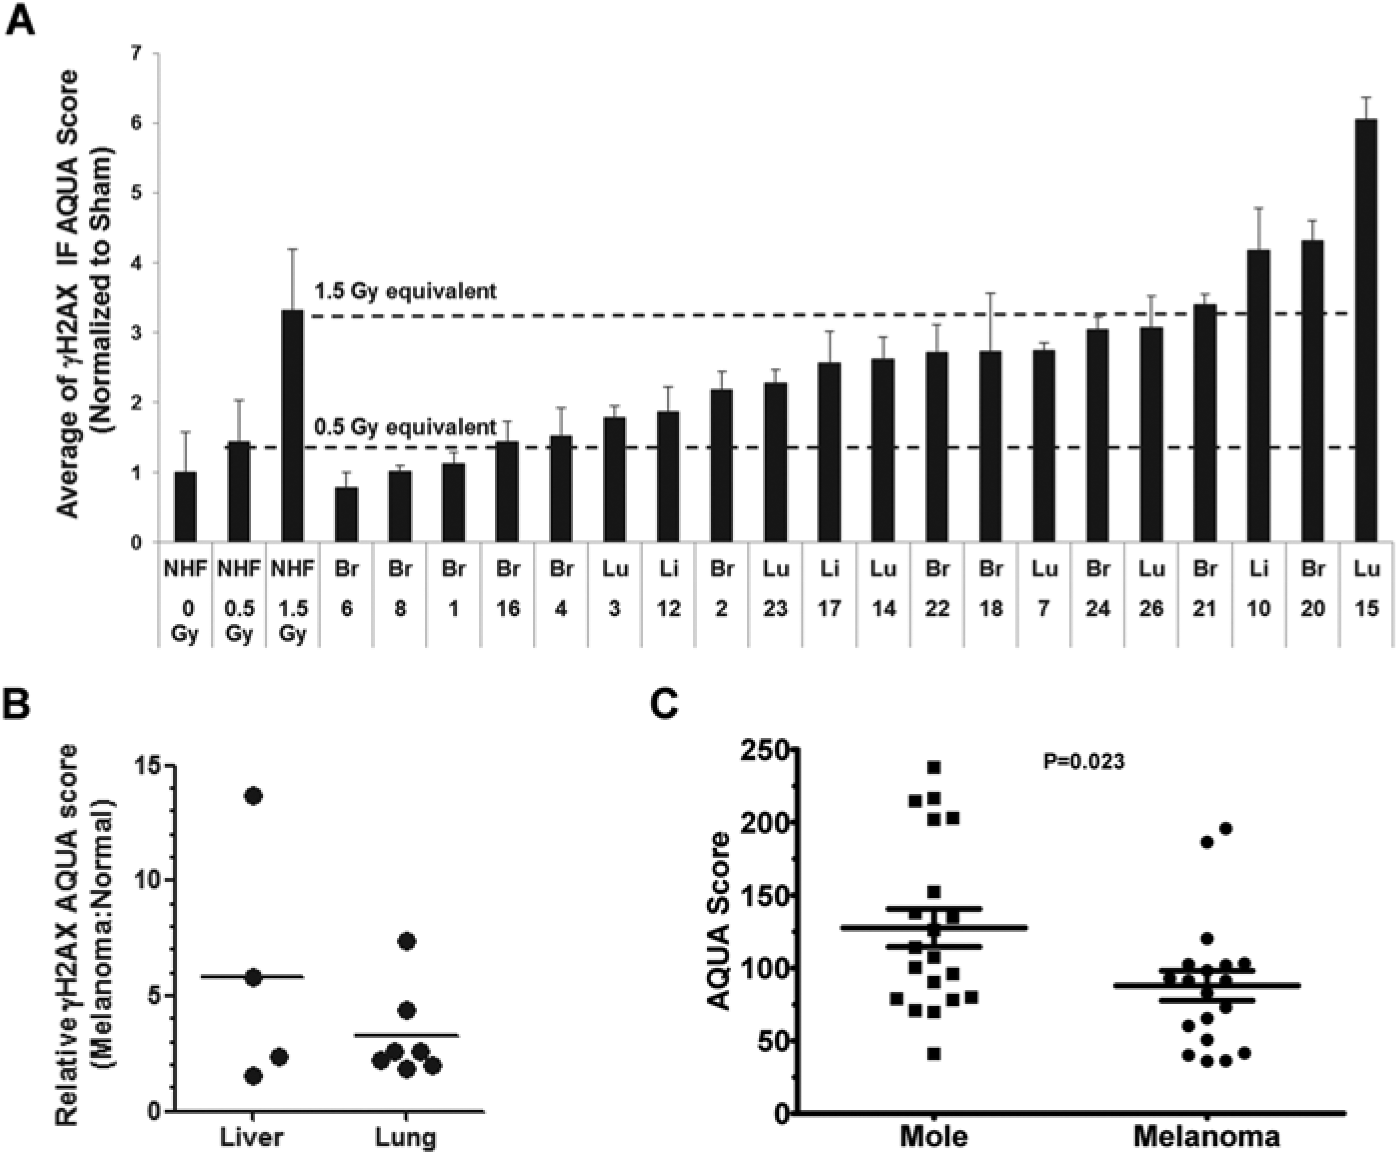
AQUA-determined protein levels of γH2AX in moles, primary melanomas, and melanoma metastases. (A) Tumor blocks were collected and two TMAs were assembled, one with cores from the melanoma metastases and one with cores from normal tissue surrounding the metastases. Insufficient normal brain tissue was available in paraffin blocks, so surrounding normal brain was not included in the TMA. Cores from fibroblasts treated with IR (as described for Fig. 1) were included in each TMA. For the melanoma TMA, S100 was used as the tumor mask. For the surrounding normal tissue TMA, pan-cytokeratin was used as the mask to select epithelial cells for analysis. AQUA scores for γH2AX were determined on the melanoma TMA for each core and normalized to the mean value of the unirradiated (sham-treated) normal fibroblast cores. Results show mean + SEM (n=2–3 cores). (B) AQUA γH2AX scores were determined for the melanoma and for the surrounding tissue TMA and each normalized to the mean value of the unirradiated normal fibroblast cores. Normalized AQUA γH2AX scores for the melanoma cases were divided by the AQUA γH2AX scores for the surrounding normal tissue. All melanoma metastases had AQUA γH2AX scores in excess of that scored in the normal surrounding tissue. (C) AQUA scores for γH2AX were determined on WTS from moles and primary melanomas using an S100 tumor mask. Higher γH2AX expression was evident in moles than in primary melanomas (P=0.023). Bars show mean ± SEM.
Discussion
AQUA and Tissue Studio technologies provide efficient and accurate methods for the enumeration of protein expression in specific cellular and sub-cellular compartments. Previously, it was shown that AQUA scores and in situ protein concentrations were directly proportional (Cregger et al. 2006; Harigopal et al. 2005; McCabe et al. 2005; Yu et al. 2005a; Yu et al. 2005b). In this paper, we developed protocols for assessing P-ATM, P-Chk2 and γH2AX biomarkers in a fully automated IHC staining system to standardize the process of automated digital analysis of IF images in a manner applicable to both AQUA and Tissue Studio programs. Expression levels of these DDR biomarkers measured by AQUA and Tissue Studio in an IR dose-response experiment were compared with protein levels measured by immunoblot analysis (Figs. 1 and S3). There was a very high correlation between biomarker quantification by immunoblot and IF data for cell line extracts and cell line blocks from normal human fibroblasts. The same high correlation was obtained between the AQUA scores and immunoblot analysis in a kinetic experiment when the NHF1-hTERT cell line was collected at 0.5, 2, 6 and 24 hr after treatment with 1.5 Gy (data not shown). Thus, IF image analysis was as effective as immunoblotting for the detection of DDR biomarkers. After standardizing our assays for the digital IF quantification of DDR biomarkers on normal human fibroblast cells with induced DNA damage, nine melanoma cells lines were analyzed, and, again, we found that IF-determined protein levels correlated well with immunoblotting (Fig. 2). Confident that our image-based assays were accurately determining cellular protein levels for both P-Chk2 and γH2AX biomarkers, we expanded our analysis to a total of 40 melanoma cell lines and tissue sections from 22 metastatic melanoma cases. Because the P-ATM antibody had shown a non-specific nuclear signal, P-ATM was not used for this part of our analysis. The results for P-Chk2 and γH2AX, however, indicated that these two proteins may have different potential roles as clinical biomarkers.
Studies on γH2AX demonstrated that levels of this protein were highly variable in melanoma cell lines, with many having levels that were equivalent to, or higher than, that found in fibroblasts after 1.5 Gy of irradiation (Fig. 4). This variability agrees with data from Warters et al. (2005) who found a 17- to 42-fold increase in the number of γH2AX foci in nuclei from melanoma cells relative to normal melanocytes.
We also evaluated γH2AX in two TMAs to see if this variability could be detected in tissue sections. As mentioned above, one advantage that both AQUA and Tissue Studio have over traditional IHC is that the protein masks can be used to define sub-cellular regions of interest. This is especially useful for finding small regions of tumor in whole tissue sections and for protein markers that are expressed normally in some cellular compartments but aberrantly in tumors cells. For example, the intermediate filament protein vimentin is normally expressed in mesenchymal cells. However, in several non-mesenchymal tumor types, including melanoma, vimentin is over-expressed (Hendrix et al. 1992; Li et al. 2010). With digital IF analysis, a cytokeratin mask can be used so that vimentin expression is only quantified in epithelial cells and not in the surrounding stroma, greatly increasing the accuracy of the analysis. To increase the accuracy of our study of γH2AX in melanoma tissue samples, the γH2AX antibody was used with an anti-S100 antibody to stain the cytoplasm of melanocytic lineage cells (Berger et al. 2004; Gould Rothberg et al. 2009). AQUA revealed substantial variations in γH2AX expression in metastatic melanoma similar to that seen for the melanoma cell lines, whereas the normal surrounding tissue had significantly lower γH2AX levels. These results agree well with previously published studies that used manual evaluations (pathologist review) to analyze IHC results (Gorgoulis et al. 2005; Wasco et al. 2008). For example, Gorgoulis et al. (2005) reported that all of the dysplastic nevi and melanomas that were evaluated stained positive for γH2AX, whereas the surrounding normal skin did not. Additionally, with the aid of a sensitive assay, Wasco et al. (2008) found that γH2AX was expressed in melanomas with a higher positive index and a higher intensity as compared with that in nevi, with metastatic melanomas having slightly higher staining intensity and numbers of positive cells than primary melanomas. Further evaluation of the data also found that γH2AX levels were not correlated with other diagnostic parameters, such as pathological stage (Wasco et al. 2008). The authors proposed that γH2AX levels may not be suitable for an analysis of tumor progression or metastasis, but could be useful as a marker for tumorigenesis in separating melanomas from nevi (Wasco et al. 2008). It is possible, however, that IF analysis, with its greater dynamic range, may be more useful in discerning the stages of tumor progression based on γH2AX levels than the previously described manual scoring system (Gorgoulis et al. 2005).
Similar to our results for γH2AX, IF scores for P-Chk2 in the melanoma cell lines displayed a wide range of expression levels and all but one cell line had levels higher than that observed in normal human melanocytes and fibroblasts. An increase in the number of P-Chk2–positive cells has been previously reported in dysplastic nevi and melanomas (Gorgoulis et al. 2005), but relative intensity levels of P-Chk2 were not determined.
We also compared our IF score results for P-Chk2 with other data previously collected for the melanoma cell lines used in the present study (Sambade et al. 2011). P-Chk2 expression, which varied substantially among the melanoma cell lines (Fig. 3A), was significantly correlated with radiosensitivity (Fig. 3C). In contrast, we found an insignificant correlation between radiosensitivity and γH2AX levels. Identifying predictors of radiation response for melanoma is clinically important. Despite historical descriptions of melanoma as categorically radioresistant (reviewed in (Stevens and McKay 2006)), our recent in vitro studies demonstrating that melanoma cells display a wide range of heterogeneity with respect to IR sensitivity (Sambade et al. 2011), along with recent clinical observations demonstrating radiotherapeutic responses, support a larger role for radiotherapy in the management of melanoma (reviewed in (Khan et al. 2011)). Thus, the ability to predict radiotherapeutic response a priori—especially in a cancer such as melanoma, with a wide known range but unpredictable response to radiotherapy—would be of great value to radiation therapists. Thus, the levels of P-Chk2 have the potential for clinical utilization as a biomarker of the radiotherapeutic response to treatment for melanoma and possibly other cancers.
One caveat to using P-Chk2 as a biomarker is the potential instability of the phosphorylated target epitope. For example, in addition to γH2AX, we stained and analyzed the TMA containing melanoma and normal surrounding tissue samples for P-Chk2, but found that signal levels for this antibody on the tissue samples were much lower than those found for cell line samples (data not shown). Although all liver and most of the lung and brain samples showed some enrichment in P-Chk2 levels in tumor versus normal tissue, P-Chk2 IF scores for almost all tissue cores were below that of sham-treated NHF1 cells on the same TMA (staining levels were less than the reference). Because both cell lines and tissue samples on this TMA were paraffin-embedded and subjected to antigen retrieval, differences in staining were likely due to handling of the tissue before the embedding process. For the cell lines used in this study, cell preparations were promptly fixed in 10% formalin after collection. Comparatively, with human tissue samples, the time between collection and fixation is highly variable and the length of time at room temperature is one factor that can lead to the loss of phosphorylated epitopes. For example, Baker et al. (2005) found that allowing a tissue sample to stand at room temperature for 30 min before fixation was enough time to lose nearly all phospho-Ser473-Akt signal in colon cancer xenografts. There is also evidence that the type of fixative used to preserve the issue can influence tnhe phosphoprotein levels. Burns et al. (2009) found that Streck’s tissue fixative was better at preserving phosphoproteins in human samples than 10% formalin or 4% paraformaldehyde. It may be necessary, therefore, to adjust tissue collection and fixation protocols if phospho-proteins are to be clinically used as biomarkers.
In summary, as DDR biomarkers provide an index of the activation of the DDR system, they may correlate with DNA damage, genomic instability and a propensity for malignant progression and, therefore, be useful for cancer prognosis. Also, because radiation therapy and many chemotherapies work by inducing DNA damage, DDR biomarkers may be useful for predicting responses to therapeutic agents. Furthermore, when properly calibrated, the use of quantitative digital image analysis to evaluate levels of DDR proteins in tumor samples is at least as accurate as classical manual methods of analysis, but has the advantage of being faster and more reproducible. Finally, our study has shown that both AQUA and Tissue Studio determination of levels of P-Chk2 and γH2AX expression could be further developed into an assay as a guide to melanoma diagnosis and as an aid to developing the therapeutic plan.
Footnotes
Acknowledgements
We are grateful to Dr. M. Cordeiro-Stone (UNC) for valuable suggestions and criticism during preparation of this manuscript. We thank Patrick Tompkins, Honglin Hao, and Zuhaib Mahmood for their skilled technical assistance.
Declaration of Conflicting Interests
The author(s) declared no potential conflicts of interest with respect to the research, authorship, and/or publication of this article.
Funding
The author(s) disclosed receipt of the following financial support for the research, authorship, and/or publication of this article: This work was supported, in part, by National Institute of Environmental Health Sciences grants ES010126, ES07126, and ES014635 (WKK, JMS, NET). The UNC Translational Pathology Laboratory is supported, in part, by grants from the National Cancer Institute (CA016086), the UNC University Cancer Research Fund (UCRF). CRM is a Damon Runyon-Genentech Clinical Investigator supported, in part, by grants from the Damon Runyon Cancer Research Foundation (CI-45-09), National Cancer Institute (CA016086, CA106991, CA058223), National Institute of Environmental Health Sciences (ES010126), Department of Defense (W81XWH-09-2-0042), and the UNC University Cancer Research Fund (UCRF). NET is supported, in part, by grants from the National Cancer Institute (CA112243, CA10704339).