
Abstract
The pineal hormone melatonin activates two G-protein coupled receptors (MT1 and MT2) to regulate in part biological functions. The MT1 and MT2 melatonin receptors are heterogeneously distributed in the mammalian brain including humans. In the mouse, only a few reports have assessed the expression of the MT1 melatonin receptor expression using 2-iodomelatonin binding, in situ hybridization and/or polymerase chain reaction (PCR). Here, we described a transgenic mouse in which red fluorescence protein (RFP) is expressed under the control of the endogenous MT1 promoter, by inserting RFP cDNA at the start codon of MTNR1a gene within a bacterial artificial chromosome (BAC) and expressing this construct as a transgene. The expression of RFP in the brain of this mouse was examined either directly under a fluorescent microscope or immunohistochemically using an antibody against RFP (RFP-MT1). RFP-MT1 expression was observed in many brain regions including the subcommissural organ, parts of the ependyma lining the lateral and third ventricles, the aqueduct, the hippocampus, the cerebellum, the pars tuberalis, the habenula and the habenula commissure. This RFP-MT1 transgenic model provides a unique tool for studying the distribution of the MT1 receptor in the brain of mice, its cell-specific expression and its function in vivo.
Keywords
Introduction
Melatonin, the hormone of darkness, mediates biological functions primarily through the activation of the MT1 and MT2 melatonin receptors. The MT1 and MT2 receptors are G-protein coupled receptors (GPCR) with 60% homology in their amino acid sequences and distinct chromosomal localization (Reppert et al. 1996; Slaugenhaupt et al. 1995). The MT1 and MT2 melatonin receptors are heterogeneously expressed in different areas of the brain and throughout the body (Dubocovich and Markowska 2005; Dubocovich et al. 2010; Slominski et al. 2012). Melatonin also exerts some biological activity through non-receptor–mediated processes (Korkmaz et al. 2009; Reiter 1998; Reiter et al. 2007). Previous data suggest that some melatonin actions may include modification of the pathways activated by retinoid orphan/retinoid Z (ROR/RZR) nuclear receptors (Becker-André et al. 1994; Carrillo-Vico et al. 2005; Reiter et al. 2010; Slominski et al. 2012). However, recent evidence indicates that ROR is not a receptor for melatonin, which suggests an indirect mode of action (Slominski et al. 2012).
Melatonin receptor proteins in the brain, retina and peripheral tissues has been visualized using its specific binding to the high-affinity radioligand 2-[125I]-iodomelatonin. In cell lines expressing recombinant human MT1 or MT2 melatonin receptors, 2-[125I]-iodomelatonin binds to both the MT1 and MT2 melatonin receptors with similar picomolar affinity (Dubocovich and Markowska 2005; Dubocovich et al. 2010). In native tissue, however, specific 2-[125I]-iodomelatonin binding correlates almost exclusively with the MT1 melatonin receptor expression, as the expression of the MT2 melatonin receptor in the mouse central nervous system, including the retina and the SCN, is negligible compared with that of the MT1 melatonin receptor (Dubocovich et al. 1998).
Although a powerful tool, 2-[125I]-iodomelatonin binding has notable limitations, as it does not discriminate between the MT1 and MT2 melatonin receptors in native tissue and the binding affinity can be significantly reduced by dimerization of melatonin receptors with their family members (i.e., MT1 and MT2) or other G-protein coupled receptors (i.e., GPR 50) (Ayoub et al. 2004; Jockers et al. 2008; Levoye et al. 2006).
Reverse transcription polymerase chain reaction (RT-PCR) and in situ hybridization have also been used to directly visualize the mRNA localization of each of the two melatonin receptor types. The mRNA localization of the MT1 and MT2 melatonin receptors in mammalian brain and peripheral tissues was determined by RT-PCR and in situ hybridization using MT1 melatonin receptor riboprobes (Masana et al. 2000; Weaver et al. 1988; Weaver and Reppert 1996) and MT1 or MT2 digoxigenin-labeled oligonucleotide probes (Al-Ghoul et al. 1998; Dubocovich et al. 1998; Soares et al. 2003). In the mouse brain, the expression of the MT1 receptor was found in the SCN, cerebellum, hypothalamus, basal ganglia and hippocampus (Imbesi et al. 2008a; Imbesi et al. 2008c; Sotthibundhu et al. 2010; Uz et al. 2005). RT-PCR and in situ hybridization are useful to detect mRNA; however, these techniques also have significant limitations. For example, the presence of mRNA may not necessarily represent the protein expression, as some mRNAs are translationally controlled and may not translate into proteins until stimulated by extrinsic signals. On the other hand, RT-PCR and in situ hybridization may fail to detect mRNAs with a high turnover rate, although the proteins they encode may exist in a high abundance and have efficient mRNA translation and high protein longevity.
Bacterial artificial chromosome (BAC) transgenic mice expressing red fluorescence protein (RFP) and/or green fluorescence protein (GFP) under the transcriptional control of endogenous promoters in a BAC clone have been used extensively to identify the cellular location of gene expression. This technique proved to be very efficient in detecting cells in which the protein of interest is expressed in native tissues, not only because the expression of the reporter gene is regulated by the same endogenous regulatory elements that are used to drive the expression of the gene of interest but also because the reporter protein accumulates over time in cells where the gene of interest is transcriptionally activated (Gong et al. 2003; Heintz 2001). It is also used to determine the cell-specific expression and/or receptor function in vivo in mice (Tallini et al. 2006). In this study we described and characterized a BAC transgenic mouse expressing RFP under the transcriptional control of the MT1 melatonin receptor promoter (RFP-MT1) termed fA transgenic mice. This transgenic mouse model expresses RFP in areas where the MT1 melatonin receptor is present and can be a useful tool to elucidate the cell-specific expression of the MT1 receptor as well as its function. To our knowledge, this is the first study describing a transgenic mouse expressing RFP in MT1-expressing cells in brain areas.
Materials & Methods
Generation of RFP-MT1 DNA Construct
The BAC clone containing the MTNR1a gene (RP23-234B11) was purchased from Invitrogen (Carlsbad, CA). The BAC was modified by recombineering (Lee et al. 2001) with slight modifications. Briefly, BAC DNA was isolated from DH10B and transformed into the competent EL250 by electroporation. The linear targeting DNA cassette, comprising RFP cDNA and a kanamycin selection marker, was generated by PCR using plasmid pI-imRFP1 (Jung et al. 2009) as template and a pair of specific primers designed for incorporating 50 bp extensions homologous to the flanking regions of the start codon of Mtnr1a gene. The RFP-MT1 DNA construct was generated by electroporation (Bio-Rad GenePulser 1.75 kV, 25 µF, 200Ω, time constant = 4.0; Bio-Rad; Hercules, CA) of the purified targeting DNA cassette into EL250 cells, which contain RP23-234B11 BAC. The targeting cassette was inserted by homologous recombination at the start codon of the Mtnr1a gene. Homologous recombinants were selected on agar plates containing kanamycin (25 µg/ml) and chloramphenicol (12.5 µg/ml) and screened by PCR using check primers flanking the insertion site. Finally, the kanamycin selection marker was flipped out via site-specific recombination. RFP cDNA insertion was confirmed by DNA sequencing using check primers flanking the insertion site.
Primers for generating targeting DNA cassettes:
MT1RFP-ATG-5:5’GCGACAGGACAATGGCCCTGGCTGTGCTGCGGTG AGGCACCCAGGGGACCCCGGTCGCCACCATGGCCTCC-3’ (mRFP1-L2)
MT1RFP-ATG-3:5’CCGCCTGGAGCCTGCTGAGTGGCATTGAGCAG CTCGCTGACATTGCCCTTCTATTCCAGAAGTAGTGAGGA-3’ (Primer R)
Primers for checking insertion of targeting cassettes
MT1-ATG-5 check: 5’-AAC GTG CAC GCA CTG TGG GA-3’
MT1-ATG-3 check: 5’-AAT GGG GCT AGC GCT GGG AAA G-3’
Generation of MT1-RFP Transgenic Mice
The modified BAC was purified from EL250 cells using Qiagen large-construct kit (#12462; Qiagen; Valencia, CA). The purified BAC DNA was microinjected into fertilized C3H/HeN mouse oocytes (Northwestern University Transgenic Core Facility) and subsequently implanted into surrogate mothers. The pups carrying the RFP transgene were identified by PCR of the genomic DNA isolated from mouse tails with check primers flanking the insertion sites (Fig. 1A). Out of the five transgenic chimeras, three were found to transmit the transgene to the progeny. The three lines showed a similar pattern of RFP distribution in the brain and the one with strongest RFP signal was used to establish a transgenic colony. The RFP-MT1 transgenic mice were maintained as an inbred line on a C3H/HeN genetic background in our mice colony first at Northwestern University Feinberg School of Medicine (Chicago, Illinois), and then at the University at Buffalo (Buffalo/Amherst, New York). All experiments were approved and performed according to the guidelines of the National Institute of Health and the Institutional Animal Care Use Committee at the Northwestern University Feinberg School of Medicine (Chicago, Illinois) and the University at Buffalo (Buffalo/Amherst, New York).
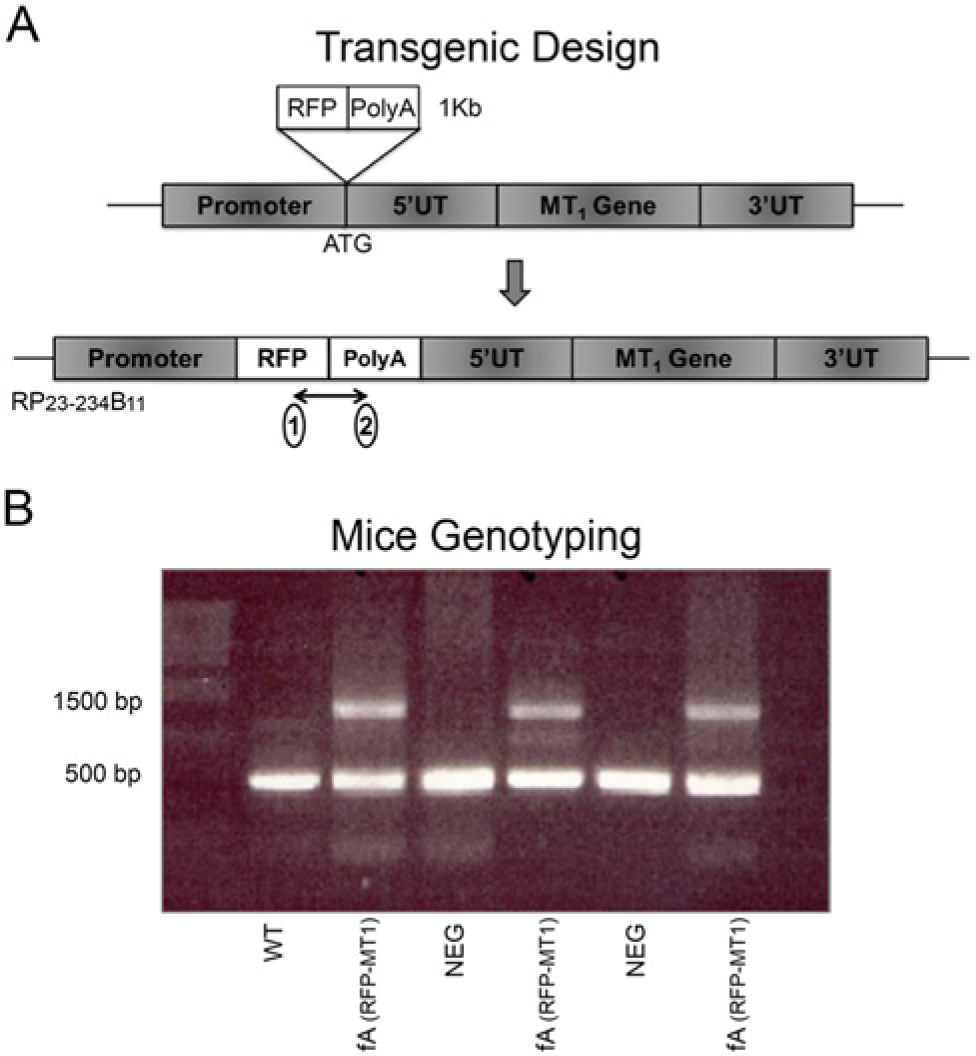
Transgenic design and mouse genotyping. (A) In the BAC clone (RP23-234B11) that contains the genomic locus of MT1 gene, the translational start codon was replaced with sequences encoding RFP and a poly A tail such that only RFP would be transcribed from the modified transgene. (1) and (2) indicate the positions of primers used for checking the RFP insert. (B) Using primers flanking the translational start codon, the PCR reaction detected a ~500-bp band in wild type (WT) and negative littermates (NEG). In the fA hemizygous transgenic mice, both a ~1500-bp band and a ~500-bp band were found, indicating the expression of RFP in these mice.
Animals and Housing
RFP-MT1 transgenic mice and negative littermates were bred at the University at Buffalo School of Medicine and Biomedical Sciences Laboratory Animal Facility. Genotype was confirmed by PCR analysis of DNA samples extracted from the tail tips of these animals when they were weaned and repeated when the animals were sacrificed (Fig. 1B). Animals were group-housed (4 or 5 per cage) and maintained in a temperature- (22 ± 1C) and humidity (20–23%)-controlled room. The mice had free access to food and water and were housed under a 14/10 light/dark cycle with a light intensity of 150 to 200 lux at the level of the cage.
Mouse Genotyping
Genotyping was performed using DNA extracted from the tail of the fA transgenic mice. Genomic DNA was extracted from the tail using Sigma X-NAT-1 kt Red Extract-N-Amp Tm Tissue Kit (#108K6393; Sigma-Aldrich; St. Louis, MO).
Primers used to identify the fA transgenic animals were:
MT1-ATG-5 check: 5’-AAC GTG CAC GCA CTG TGG GA-3’ (Forward Primer)
MT1-ATG-3 check: 5’-AAT GGG GCT AGC GCT GGG AAA G-3’ (Reverse Primer).
PCR assays were performed in a final volume of 20 µL buffer consisting of autoclaved H2O (4 µL), 4 µL of genomic DNA extract, 1 µL of each primer and 10 µL of 2× PCR mix. PCR conditions were: 1 min at 94C, 38 cycles of 30 sec at 94C, 50 sec at 58C and 14 min at 72C. The reaction products were maintained at 4C until analyzed on a 0.7% agarose gel.
Tissue Processing, Immunohistochemistry and Microscopy
To determine the localization of RFP under the transcriptional control of the MT1 promoter (MT1-RFP) in the brain, 16 fA mice (8 males; 8 females) and 16 negative littermate mice (8 males; 8 females) were perfused and their brains were isolated. The brains were processed for direct fluorescence microscopy and immunohistochemistry. RFP expression in brain areas from male and female mice was not significantly different.
Mice were anaesthetized with Avertin (0.024 ml/g, i.p.; 1.4% tribromoethanol plus 1.4% iso-amyl-alcohol in water, pH 5.5) and perfused transcardially for 10 min with 0.9% saline followed by 20 min with 4% paraformaldehyde in phosphate-buffered saline (PBS; 0.01 M, pH 7.4). Mice were perfused between ZT4 and ZT10 [Zeitgeiber Time (ZT): 0 Lights on]. Brains were dissected and post-fixed overnight in 4% paraformaldehyde at 4C, then cryoprotected in 30% sucrose. The brains were embedded in Tissue-Tek Optimum Cutting Temperature (OCT) (Sakura Finetek; Torrance, CA) and stored at -80C until processing.
Samples were serially sectioned (30 µm) in the coronal axis using a Leica CM3050S cryostat (Leica Microsystems; Bannockburn, IL). One set of sections was mounted onto slides, covered with antifade vectashield mounting medium with DAPI (Vector Labs; Burlingame, CA) and examined under Nikon Eclipse 80i fluorescence microscope (Capital Instrument; Beijing, China) for direct RFP-MT1 expression. Another set of sections were kept free-floating in PBS buffer with thimerasol (Sigma-Aldrich) and stained immunohistochemically with biotinylated RFP antibody (Abcam; Cambridge, MA) followed by peroxidase reaction using 3,3’-Diaminobenzidine (DAB) as the chromogen (Vector Labs). The sections were then mounted onto slides and covered with vectamount, a permanent mounting medium (Vector Labs). Images were collected using a Nikon Eclipse 80i light microscope (Capital Instrument) and processed by SPOT Software version 4.6 (Diagnostic Instruments Inc.; Sterling Heights, MI).
Results
Transgenic Mice Generation
An RFP coding sequence was inserted at the start codon of the MT1 melatonin receptor gene in a BAC clone so that the transcriptional machinery that regulates the expression of the endogenous MT1 receptor gene also regulates that of RFP. Five transgenic mice lines were generated and they were all fertile and viable, with normal reproduction cycles compared with our wild type (WT) colony. Examination revealed no physiological and physical deficiencies. Three lines showed the germ-line transmission of the transgene, and the one expressing the highest levels of the transgene (fA) was chosen for further characterization and future studies. This line was used to establish our fA transgenic mice colony at the University at Buffalo, School of Medicine and Biomedical Sciences.
WT, negative littermates, and fA transgenic mice (fA) were all genotyped for the presence of the transgene. All three genotypes produced a wild type band, which was amplified from the chromosome that contains the endogenous MT1 allele (500 bp). In contrast, the transgene that contains an RFP insertion was detected only for fA mice (1500 bp) (Fig. 1A).
DAPI Staining and Immunohistochemistry
The expression of RFP under the transcriptional control of the MT1 promoter (RFP-MT1) in fA mice and negative littermates was determined by direct fluorescence microscopy and immunohistochemistry. Direct fluorescence of RFP-MT1 was assessed in brain sections from negative littermates to serve as a control for the expression of RFP-MT1 in fA mice brains. Brains of negative littermates did not express RFP-MT1 in either the cerebellum (Fig. 2F), pars turberalis (Fig. 3G), aqueduct (Fig. 4E), DMPAG (Fig. 4M), lateral ventricle (Fig. 5F), SCO (Fig. 6E), habenula commissure (Fig. 7E) or habenula (Fig. 7M) indicating RFP expression signal specificity in brain areas from fA mice.
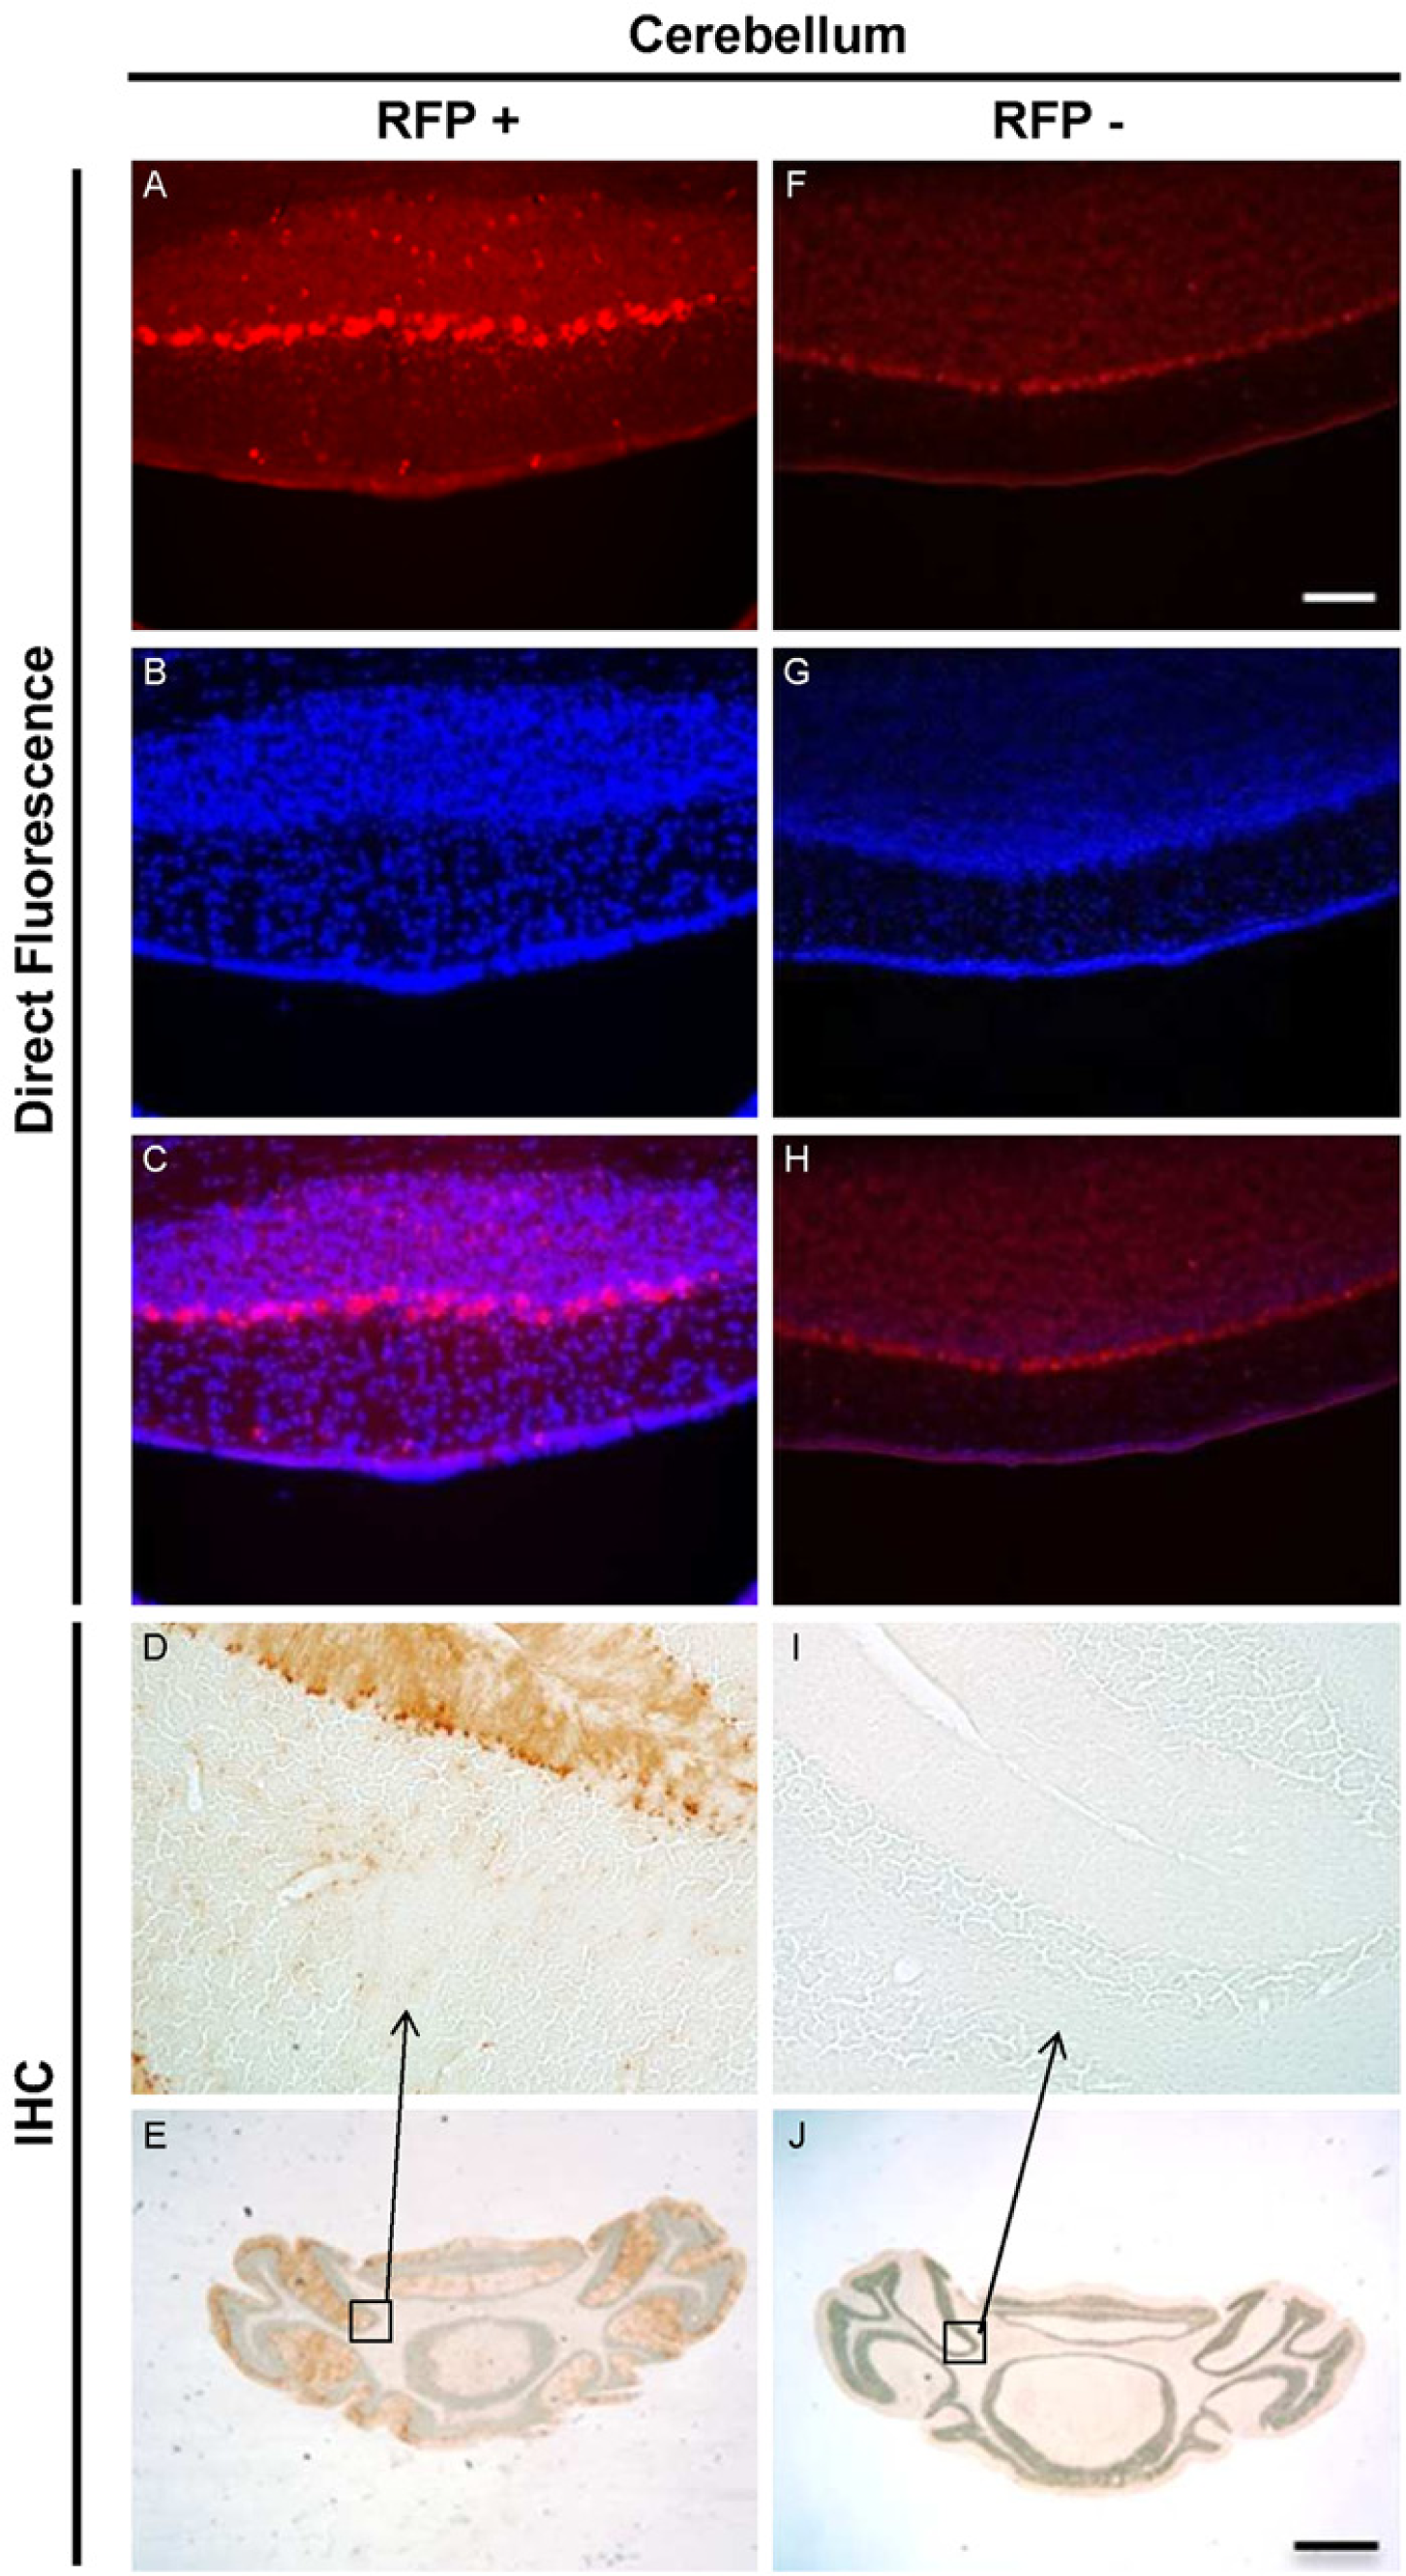
Direct fluorescence and direct immunohistochemistry in cerebellar sections of fA transgenic mice and their negative littermates. RFP expression was found in cerebellar sections of fA transgenic mice (A) but not in the cerebellum of their negative littermates (F) using direct fluorescence microscopy. DAPI nuclear staining of fA mice cerebellar sections (B) showed a merge pattern with RFP expression (C). DAPI nuclear staining for negative littermates (G) did not show any merge pattern (H). The presence of RFP-MT1 was confirmed by immunohistochemistry in the cerebellar sections of fA transgenic (E). A region of the cerebellum was taken at higher magnification (20×) (D). Negative littermate cerebellar tissues were used as a control for the RFP antibody and showed no staining in any region of the cerebellum (J and I). Scale bars are 100 µm (F) and 1 mm (J).
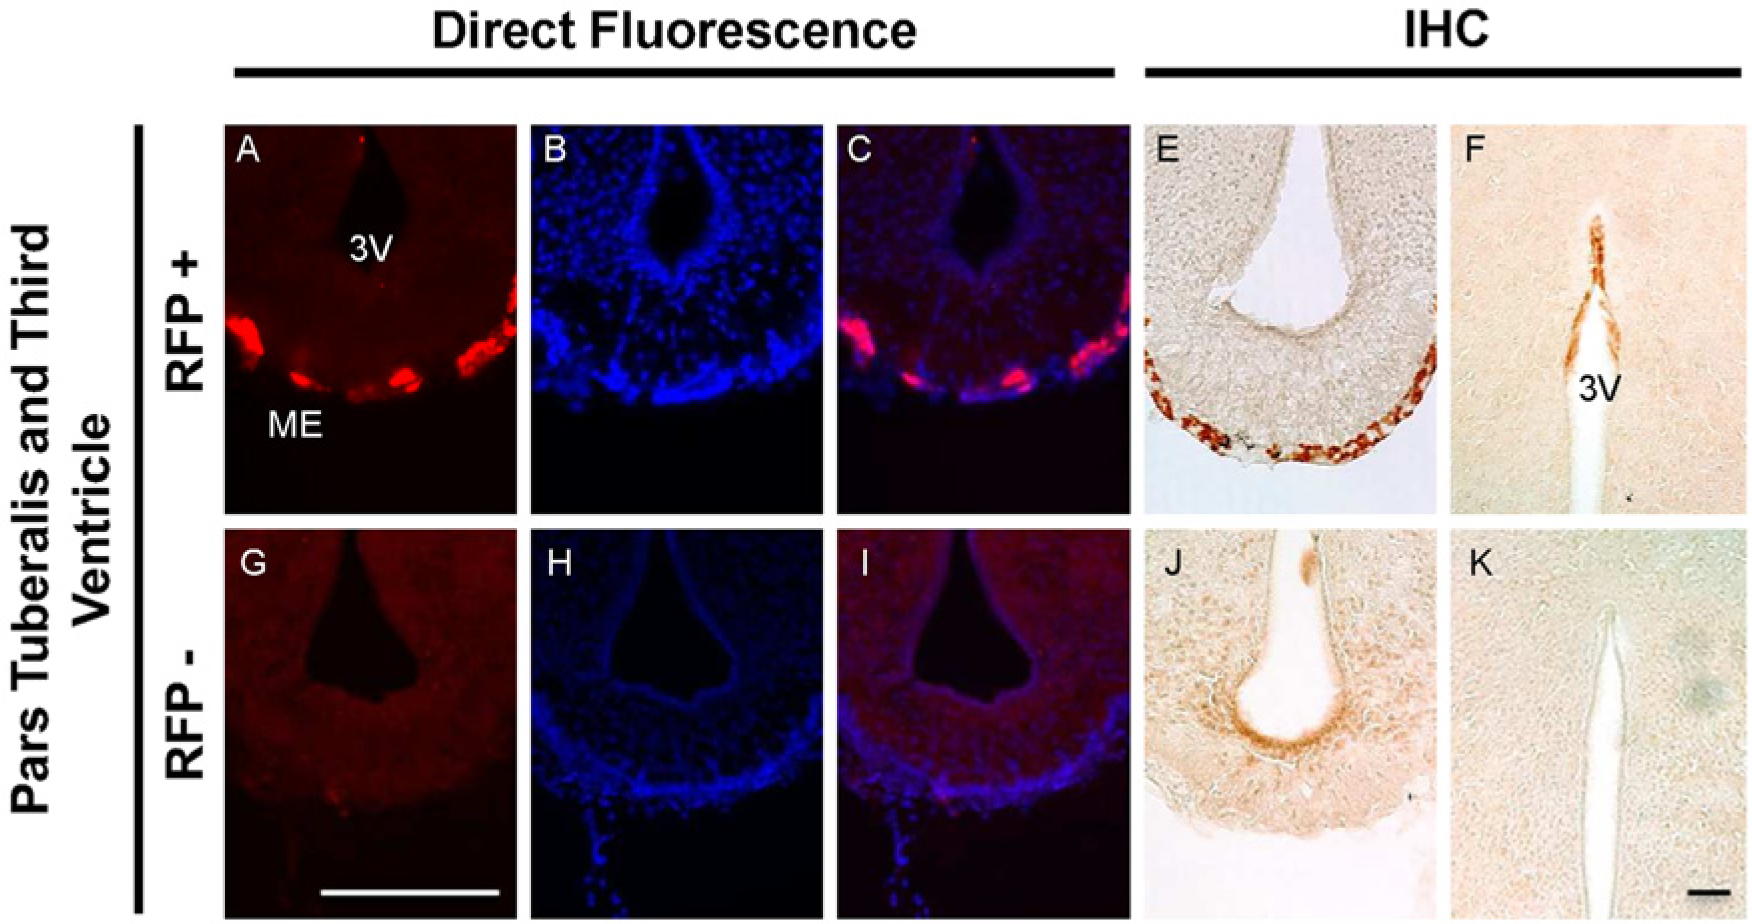
Expression of RFP-MT1 in the pars tuberalis and third ventricle. Direct fluorescence of RFP was detected in the median eminence of the pars tuberalis in fA mice (A) but not in negative littermates (G). DAPI nuclear staining in fA mice sections (B) merged with RFP expression (C), indicating the presence of RFP-MT1 in the median eminence of the pars tuberalis. DAPI muclear staining in negative littermate sections (H) did not show any pattern of merge expression with the red fluorescence image (I). The expression of RFP-MT1 was confirmed using direct immunohistochemistry in the median eminence of the pars tuberalis (E and J) and the ependyma lining the dorsal part of the third ventricle (F and K). Scale bars are 200 µm (G) and 100 µm (K).
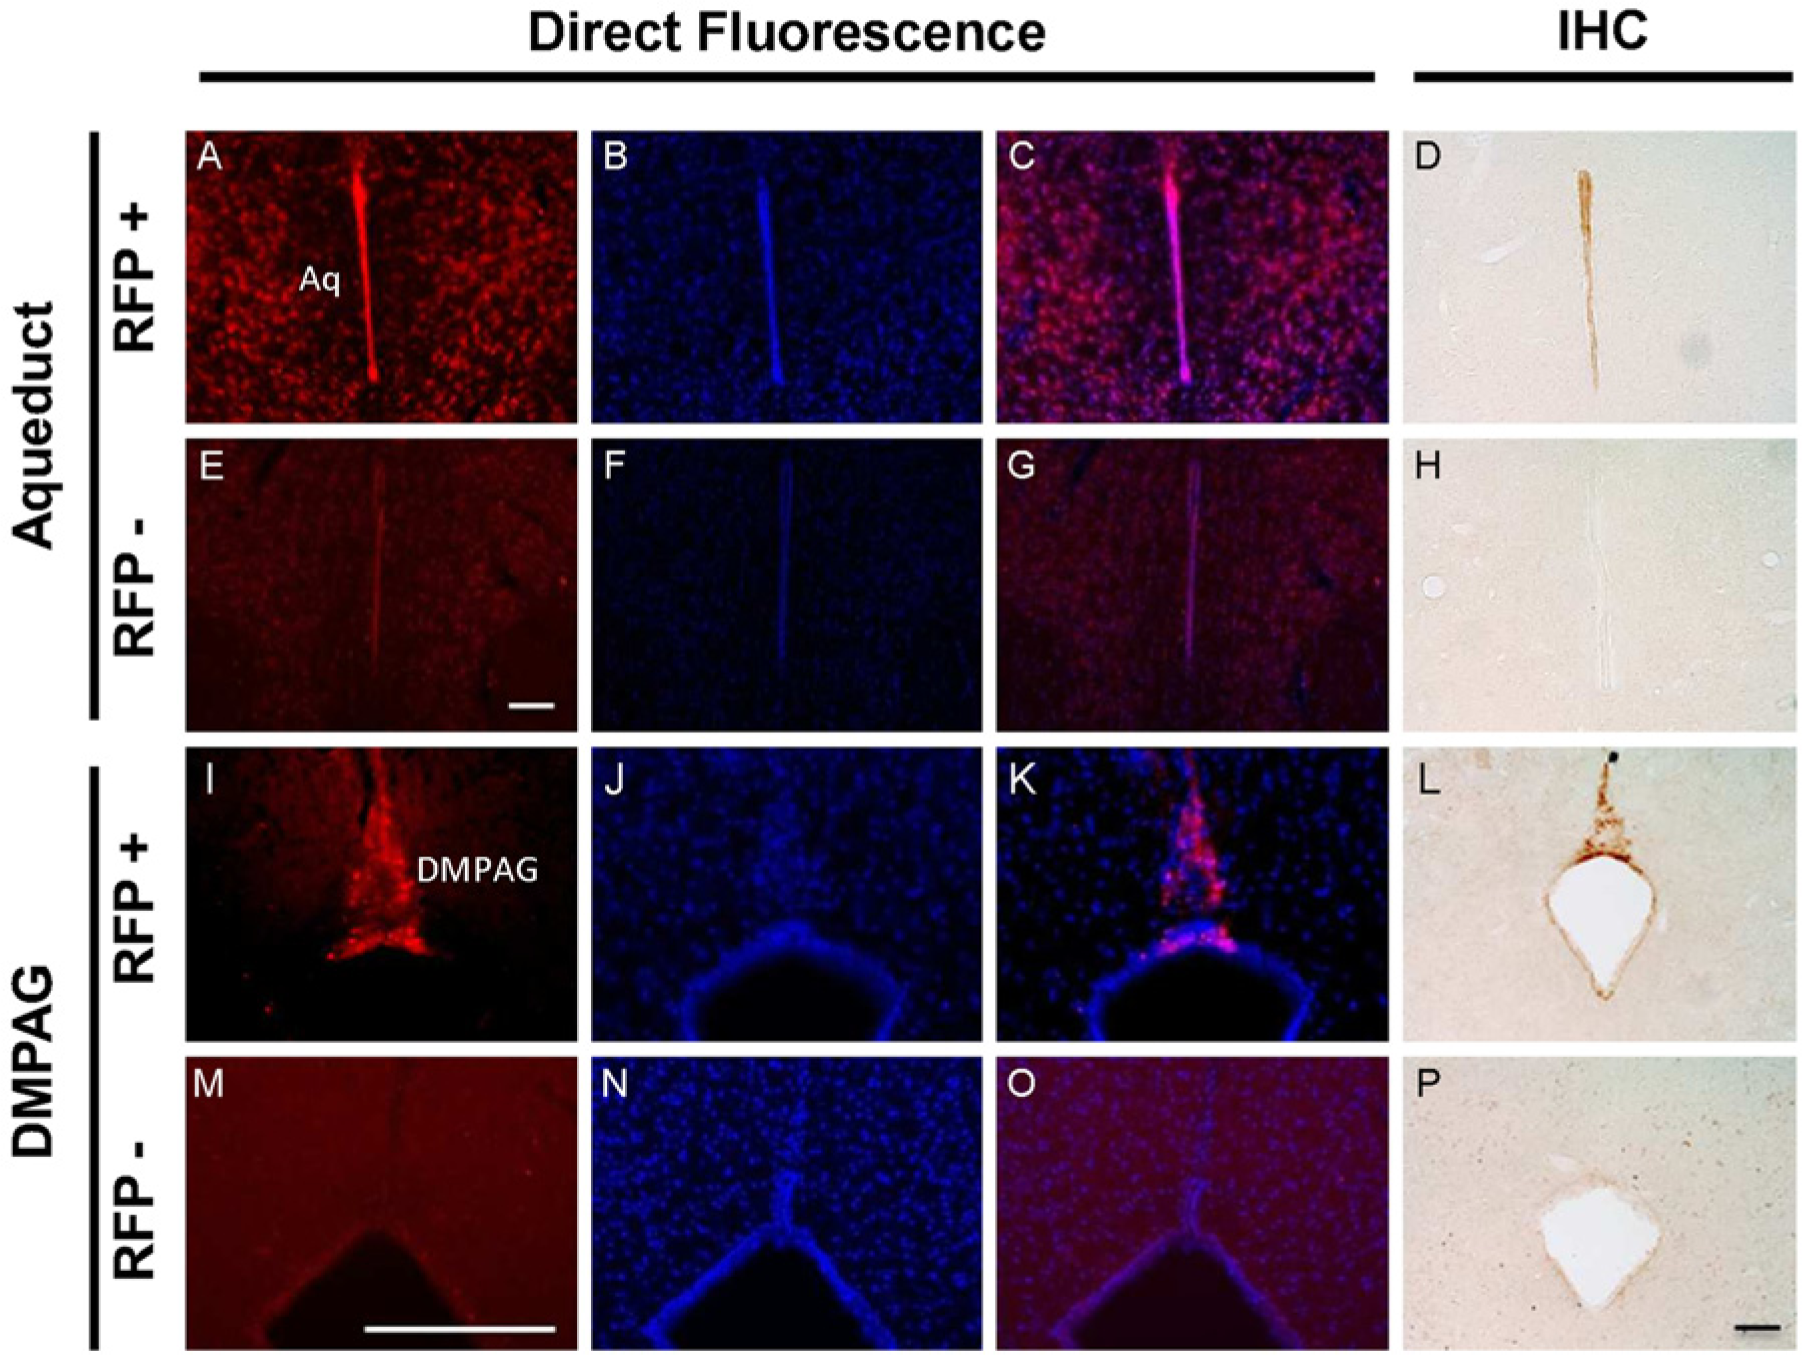
Expression of RFP-MT1 in the aqueduct and the dorsomedial periaqueductal gray. Direct fluorescence microscopy revealed expression of RFP-MT1 in the aqueduct (A) and the dorsomedial periaqueductal gray in sections of fA mice (I) but not in negative littermate brain sections (E and M). DAPI nuclear staining in negative littermate sections (F and N) and fA mice sections (B and J) showed no merging (G and O) and merging (C and K), respectively, with RFP expression. The expression of RFP-MT1 was confirmed using direct immunohistochemistry in the aqueduct (D and H) and the dorsomedial periaqueductal gray (L and P). Scale bars are 100 µm (E and P) and 200 µm (M).
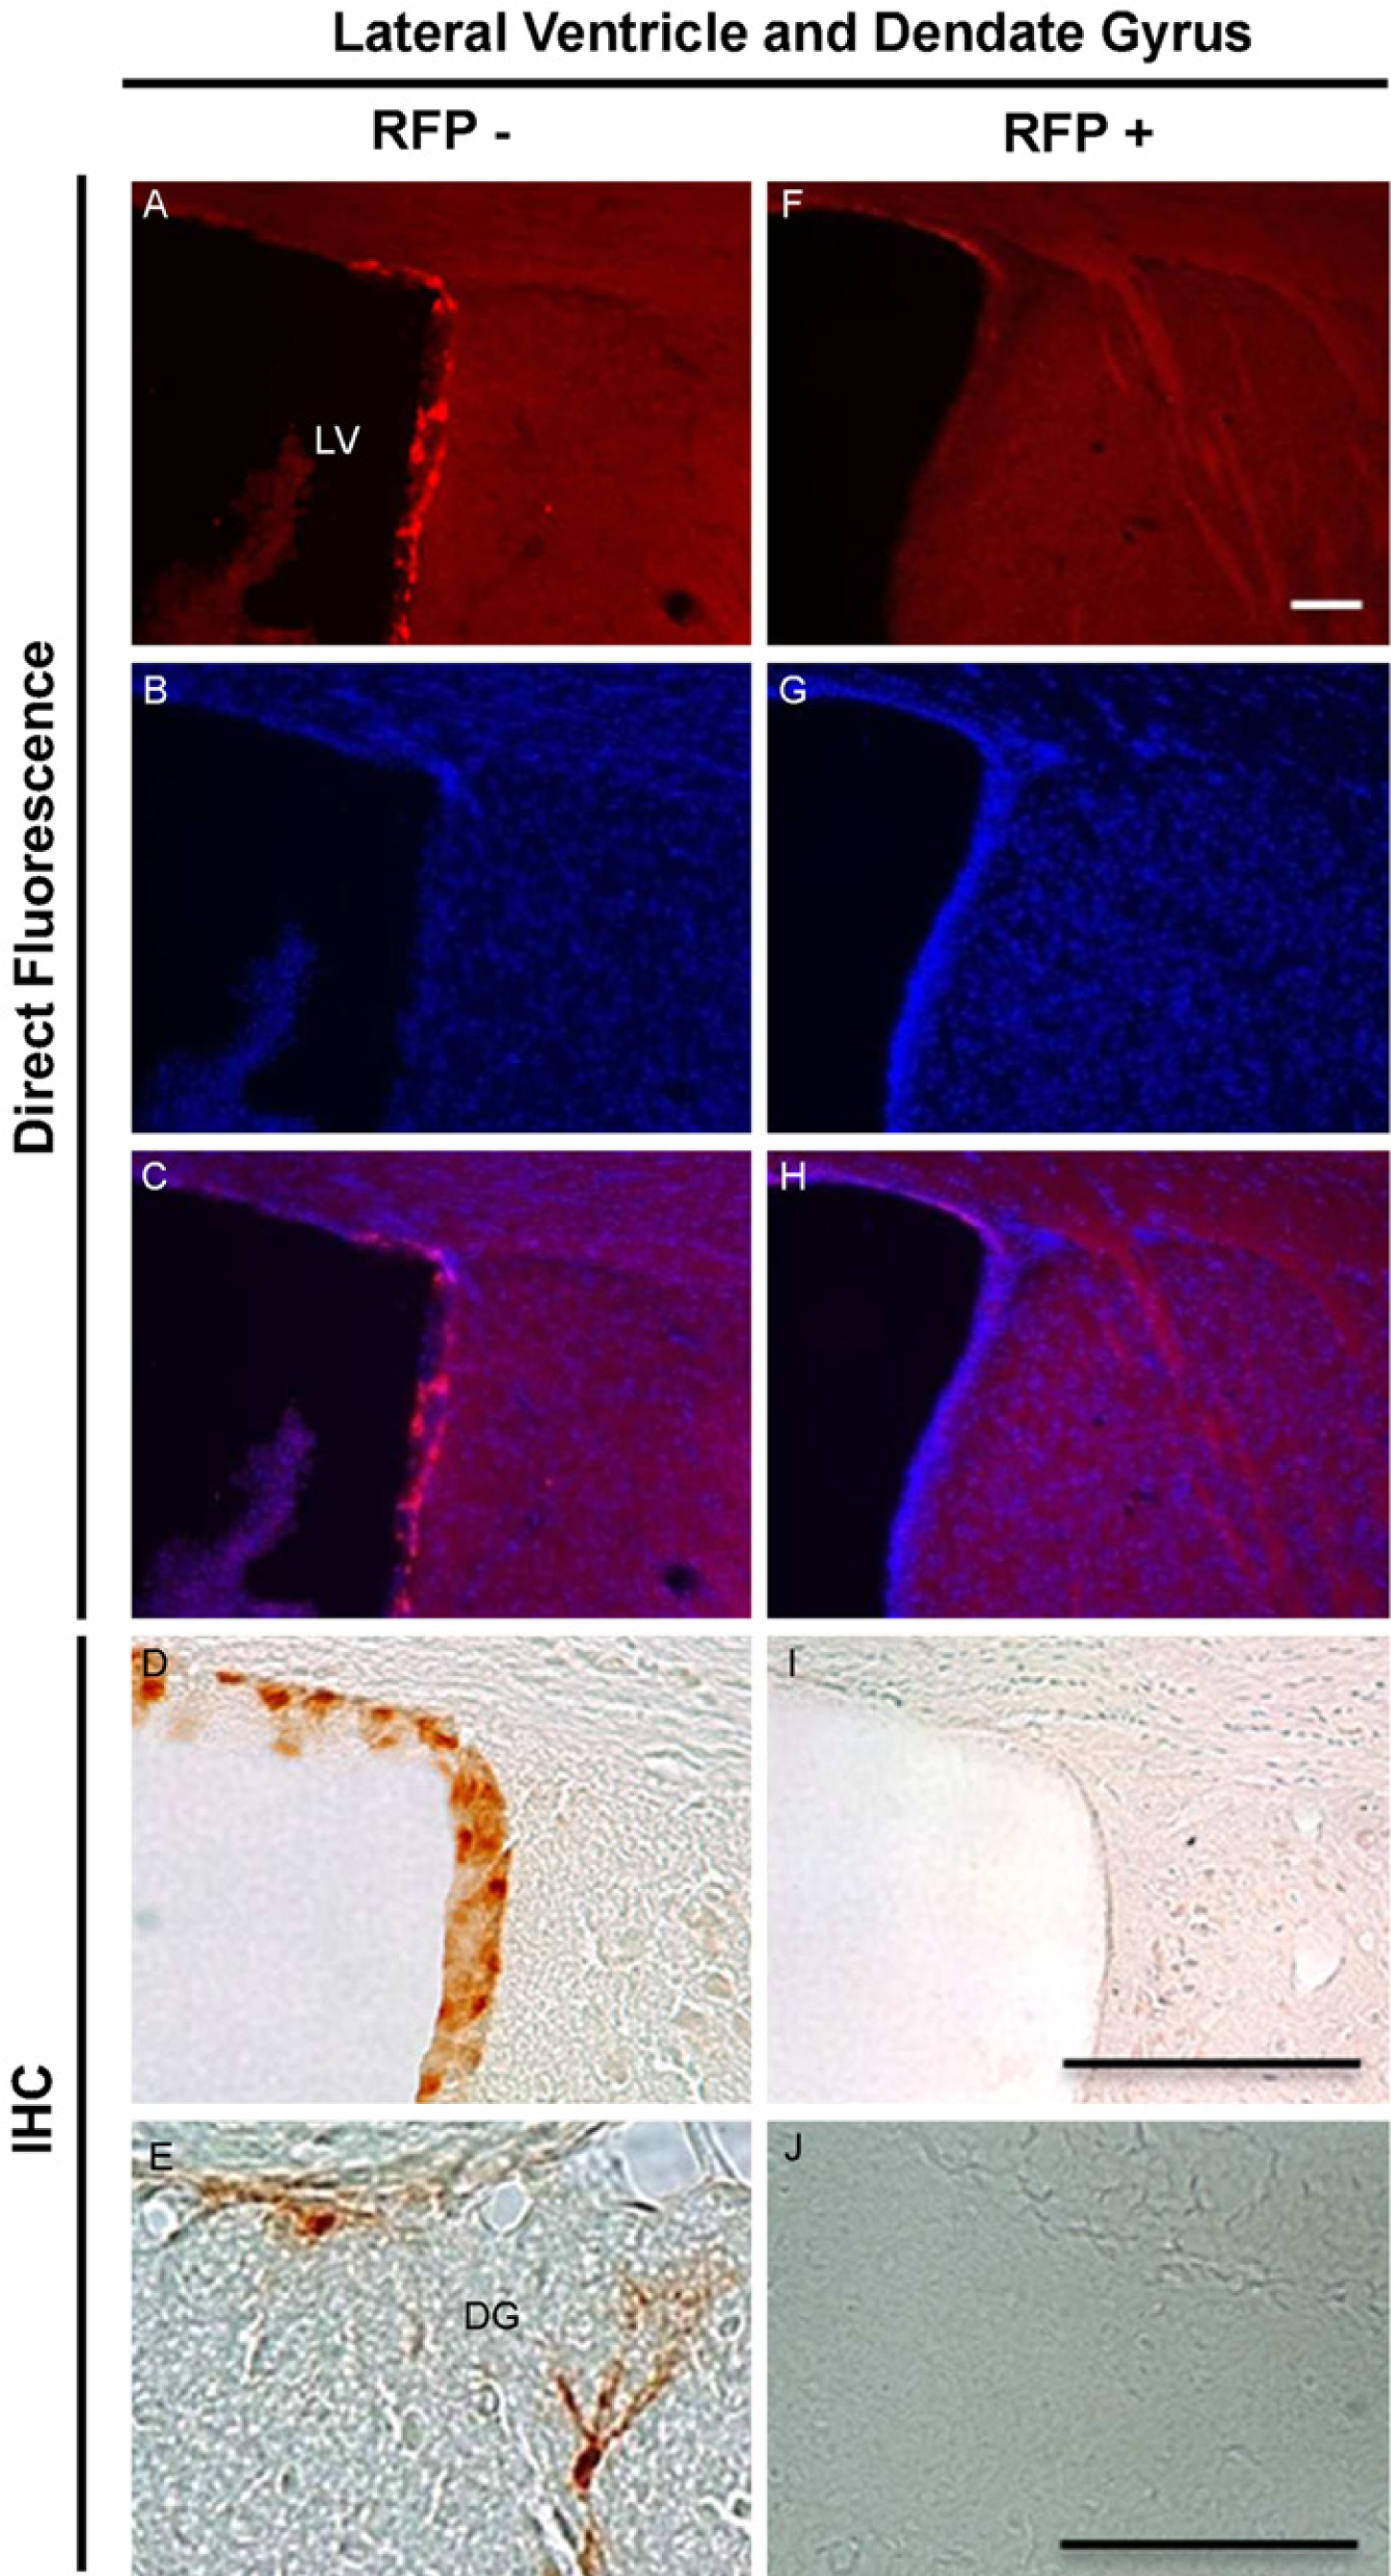
RFP-MT1 expression in the lateral ventricle and the hippocampus. RFP-MT1 was expressed in the ependymal lining the lateral ventricle. Direct fluorescence was observed in sections of fA mice (A) compared with negative littermates that did not show any RFP-MT1 expression (F); DAPI nuclear staining in fA mice (B) and wild type (G) sections, respectively, merged (C) and did not merge with RFP expression (H). The expression of RFP-MT1 in the lateral ventricle of fA mice was confirmed using immunohistochemistry (D and I). Isolated cells in the dentate gyrus of the hippocampus also expressed RFP-MT1 (E and J). Scale bars are 100 µm (F and J) and 200 µm (I).
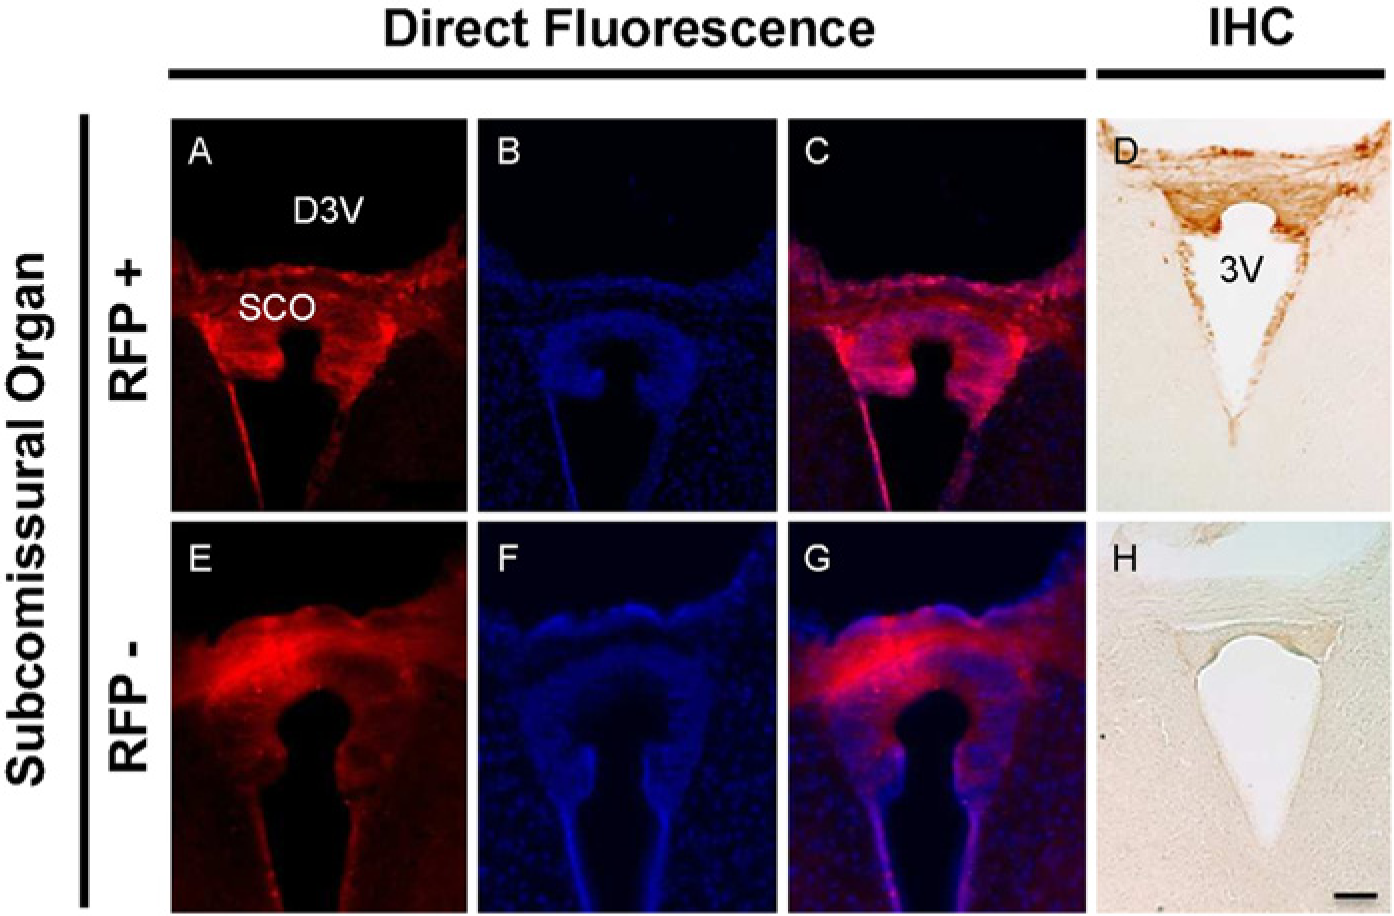
Expression of RFP-MT1 in the subcommissural organ of the dorsal third ventricle. Direct fluorescence microscopy in negative littermate tissue (E) showed no RFP expression whereas fA mice tissues (A) expressed RFP in the subcommissural organ of the third ventricle. DAPI nuclear staining in fA mice (B) merged with RFP expression (C) but did not merge in negative littermate tissues (F and G). The expression of RFP-MT1 was confirmed using direct immunohistochemistry in the subcommissural organ of the third ventricle using antibody targeted against RFP (D and H). Scale bar is 100 µm (H).
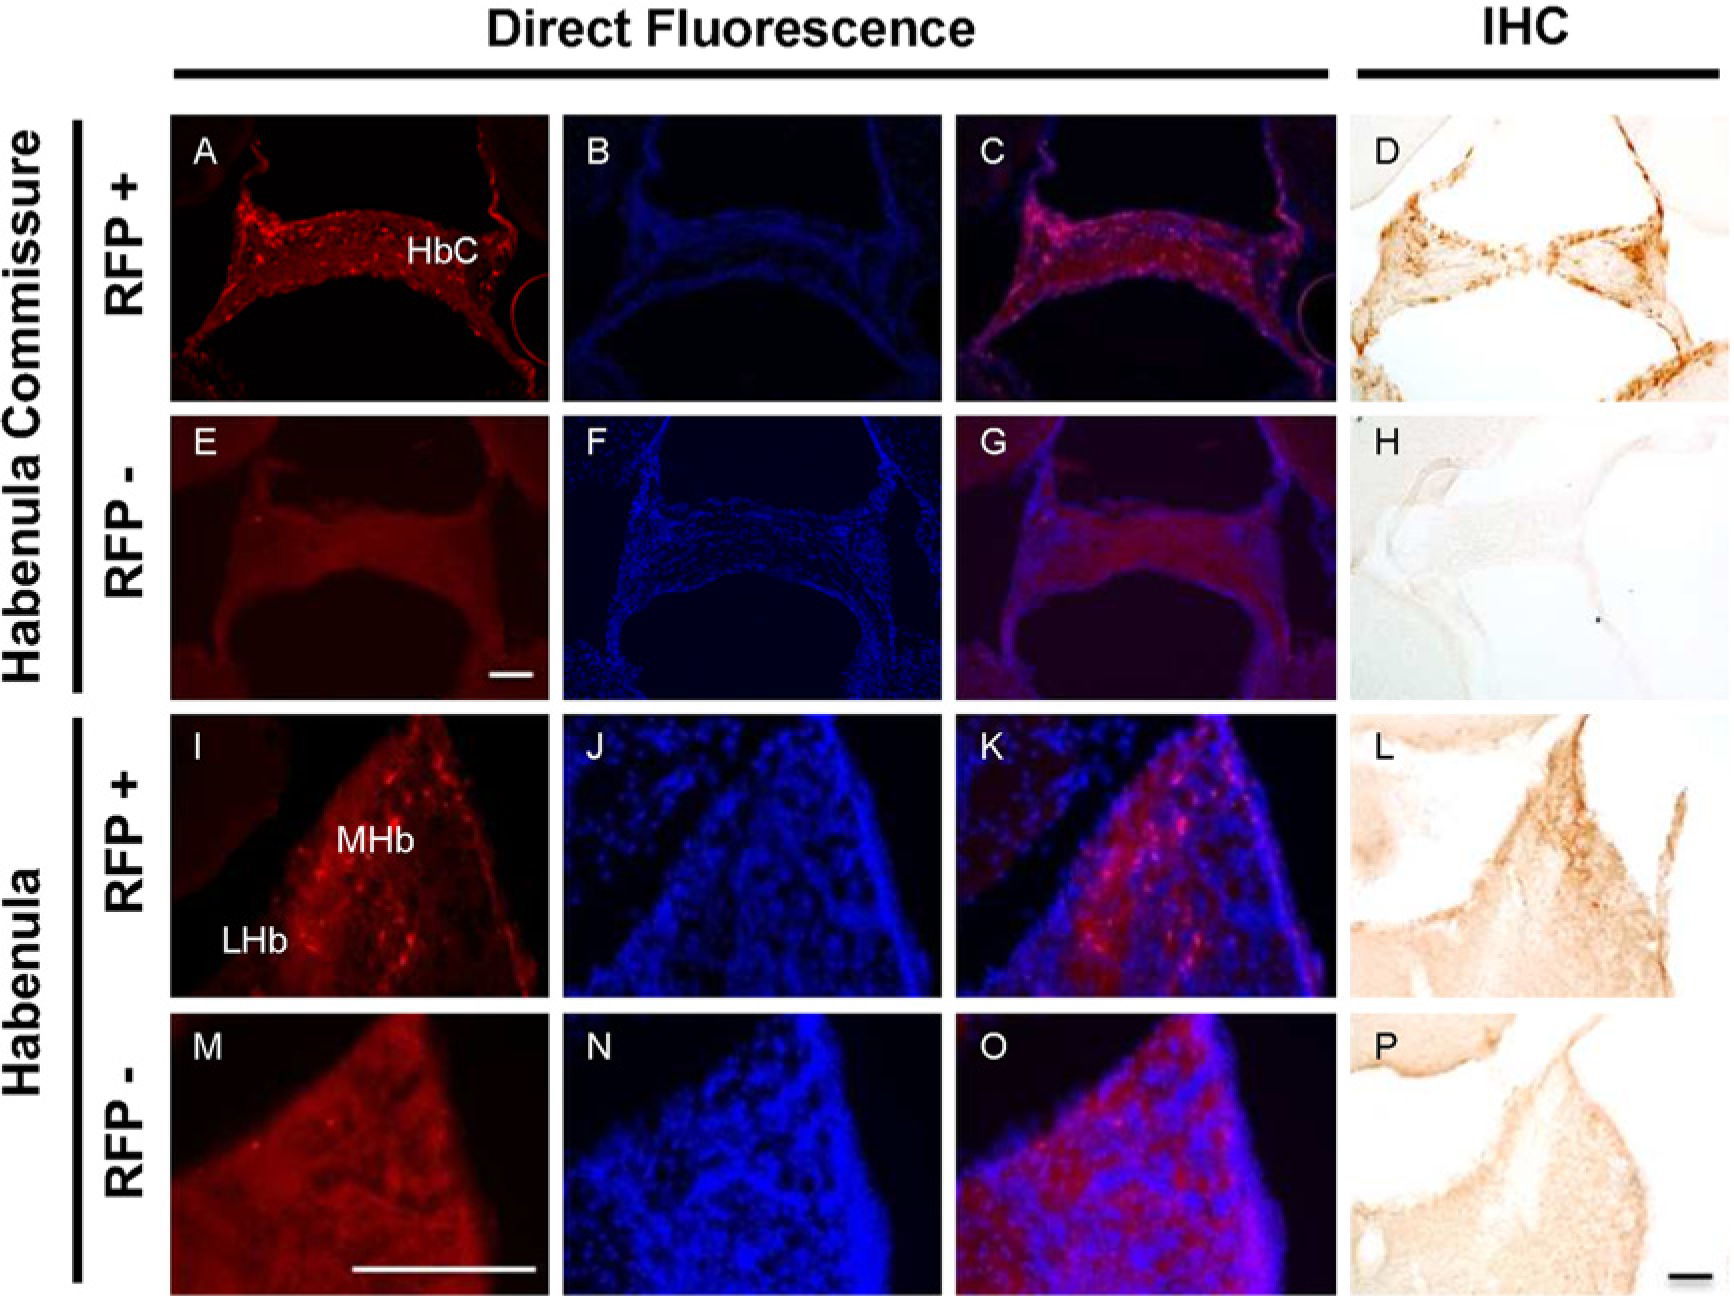
Expression of RFP-MT1 in the habenula commissure and the habenula. Direct fluorescence of RFP was detected in the habenula commissure of fA mice sections (A) but not in negative littermates sections (E). DAPI nuclear staining in fA mice (B) and negative littermate (F) sections merged (C) or did not merge with RFP expression (G), respectively. The expression of RFP-MT1 was confirmed with immunohistochemistry in the habenula commissure using an antibody targeted against RFP (D and H). Direct fluorescence of RFP-MT1 was also expressed in the habenular tissues of fA mice (I) but not in negative littermate habenular tissues (M). The expression of RFP was restricted to the medial habenula (MHb). DAPI nuclear staining in habenular sections of negative (N) and fA (J) littermates did not merge (O) or merged with RFP expression (K), respectively. The expression of RFP-MT1 was confirmed using immunohistochemistry in the habenula (L and P). Scale bars are 100 µm (E and P) and 200 µm (M).
DAPI staining was used to visualize the cell nucleus in brain sections of fA mice (Fig. 2B, 3B, 4B, 4J, 5B, 6B, 7B and 7J) and negative littermates (Fig. 2G, 3H, 4F, 4N, 5G, 6F, 7F and 7N). Colocalization of DAPI with RFP-MT1 suggests MT1 melatonin receptor cellular expression in the specific areas under study. Expression of RFP-MT1 was confirmed in cerebellum (Fig. 2D and 2I), pars tuberalis (Fig. 3E and 3J), aqueduct (Fig. 4D and 4H), DMPAG (Fig. 4L and 4P), lateral ventricle (Fig. 5D and 5I), SCO (Fig. 6D and 6H), habenula commissure (Fig. 7D and 7H) and habenula (Fig. 7L and 7P) areas of the fA mice brain by immunohistochemistry using an antibody targeted against RFP-MT1 followed by DAB staining.
Expression of RFP-MT1 in the Brain of fA Transgenic Mice
Direct fluorescence microscopy showed heterogeneous RFP-MT1 expression in brain sections of fA transgenic mice. RFP-MT1 expression in brain areas of fA male and female mice was not significantly different. Below, we describe RFP-MT1 expression by direct fluorescence in different areas of the fA mice brain as compared with expression by immunohistochemistry.
Cerebellum: Direct fluorescence microscopy revealed a multilayer expression of RFP-MT1 in the cerebellum of fA mice (Fig. 2A and 2F). RFP-MT1 expression was found in the Purkinje cell, the molecular and the granular cell layers, with higher expression in the Purkinje cell layer. Expression in the molecular and the granular cell layers was sporadic and faint. Immunohistochemistry confirmed the expression of RFP-MT1 in all three layers of the cerebellum (Fig. 2D and 2I). Since the cerebellum showed the highest level of expression, we used it as a control for the characterization of the RFP antibody. No RFP expression was detected in the cerebellum of negative littermates, indicating that the antibody was specific (Fig. 2I).
Pars Tuberalis and Third Ventricle Lining: In the median eminence, the expression of the RFP-MT1 was restricted to the pars tuberalis (Fig. 3A and 3G). No expression of RFP-MT1 was found in the ventral wall of the third ventricle where the tanycytes are localized (Bruni 1998; Mathew and Singh 1989), or in the dorsal area. However, using immunohistochemistry, we detected cells expressing the RFP- MT1 in the ependyma lining the third ventricle dorsal wall (Fig. 3F and 3K).
Aqueduct and Dorsomedial Periaqueductal Gray (DMPAG): The ependyma lining the aqueduct and the DMPAG expressed RFP-MT1 in the brain of fA mice (Fig. 4A and 4I), which colocalized well with DAPI expression (Fig. 4C, 4K) in brain sections of fA mice. DAPI colocalization with RFP-MT1 was not observed in the brain sections of negative littermates (Fig. 4G and 4O).
Lateral Ventricle and Hippocampus: The expression of RFP-MT1 by direct fluorescence was found in the ependyma lining the lateral ventricle of fA mouse brains (Fig. 5A). The expression was restricted to the inner wall of the lateral ventricle where the subventricular zone (SVZ) of the hippocampus is located. In the hippocampus, we did not detect expression of RFP-MT1 using direct fluorescence. However, using immunohistochemistry we were able to detect isolated cells that express the RFP-MT1 in the dentate gyrus of the hippocampus in fA mice (Fig. 5E) as compared with negative mice brain tissues (Fig. 5J).
Dorsal Third Ventricle: A high expression of the RFP-MT1 was found in the subcommissural organ (SCO) of the dorsal third ventricle and in the ependyma lining the dorsal third ventricle of fA mice (Fig. 6A) as compared with negative mouse brain sections (Fig. 6E). DAPI nuclear staining in fA mice brain sections (Fig. 6B) colocalized with RFP-MT1 expression (Fig. 6C).
Habenula Commissure and Medial Habenula: The expression of RFP-MT1 was found in the habenula commissure of brain sections from fA mice (Fig. 7A) but not from negative mice (Fig. 7E). The habenula also showed high expression of the RFP-MT1 (Fig. 7I). RFP-MT1 expression in the habenula was restricted to the medial habenula as compared with the negative littermates (Fig. 7M). No RFP-MT1 expression was observed in the lateral habenula.
Suprachiasmatic Nucleus (SCN) and Striatum: To our surprise, specific RFP-MT1 expression was not detected in the SCN or striatum either by direct fluorescence microscopy or immunohistochemistry. This result contrasts with previous reports that showed specific 2-[125I] iodomelatonin binding and MT1 melatonin receptor mRNA in the C3H/HeN mouse SCN (Siuciak et al. 1990; Uz et al. 2005).
Discussion
In this study we generated and characterized a BAC transgenic mouse line expressing red fluorescence protein (RFP) under the control of the endogenous MT1 promoter so that cells expressing the MT1 melatonin receptor are filled with RFP. Expression of the RFP-MT1 was found in different areas of the brain including cerebellum, pars tuberalis, third ventricle, aqueduct, lateral ventricle, dorsal third ventricle, medial habenula, habenula commissure and isolated cells in the dentate gyrus of the hippocampus, but not in the SCN and the striatum. This BAC transgenic mouse represents a tool that can be used to map the cellular expression patterns of the MT1 melatonin receptor and further determine its roles played in these cells by measuring their responses to extrinsic stimuli in intact tissues or in animal models in vivo.
The transgenic mice are viable, display a normal circadian phenotype and do not show physical deficiencies (data not shown). Inserting and overexpressing the modified BAC-containing sequences did not alter the mouse, and yielded a grossly normal C3H/HeN phenotype. The fA transgenic mice line we used was selected to establish our colony and further characterize MT1 because it showed a higher expression of RFP-MT1 as compared with the two other lines we generated, which showed generally similar expression patterns. We confirmed that the red fluorescence signal we observed in the fA mice indeed came from RFP and not autofluorescence, by performing direct immunohistochemistry on the same brain sections using a single biotinylated antibody targeting RFP-containing cells. The signals from the direct fluorescence and immunohistochemistry localized to the same anatomical structures, suggesting that observations from direct fluorescence microscopy represent RFP expression likely in cells expressing endogenous MT1 melatonin receptors. Initial direct fluorescence and immunohistochemistry in some peripheral tissues, including the kidney, the heart and the skin, did not provide specific RFP-MT1 promoter driven RFP expression signal in those tissues (Adamah-Biassi and Dubocovich, unpublished observations).
In the cerebellum of fA transgenic mice, RFP-MT1 was expressed in the Purkinje cell, molecular, and granular layers, indicating that the MT1 melatonin receptor might be expressed in all three layers of the cerebellum. A previous study using 2-[125I]-iodomelatonin binding assay showed that melatonin receptors were expressed in the cerebellum of rats, but the binding localization was restricted to the Purkinje cell and molecular layers (Laudon et al. 1988). In human cerebellar tissue, the binding of 2-[125I]-iodomelatonin was more dispersed and the MT1 mRNA was expressed in the granular cell layer and the basket-stellate cell layer (Al-Ghoul et al. 1998). In our study, RFP-MT1 expression localized to the granular layer of the cerebellum, which is supported by previous studies using the 2-[125I]-iodomelatonin binding assay and in situ hybridization/RT- PCR for MT1 mRNA in human and mouse cerebellar tissue (Al-Ghoul et al. 1998; Imbesi et al. 2008a; Imbesi et al. 2008b; Imbesi et al. 2008c; Mazzucchelli et al. 1996; Poirel et al. 2003). Although signaling of the MT1 and MT2 melatonin receptors has been studied in some of the cells of the cerebellum (Imbesi et al. 2008a), their role in the function of the cerebellum remain to be elucidated.
Expression of the RFP-MT1 was also found in the pars tuberalis and the ependyma lining the dorsal area of the third ventricle wall. Expression of melatonin receptors in the pars tuberalis has previously been reported using 2-[125I]-iodomelatonin binding (Vaněček 1988), in situ hybridization (Klosen et al. 2002) and RT-PCR for MT1 mRNA (Guerrero et al. 1999; Poirel et al. 2003). The expression of RFP-MT1 within the pituitary gland was restricted to the pars tuberalis of the median eminence. The function of the MT1 melatonin receptor in the pars tuberalis is relatively well characterized. Activation of the MT1 melatonin receptor in this area regulates expression of clock genes (Dardente et al. 2003; Jilg et al. 2005; Von Gall et al. 2005) and inhibits prolactin and gonadotropin releasing hormone secretion (Roy and Belsham 2002).
Expression of RFP-MT1 in the ependyma lining the dorsal wall of the third ventricle suggests for the first time the presence of the MT1 melatonin receptor in this region. The ependyma lining the third ventricle wall and the pars tuberalis expresses the melatonin-related receptor gene GPR50 (Sidibe et al. 2010). GPR50 can dimerize with the MT1 melatonin receptor to inhibit its binding to melatonin and/or coupling to G proteins (Levoye et al. 2006). It is possible that together these two receptors modulate some of the function of the third ventricle wall especially the role of this region in energy metabolism (Contreras-Alcantara et al. 2010; Ivanova et al. 2008).
In the aqueduct, the expression of the RFP-MT1 was found in the ependymal lining of the caudal aqueduct and the rostral dorsomedial periaqueductal gray (DMPAG) of the aqueduct. The localization of 2-[125I]-iodomelatonin–specific binding was previously found in the cerebral aqueduct of wild type rats with inherited hydrocephalus (Aggelopoulos et al. 1997), indicating that the melatonin receptor might play a role in the function of the aqueduct and the DMPAG. The DMPAG is part of the periaqueductal gray (PAG) where neural connections from many areas of the forebrain, including the amygdala and the hypothalamus, converge (Rizvi et al. 1991; Vianna and Brandão 2003). The DMPAG is involved in a variety of functions including modulation of pain, analgesia, fear and anxiety, fear vocalization, lordosis behavior and cardiovascular function (Behbehani 1995; Rossi et al. 1994). Lesion of the DMPAG modulates fear and anxiety induced by stimulation of the amygdala (Behbehani 1995). Through its receptors, melatonin increases GABA neurotransmission (Prada et al. 2005) in the DMPAG, an area with high expression of GABAergic neurons and receptors (Behbehani 1995; Reichling and Basbaum 1990). This evidence indicates that both the presence of the MT1 melatonin receptor and GABA receptors in the DMPAG might play a role in pain, fear and anxiety. Indeed, melatonin is known to modulate pain in this area (Ambriz-Tututi et al. 2009).
RFP-MT1 is also expressed in the ependyma lining the inner part of the lateral ventricle where the subventricular zone (SVZ) is located. Precursor cells isolated from the mouse SVZ express melatonin receptors, which play a role in cell proliferation and differentiation (Sotthibundhu et al. 2010). Further, we found that RFP-MT1 is also expressed in isolated cells in the dentate gyrus of the hippocampus. This result is consistent with previous studies that demonstrated the expression of MT1 melatonin receptor mRNA in the hippocampus by RT-PCR and electrophysiological techniques (Musshoff et al. 2002; Ramirez-Rodriguez et al. 2009).
A high expression of the RFP-MT1 was found in the dorsal third ventricle area, specifically in the subcommissural organ (SCO) and the lining of the dorsal third ventricle wall, indicating that the MT1 melatonin receptor might be expressed in the cells of the SCO and the dorsal third ventricle wall. The SCO is mainly composed of ependymal cells that secrete glycoproteins and participate in modulating cerebrospinal fluid circulation (Meiniel 2007; Perez-Figares et al. 2001). These studies suggest a role for melatonin in the modulation of hormone secretion from the SCO to other areas of the brain.
The habenula and the habenula commissure show high cellular expression of RFP-MT1. The RFP-MT1 expression in the habenula was restricted to the medial habenula. Previous studies showed 2-[125I]-iodomelatonin binding in the hamster (Weaver et al. 1989) and mouse habenula (Ginter et al. 2005). The habenula plays a role in pain processing, reproductive behavior, nutrition, sleep-wake cycles, stress responses, and learning (Andres et al. 1999). Recent evidence also supports a role for the medial habenula in depressive- and anxiety-related behaviors (Lee et al. 2010). The presence of the MT1 melatonin receptor in the medial habenula suggests its participation in the regulation of sleep, depression, anxiety and reproductive behaviors. As a matter of fact, deletion of the MT1 melatonin receptor induces depressive behavior and sensorimotor gating in the prepulse inhibition test (Weil et al. 2006). In addition, in hamsters that express only MT1 melatonin receptors (Weaver et al. 1996), the MT1 melatonin receptor signaling is sufficient and necessary to mediate the effects of photoperiod-driven changes to behavior and reproductive function (Prendergast 2010). In mice, melatonin regulates dio2 and dio3 through the MT1 receptor to transmit photoperiodic information to the hypothalamo–hypophysial axis (Yasuo et al. 2009).
Technical considerations: Direct fluorescence of RFP-MT1-expressing cells was not found in the hippocampus and the ependyma lining the third ventricle wall; however, cells expressing RFP-MT1 were detected using immunohistochemistry. Fast RFP photobleaching as a result of absorption of light excitation during tissue and/or sample processing could affect visualization of direct fluorescence. Chromatic and spherical aberration could also hinder the visualization of RFP-MT1 direct fluorescence. In this study, we use non-fluorescent immunohistochemistry with an RFP antibody to visualize MT1 RFP expression even when MT1 RFP was not detected by direct fluorescence
We did not find expression of MT1 promoter-driven RFP expression in the SCN or the striatum. Previous studies showed that both the MT1 and MT2 melatonin receptor genes are expressed in the SCN (Dubocovich et al. 1998; Liu et al. 1997; Masana et al. 2000) and striatum (Ginter et al. 2005; Uz et al. 2003). The lack of expression of the transgene in these areas could be because of a number of reasons. First, the key cis-elements that regulate the expression of the endogenous MT1 gene in these brain regions may be included in the BAC clone we used to generate the fA mice. Although the BAC clone contains an ~200 kb fragment surrounding the MT1 protein-coding region, and therefore is likely to contain most regulatory elements, it is possible that some elements—those which regulate MT1 expression in the SCN and striatum—lie outside this region. Second, the transgene may have integrated into a chromosomal location where the gene expression is repressed in these brain regions. As it is well accepted that host sequences around the transgene integration site can modify the expected expression pattern rendering it weak or even undetectable (Wilson et al. 1990), and it is plausible that the neighboring sequence may have repressed the expression of the transgene. Finally, MT1 mRNA and protein may linger in these brain regions long after its transcription ceases. As RFP expression in our transgenic mice represents the transcriptional activity of the MT1 gene, it is possible that MT1 promoter is transiently activated, producing MT1 mRNA and protein that outlive RFP whose expression is driven by the same transcriptional machinery.
Conclusion
The distribution of the RFP-MT1 expression in the brain of fA BAC transgenic mice localized to areas showing 2-[125I]-iodomelatonin binding, and mRNA expression also revealed new areas where the MT1 melatonin receptor might be expressed (Fig. 8). The overall expression of RFP-MT1 is more restricted than those detected by 2-[125I]-iodomelatonin binding (Siuciak et al. 1990; Weaver et al. 1989). Limitations inherent to the different techniques used to detect the expression of the MT1 melatonin receptor may explain the discrepancy between the transgenic RFP expression, 2-[125I]-iodomelatonin binding and in situ hybridization of MT1 mRNA (Fig. 8). RFP expression, driven by the MT1 promoter, fills the entire cells, including dendritic and axonal projections, providing a useful tool to identify cells likely expressing the MT1 receptor. The subcellular localization of the MT1 receptor cannot be inferred using the fA mouse. Instead, a mouse with a transgene containing an RFP insertion at the stop codon of the MT1 receptor gene will allow subcellular MT1 melatonin receptor localization, providing a complementary tool to investigate MT1 receptor trafficking. Morphological, physiological and cellular characterization of the cells expressing RFP-MT1 in the different areas of the brain will be useful to further understand the function of the MT1 melatonin receptor particularly in the mouse.
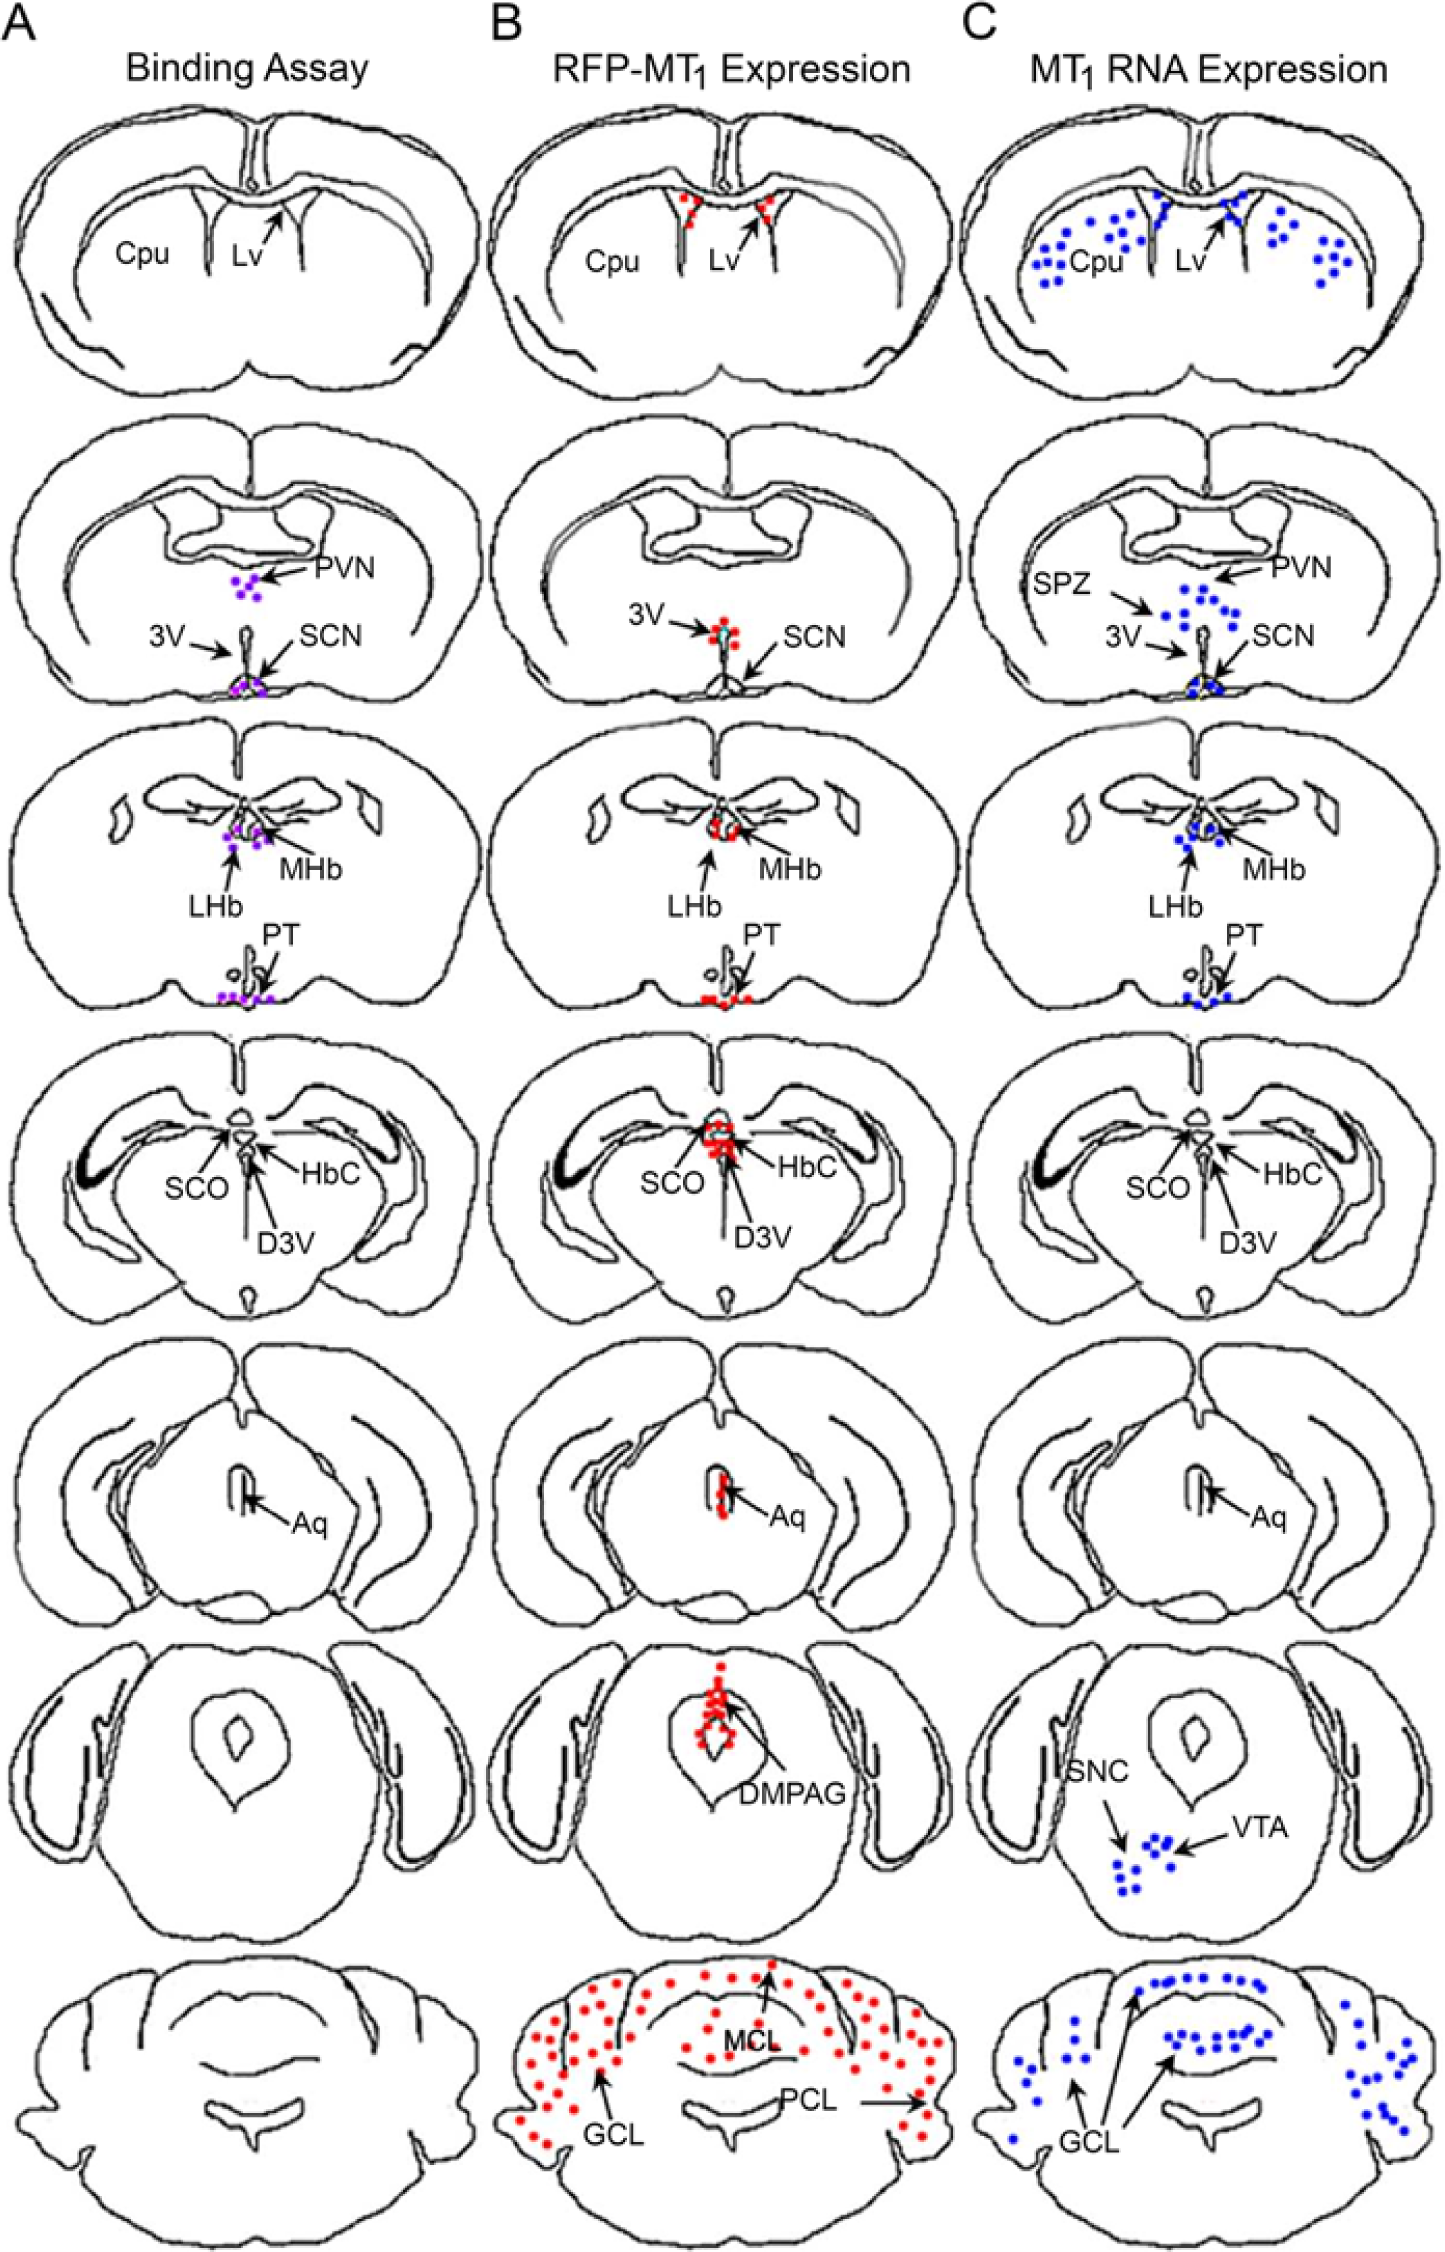
2-[125I]-Iodomelatonin binding, RFP-MT1 expression and MT1 RNA expression in different areas of the mouse brain. Lucida images of brain sections were drawn rostral to caudal showing areas where 2-[125I]-iodomelatonin binding (A), RFP-MT1 expression (B) and MT1 RNA expression (C) have been found according to data from our laboratory or in the literature. The purple, red and blue dots respectively indicate 2-iodomelatonin binding, MT1 expression using the fA transgenic mice and MT1 RNA expression using PCR or in situ hybridization. Acronyms used are: Cpu (Caudate Putamen or Striatum); Lv (Lateral ventricle); 3V (Third ventricle); PVN (Paraventricular Nucleus); SCN (Suprachiasmatic Nucleus); SPZ (Subparaventricular Zone); MHb (Medial Habenula); LHb (Lateral Habenula); PT (Pars Tuberalis); SCO (Subcommisural Organ); HbC (Habenula Commissure); D3V (Dorsal Third Ventricle); Aq (Aqueduct); DMPAG (Dorsomedial Periaqueductal Gray); SNC (Substantia Nigra); VTA (Ventral Tegmentum); GCL (Granular Cell Layer); MCL (Molecular Cell Layer); PCL (Purkinje Cell Layer).
Footnotes
Acknowledgements
We are indebted to Jeanie Ramos for making the original RFT-MT1 construct, to Ms. D. Ren for invaluable technical advice on molecular techniques, and to Ms. Iwona Stepien for technical assistance with animal management. We thank Ms. Lynn Doglio (Northwestern University Transgenic Core Facility) for generating mice carrying the RFP-MT1 transgene.
Declaration of Conflicting Interests
The author(s) declared no potential conflicts of interest with respect to the research, authorship, and/or publication of this article.
Funding
The author(s) disclosed receipt of the following financial support for the research, authorship, and/or publication of this article: This work was supported by R01 MH 42922 to MLD.