
Abstract
Growth arrest specific 1 (GAS1) is a pleiotropic protein that induces apoptosis and cell arrest in different tumors, but it is also involved in the development of the nervous system and other tissues and organs. This dual ability is likely caused by its capacity to interact both by inhibiting the intracellular signaling cascade induced by glial cell-line derived neurotrophic factor and by facilitating the activity of the sonic hedgehog pathway. The presence of GAS1 mRNA has been described in adult mouse brain, and here we corroborated this observation. We then proceeded to determine the distribution of the protein in the adult central nervous system (CNS). We detected, by western blot analysis, expression of GAS1 in olfactory bulb, caudate-putamen, cerebral cortex, hippocampus, mesencephalon, medulla oblongata, cerebellum, and cervical spinal cord. To more carefully map the expression of GAS1, we performed double-label immunohistochemistry and noticed expression of GAS1 in neurons in all brain areas examined. We also observed expression of GAS1 in astroglial cells, albeit the pattern of expression was more restricted than that seen in neurons. Briefly, in the present article, we report the widespread distribution and cellular localization of the GAS1 native protein in adult mammalian CNS.
Keywords
Introduction
Growth arrest specific 1 (GAS1) is a pleiotropic protein originally associated with cell arrest, although more recently it has also been linked with different functions during development and in the adult organism. The GAS1 gene was originally isolated from a cDNA subtraction library from serum starved NIH-3T3 mouse cells (Schneider, King, and Philipson 1988). It is an intronless gene, suggesting it originated from a retrotransposon (Hatinen, Holm, and Airaksinen 2007), and it codes for a protein that is glycosylphosphatidylinositol (GPI)-linked to the outer cell membrane (Stebel et al. 2000). Because of its capacities to arrest cell growth and induce apoptosis, GAS1 becomes interesting as a potential adjuvant for the treatment of cancer.
Two main molecular mechanisms have been proposed to explain the effects of GAS1. We have previously demonstrated that the targeted expression of GAS1 induces cell arrest and apoptosis of tumors of glial origin (Zamorano et al. 2003; Zamorano et al. 2004; Benitez et al. 2007; Dominguez-Monzon et al. 2009). GAS1 induces cell arrest and apoptosis because of its molecular similarity with the receptors for the glial cell-line derived neurotrophic factor (GDNF) family of ligands (GFRαs), which allows GAS1 to inhibit the intracellular survival signaling evoked by GDNF (Schueler-Furman et al. 2006; Lopez-Ramirez et al. 2008; Zarco et al. 2012; Dominguez-Monzon et al. 2011). However, there is also evidence for the interaction of GAS1 with sonic hedgehog (SHH) and Indian hedgehog (IHH), related hedgehog (HH) proteins (McLellan et al. 2008). This interaction was originally interpreted as antagonistic, but more recent work indicates this to be a cooperative effect between these two molecules (Lee, Buttitta, and Fan 2001; Allen, Tenzen, and McMahon 2007; Martinelli and Fan 2007; Allen et al. 2011; Izzi et al. 2011). Alterations in this interaction have been associated with developmental abnormalities, such as craniofacial malformations in rodents (Seppala et al. 2007) and holoprosencephaly in humans (Martinelli and Fan 2009; Ribeiro et al. 2010). It is interesting that we have also observed that GAS1 is capable of inducing cell arrest and apoptosis of human gliomas, in the absence of SHH (Dominguez-Monzon et al. 2009). These data indicate that GAS1 is a pleiotropic molecule whose functions differ depending on the cellular context. To support this statement, recent reports associate GAS1 with muscle differentiation (Leem et al. 2011), heart development (Xie et al. 2012), the processing of ß-amyloid (Chapuis et al. 2011; Chapuis et al. 2012), and the proliferation of mesangial cells in the kidney (van Roeyen et al. 2013).
Considering the previous information, particularly the expression of GAS1 during development, it becomes relevant to determine whether GAS1 is present and exerts a function in the adult brain. Although the article reporting the cloning of the GAS1 gene showed, as determined by northern blot analysis, almost undetectable expression of this gene in adult mouse brain (Schneider, King, and Philipson 1988), there were data showing the expression of GAS1 in the brain of the developing mouse (Lee and Fan 2001; Liu, May, and Fan 2001) and also the expression of GAS1 mRNA, determined by in situ hybridization, in mouse adult brain and spinal cord (www.brain-map.org; www.Genepaint.org; www.stjudebgem.org). As a first step to understanding the function of GAS1 in the adult brain, we deemed it pertinent to systematically examine the expression of both GAS1 mRNA and GAS1 protein in the adult mouse central nervous system (CNS). In this article, we report the expression of GAS1 mRNA in adult brain, determined by RT-PCR, and of the protein assayed by both western blot analysis and immunohistochemistry. Furthermore, we observed that GAS1 is extensively expressed in neurons, as determined by its co-expression in neuronal nuclei (NeuN)-positive cells, but that it is also found in astroglial cells, albeit with a more restricted pattern of expression. The present data show a widespread distribution of GAS1 in adult brain, thus pointing toward a major, hitherto not elucidated, function(s) of GAS1 in the adult nervous system.
Materials & Methods
Cell Culture
NIH-3T3 mouse fibroblast cells were maintained at 37C in 95% air 5% CO2 in DMEM high glucose (Gibco; Carlsbad, CA) supplemented with 10% fetal bovine serum (Gibco), 100 IU/ml of penicillin, and 100 µg/ml of streptomycin (Invitrogen; Carlsbad, CA). Cells were seeded, and for some experiments, complete medium was withdrawn after 48 hr in culture and replaced with medium with low serum (0.5%) for up to 96 hr.
Animal Subjects
Experiments were performed according to current Mexican legislation NOM-062-ZOO-1999 (SAGARPA) and in agreement with the Guide for the Care and Use of Laboratory Animals of the National Institutes of Health (NIH) and internal (Cinvestav) guidelines. Ten-week-old CD1 male mice were maintained with ad libitum access to food and water. To obtain tissue for RT-PCR and western blot analysis, mice were sacrificed by decapitation, the brains rapidly removed, and the different regions dissected on a cold glass plate under microscopic guidance; for its preservation, tissue was frozen at −70C until processing. For the immunohistochemistry assays, mice were injected with an overdose of pentobarbital (80 mg/kg) and perfused intracardially with saline, and the brains were fixed with 4% paraformaldehyde in phosphate-buffered saline (PBS) and post-fixed in the same solution for 24 hr, then in 20% sucrose PBS. Coronal and sagittal 25-μm-thick sections were cut in a cryostat and used for immunohistochemical assays.
RNA Extraction, RT-PCR, and Cloning
Total RNA from either NIH-3T3 cells or mouse brain tissue was isolated using Trizol reagent (Invitrogen). Subsequently, 5 μg of total RNA was treated with DNAse I (New England Biolabs; Ipswich, MA) following the manufacturer’s instructions and reverse-transcribed with M-MLV reverse transcriptase (Invitrogen) and 2 μl of the resulting cDNA amplified by PCR. The primers used to amplify GAS1 cDNA were the following: sense 5’CTGTGCCTGATGGCGCT GCTGC3’ and antisense 5’ACGCAGTCGTTGAGCAG CGCC3’. The PCR conditions were a denaturing step at 94C (1 cycle, 2 min), followed by 40 cycles at 94C (30 sec), 63C (30 sec), and 72C (30 sec) for denaturalizing, alignment, and extension, respectively, with a final extension step at 72C (1 cycle, 5 min). As a positive control, β-actin cDNA was amplified as previously described (Segovia, Vergara, and Brenner 1998; Cortez et al. 2000). For cloning, the PCR products (from NIH-3T3 cells, cerebellum, and whole brain) were purified from agarose gels, following the manufacturer’s instructions (QIAquick Gel Extraction Kit; QIAGEN, Hilden, Germany), and then ligated into the pCR4-TOPO vector (Invitrogen) using 4.5 μl (100 ng) of the PCR product, with 0.5 μl (5 ng) of the TOPO vector and 1 μl of the supplied salt solution. The reaction was gently mixed and incubated at room temperature for 10 min. Aliquots of the products of ligation (2 μl) were employed to transform TOP-10 competent cells. The recombinant clones were sequenced and compared with the mouse GAS1 mRNA sequence (NM_008086.1), with alignment performed using the Multalin software (Corpet 1998).
Western Blot Analysis
Total protein was obtained from NIH-3T3 cells by scraping the cells from the dishes in a lysis buffer containing a protease inhibitor cocktail (Complete; Roche Diagnostics, Indianapolis, IN) and from dissected brain tissue, using the same reagent. Protein quantification was performed using the bicinchoninic acid method (Pierce; Rockford, IL). Aliquots containing 50 μg of protein were run in 12% SDS-PAGE gels and transferred onto nitrocellulose membranes (BioRad; Hercules, CA). Membranes were washed with PBS, blocked with 6% nonfat milk diluted in Tris-buffered saline containing 0.1% Tween-20 (TBST) for 1 hr, and incubated in the presence of the GAS1 antibody. The GAS1 polyclonal antibody was raised in rabbit against a highly conserved GAS1 sequence, PRGSGLAHGRRLICWQA, and produced by ProSci Inc. (Poway, CA). For these assays, it was used at a dilution of 1:500 and incubated overnight at 4C; membranes were washed and incubated with a secondary antibody at a 1:5000 dilution (Jackson ImmunoResearch; West Grove, PA). As a control for protein loading, membranes were stripped and incubated with a monoclonal antibody against β-actin (Garcia-Tovar et al. 2001) as previously described (Lopez-Ramirez et al. 2008). Proteins were revealed with secondary peroxidase-coupled anti-rabbit (Jackson ImmunoResearch) and anti-mouse antibodies (Zymed, 1:5000; Invitrogen), respectively, using a Western Lightning Plus-ECL Kit (PerkinElmer; Waltham, MA). Images were digitally captured with a BioDoc-It Imaging System (UVP; Upland, CA).
Immunocytochemistry and Immunohistochemistry Assays
NIH-3T3 cells were grown on glass slides in complete serum or in low serum for different periods and fixed for 20 min at room temperature with 4% paraformaldehyde/PBS. Slides were blocked with 1% bovine serum albumin (BSA) (Sigma; St Louis, MO) for 20 min at room temperature in the presence of the GAS1 antibody previously described (1:200) at 4C overnight. Cells were washed and incubated at room temperature for 1 hr with a secondary fluorescent antibody (1:100) (Jackson ImmunoResearch) and then washed. As controls, cells were also incubated in the absence of the primary antibody, with pre-immune serum, and serum pre-absorbed with the GAS1 peptide. Cells were counterstained with DAPI to reveal the nuclei.
The expression of GAS1 was determined by immunohistochemistry in adult mouse brain, and to identify neurons and astroglial cells, double staining was performed for GAS1 and either NeuN as a neuronal marker or glial fibrillary acidic protein (GFAP) as a glial marker. Free-floating sections were incubated at room temperature for 1 hr in PBS/Triton X-100 containing 1% BSA. Then, sections were incubated with a 1% BSA-0.25% Triton X-100/PBS solution containing the GAS1 antibody (1:100) and subsequently incubated with a secondary antibody (FITC anti-rabbit IgG; Vector Laboratories, 1:100; Burlingame, CA); for other double-labeling experiments, samples were incubated in the presence of the GAS1 antibody and NeuN mouse monoclonal antibody (Chemicon, 1:100; Millipore, Billerica, MA) or GAS1 antibody and GFAP mouse monoclonal antibody (Cell Signaling, 1:100; Millipore) for 48 hr at 4C; sections were incubated with secondary antibodies (FITC anti-rabbit and TRITC anti-mouse IgG; Vector Laboratories, 1:100) with PBS with 0.25% Triton X-100. In controls to assess the specificity of the GAS1 antibody, some slides were incubated in the absence of the primary antibody, other slides were incubated with pre-immune serum instead of the GAS1 antibody, and other slides were incubated with pre-absorbed GAS1 antibody. In controls for double labeling, we used secondary antibodies in the absence of primary antibodies. For some experiments, an Olympus BX-51 microscope and the Image-Pro Plus program version 4.5 (MediaCybernetics; Rockville, MD) were used.
Confocal Microscopy
To analyze the expression of GAS1 in astroglia, we used confocal microscopy to more precisely follow the cytoskeleton of the cell, as revealed by the GFAP staining. Sections were examined under a confocal laser scanning microscope (Leica TCS-SPE) equipped with a 63× oil-immersion objective. The two channels were acquired sequentially with excitation at 488 nm (FITC) and 568 nm (TRITC) wavelengths recorded through separate channels. These channels were merged using the Leica LAS AF lite software.
Statistical Analysis
One-way ANOVA was performed, followed by Tukey’s test; p<0.05 was considered significant (GraphPad Software version 4).
Results
To demonstrate the presence of GAS1 mRNA in different areas of the adult CNS, we employed RT-PCR assays using primers that recognize sequences within the GAS1 gene. As a control for the specificity of the assays, we used NIH-3T3 cells. This cell line originated from mouse fibroblasts, and these cells do not express GAS1 mRNA when grown in the presence of serum but express it when serum-starved (Schneider et al. 1988). We observed that all brain regions analyzed expressed an RT-PCR product of the expected size (595 bp) (Fig. 1A). Furthermore, we found that this amplicon is not detected in NIH-3T3 cells grown in the presence of serum, but it can readily be observed in NIH-3T3 cells cultured in low serum for 96 hr (Fig. 1A). These data show that the GAS1 gene is expressed in the adult mouse brain and spinal cord and that the assay is specific, as corroborated by the results using NIH-3T3 cells. To further ensure the identity of the amplicon, it was cloned and sequenced, and it matched the reported mouse GAS1 mRNA sequence (Supplementary Fig. 1).
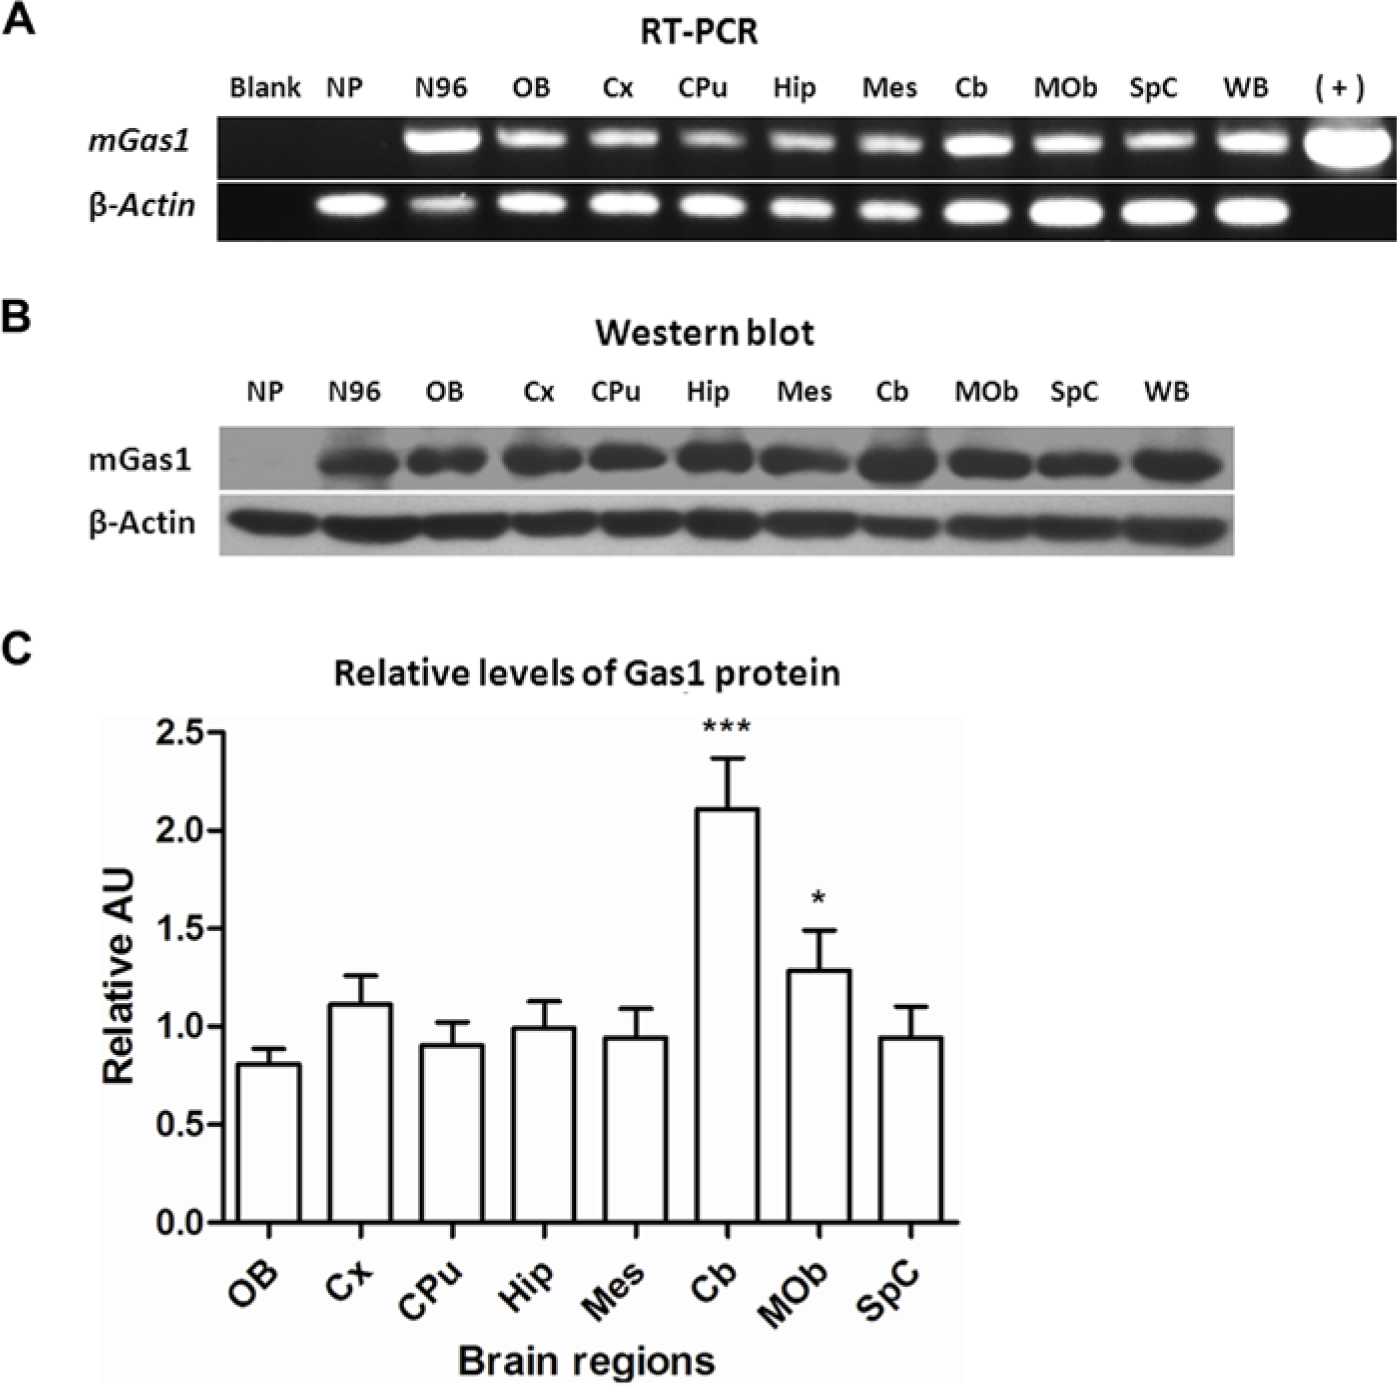
Expression and distribution of growth arrest specific 1 (GAS1) mRNA and protein in the adult mouse brain. (A) RT-PCR amplification of GAS1 mRNA from different brain regions. (B) Representative immunoblot of GAS1 in the corresponding brain structures. In both assays, β-actin was used as amplification and loading control, respectively. (C) The densitometric analysis of the expression of GAS1 in different brain regions. Results are expressed as arbitrary units, normalized with the respective β-actin control (mean ± SD), *p<0.05, different from olfactory bulb (OB); ***p<0.001, different from all other regions. AU, auditory cortex; Blank, no cDNA added; Cb, cerebellar lobule; CPu, caudate-putamen (striatum); Cx, cortex; Hip, hippocampus; Mes, mesencephalon; Mob, medulla oblongata; NP, proliferating NIH-3T3 cells; N96, arrested NIH-3T3 cells; SpC, spinal cord; WB, whole brain; (+), GAS1 plasmid control.
We then proceeded to determine the presence of the GAS1 protein in adult mouse CNS by western blot analysis. Proteins were isolated from different brain regions and spinal cord, and GAS1 was identified by employing a polyclonal antibody generated against a highly conserved sequence. As we had already done to confirm the specificity of the RT-PCR assay, we again used NIH-3T3 cells as a control for the expression of the protein. We observed that the antibody recognizes a band of approximately 40 kDa, the expected size of GAS1, both in mouse brain and in serum-starved NIH-3T3 cells but not in cells grown in complete medium (Fig. 1B). Levels of GAS1 protein were normalized with respect to β-actin in different brain regions. Based on this comparison, we conclude that GAS1 is expressed at high levels in adult CNS because, in most brain regions, GAS1 levels are close or even higher than β-actin levels, and in cerebellum, the signal was almost 2-fold higher than that of β-actin (Fig. 1C). These data demonstrate high levels and a widespread expression of GAS1 in adult mouse CNS.
Immunohistochemistry was used to determine the precise anatomical distribution of GAS1 in adult mouse CNS. As a first step, to determine the expression of GAS1, we took advantage of the property of NIH-3T3 cells of expressing GAS1 exclusively when grown in low serum but not when proliferating in complete medium (Schneider et al. 1988). Supplementary Fig. 2 shows strong expression of GAS1 in serum-starved cells, and no signal in cells grown in the presence of serum, thus demonstrating the suitability of this technique for determining the presence of GAS1; we also showed that there is no signal when cells are incubated with pre-immune serum or pre-absorbed GAS1 antibody, and in the absence of primary antibody (Supplementary Fig. 2). We then proceeded to analyze the expression of GAS1 in adult mouse brain. First, the specificity of the GAS1 antibody used in this study was confirmed by immunohistochemistry in slides of mouse brain, as previously described in the Methods section, and we showed that GAS1 protein was detected only when slides were incubated with the GAS1 antibody but not when the section of mouse brain was incubated with pre-absorbed antibody, pre-immune serum, or secondary antibody in the absence of the primary antibody (Supplementary Fig. 3). Double-staining controls showed signal only when incubated in the presence of the primary antibodies (Supplementary Fig. 4). In Fig. 2, we present a sagittal section of the mouse encephalon, where we observed expression of GAS1 in many areas of the brain, with particularly strong expression in cerebellum and hippocampus (abbreviations to identify brain structures are presented in Table 1). We then continued to analyze in detail the expression of GAS1 in different brain nuclei and in cervical spinal cord. As a marker to identify neurons, we used NeuN, which is expressed in a wide variety (but not all) of neuronal phenotypes, whereas GFAP was employed to identify astroglia. Double staining for NeuN and GAS1, and GFAP and GAS1 was performed in different brain areas to determine the localization of GAS1 in the two cell types.
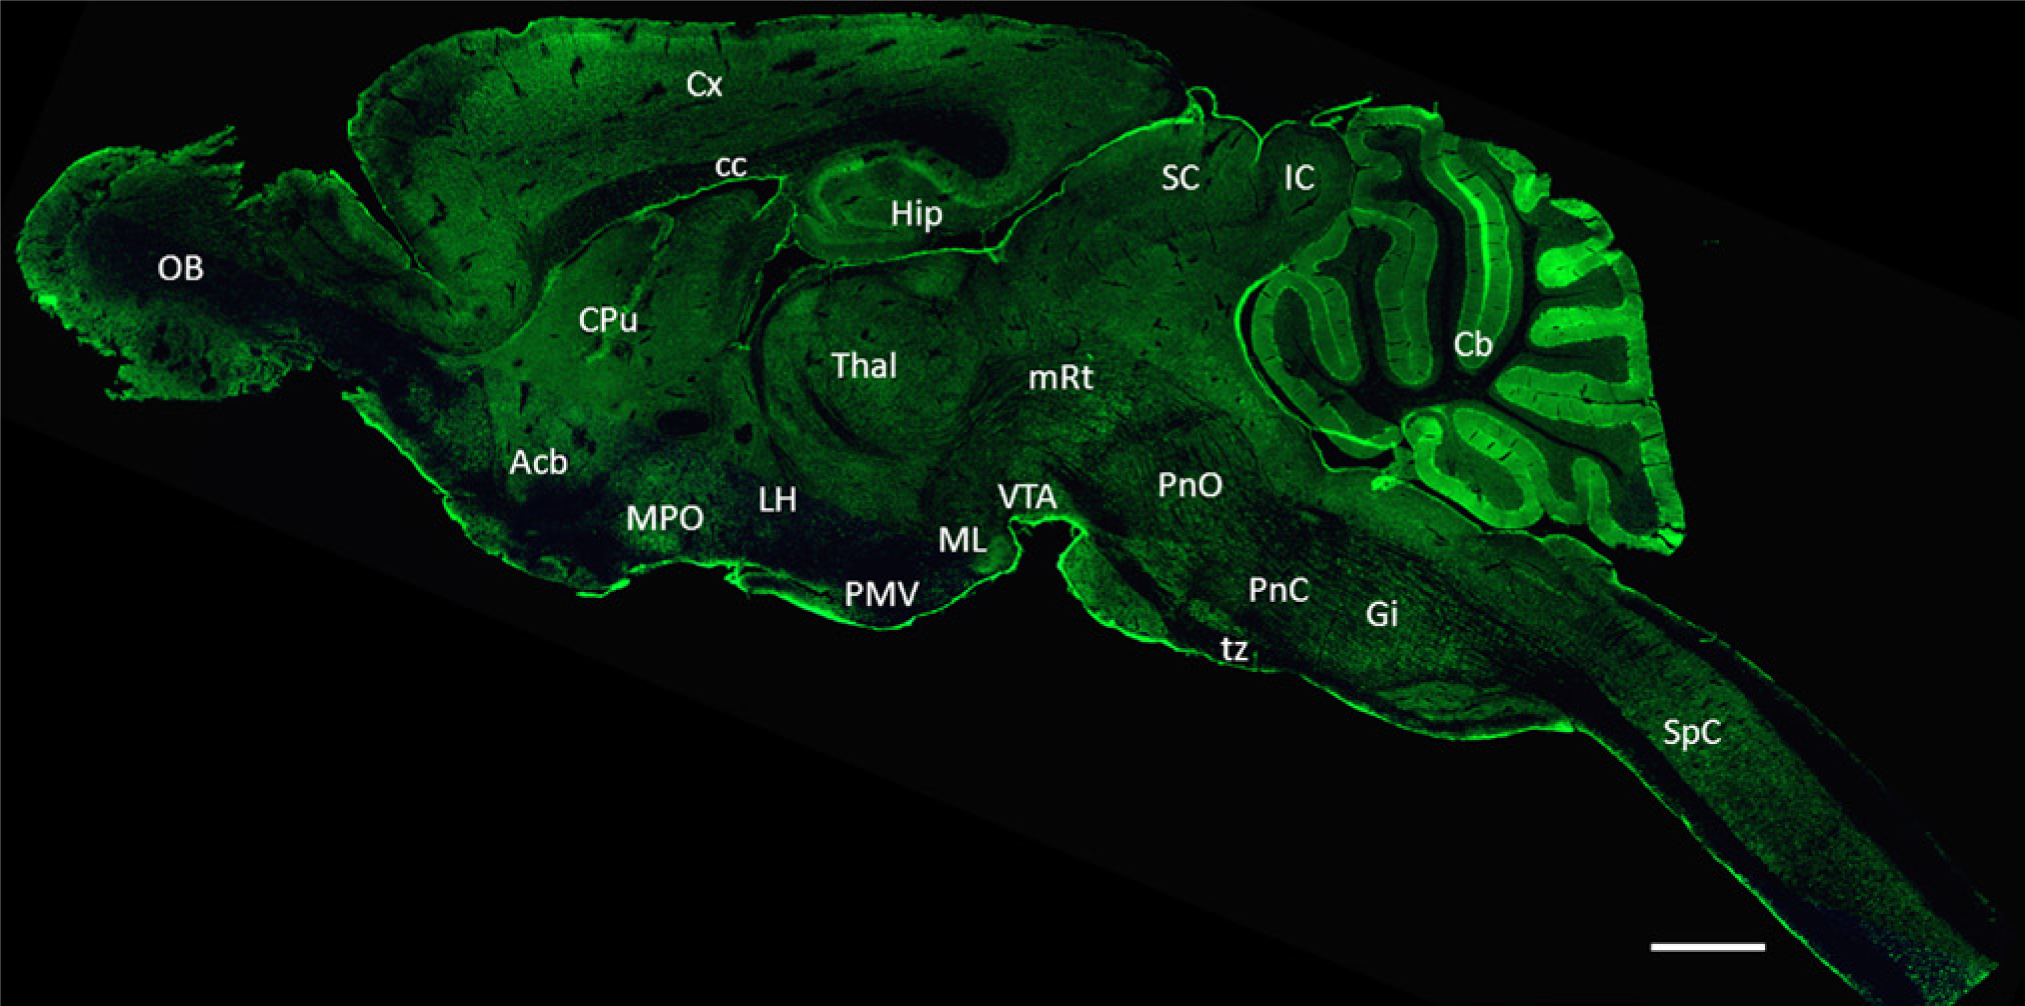
Immunohistochemical staining for growth arrest specific 1 (GAS1) in adult mouse brain. Mid-sagittal section shows the widespread distribution of GAS1 in all regions of the adult brain. Abbreviations of structures are indicated in Table 1. Calibration bars = 2 mm.
Abbreviations of Brain Regions.
Olfactory Bulb
We observed that NeuN is found alone in scattered small cells from the EPl and the IPl, and this protein is not expressed in mitral cells, as reported previously (Mullen, Buck, and Smith 1992). GAS1 is found alone in periglomerular neurons in the GL, mostly in external tufted neurons, and in some middle and deep tufted neurons, some other small neurons in the EPl, and apparently in all mitral cells. GAS1 co-localizes with NeuN mainly in granular neurons in the mitral cell layer, in the granular layer, and also in some small periglomerular cells (Fig. 3).
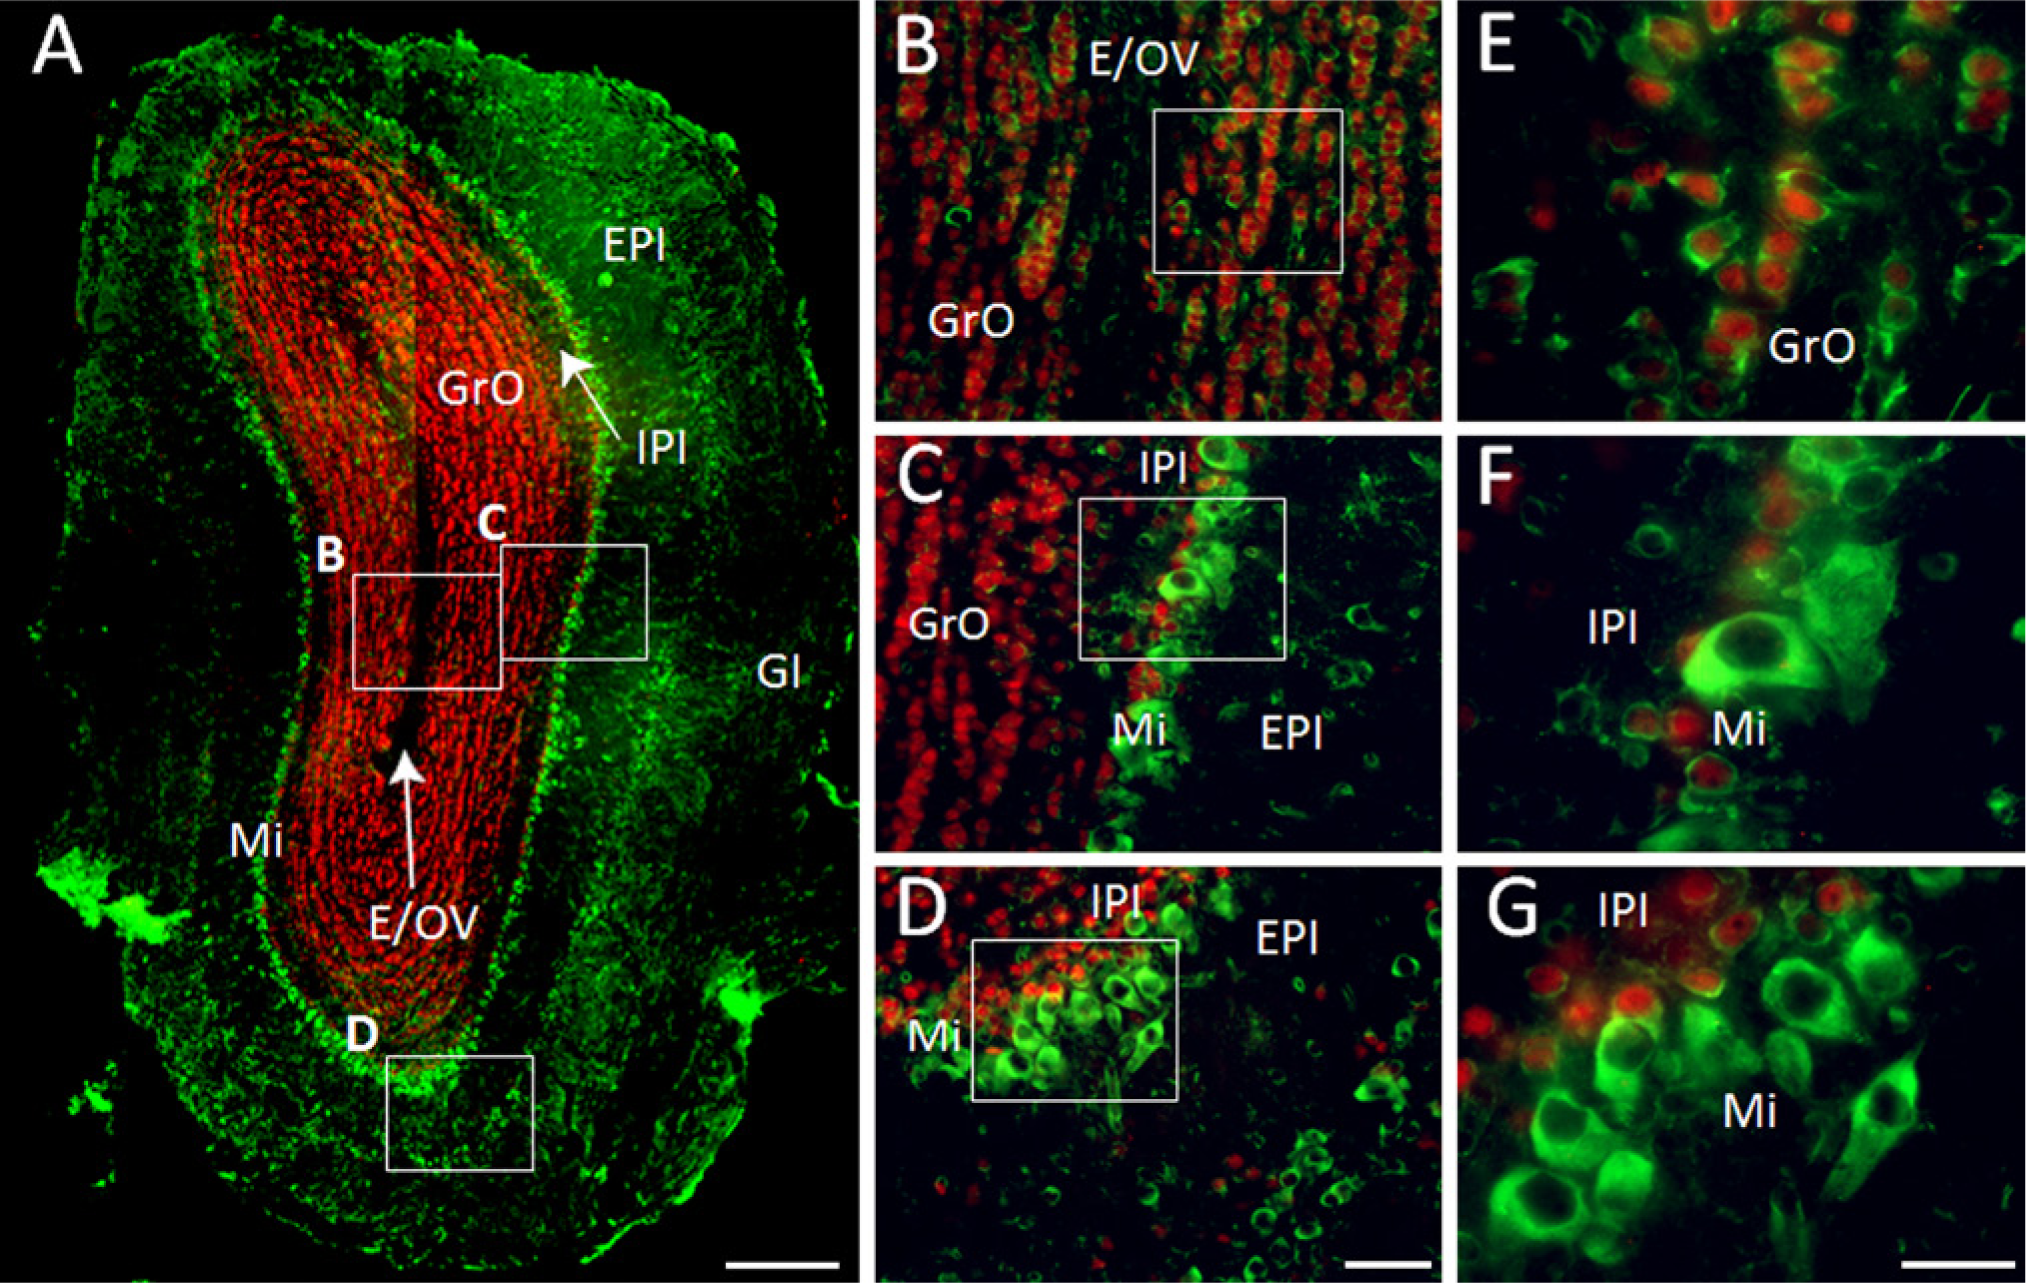
Immunohistochemical localization of growth arrest specific 1 (GAS1) protein in the olfactory bulb, and co-localization with neurons, as demonstrated by double labeling of neuronal nuclei (NeuN). (A) Depicts the whole olfactory bulb, presented from a reconstruction (collage) of eight images obtained with an amplification of 10X. Abbreviations of structures are indicated in Table 1. GAS1 is revealed in green and NeuN in red. Scale bars (A) = 250 µm; (B-D) = 50 µm; (E-G) = 25 µm.
Caudate-Putamen
GAS1 is found in many cells in the matrix (apparently projection neurons) (Fig. 4A), where, in some of them, it co-localizes in the cytoplasm with NeuN. In other neurons from the matrix, NeuN is found in the nucleus and GAS1 in the cytoplasm (Figs. 4C and 4D). In the septum, GAS1 co-localizes with NeuN in the cytoplasm of the medial septal neurons, whereas in the dorsal lateral septal neurons, NeuN is found in the nucleus, whereas GAS1 is in the cytoplasm (Fig. 4B).
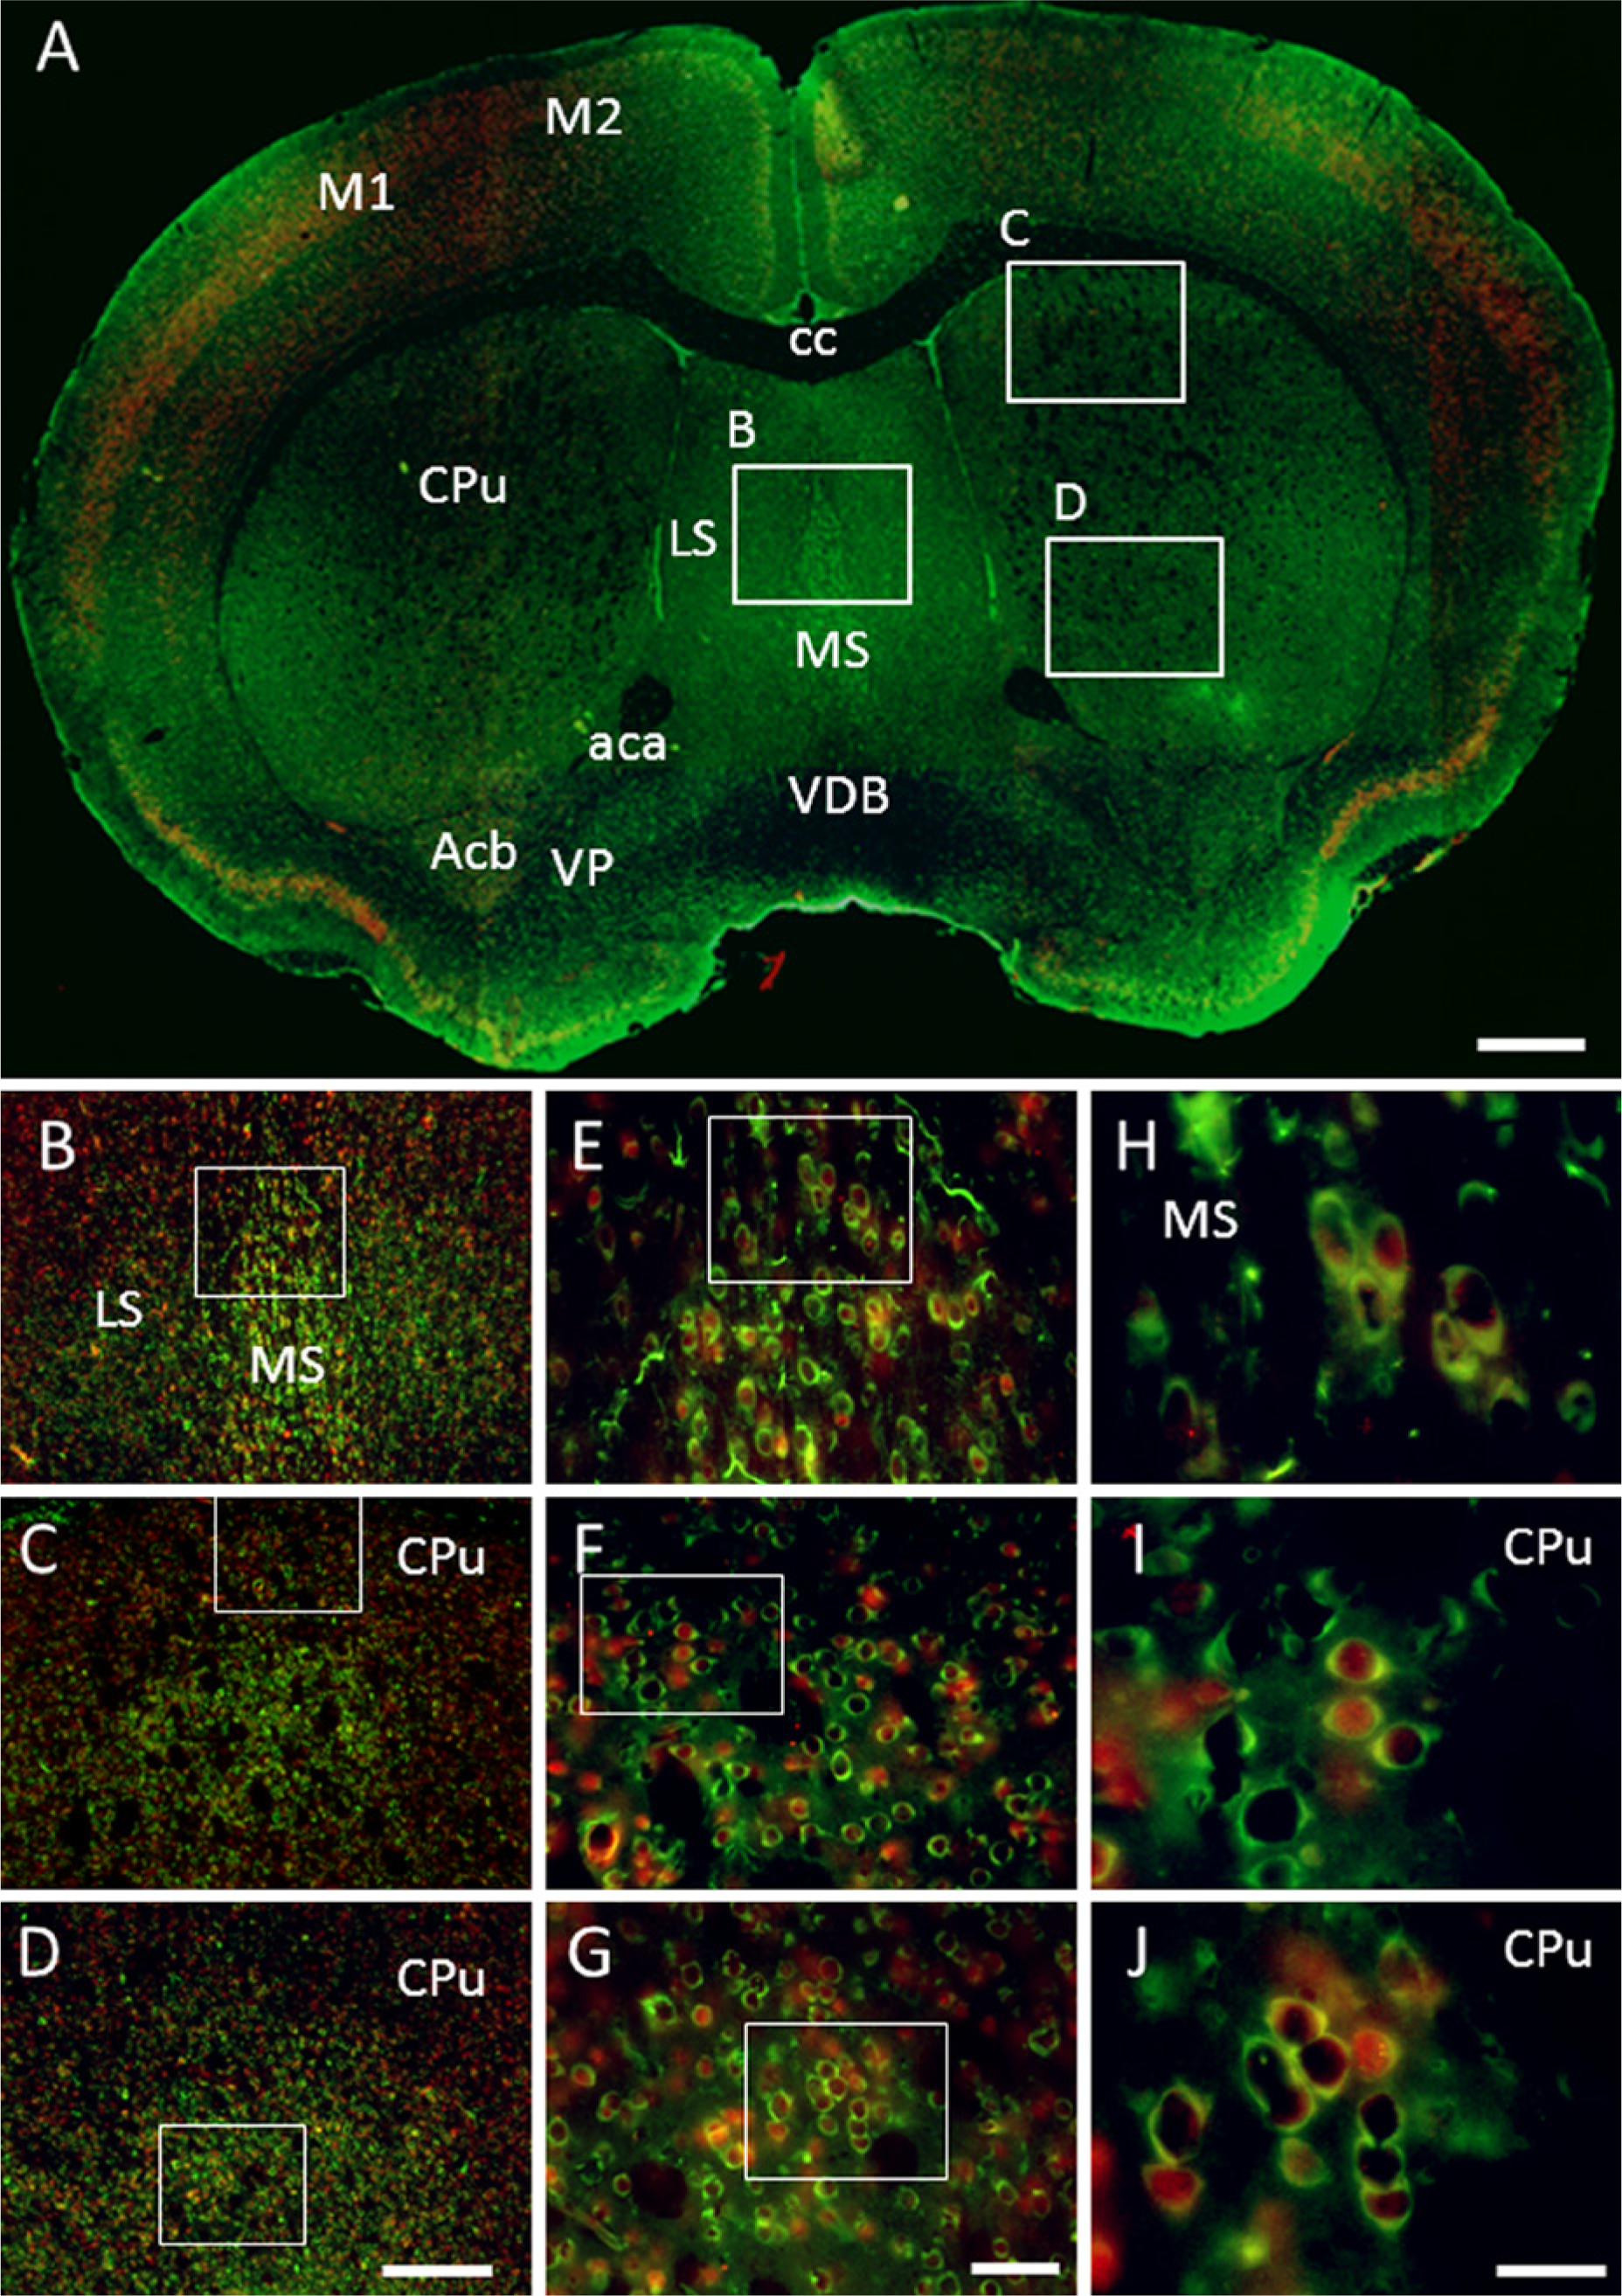
Immunohistochemical localization of growth arrest specific 1 (GAS1) protein in the caudate-putamen, and co-localization with neurons, as demonstrated by double labeling of neuronal nuclei (NeuN). Abbreviations of structures are indicated in Table 1. GAS1 is revealed in green and NeuN in red. Calibration bar A = 1 mm; bars B–D = 250 µm; bars E–G = 50 µm; bars H–J = 25 µm.
Hippocampus
GAS1 co-localizes with NeuN in almost all pyramidal neurons from CA1, CA2, and CA3 and in the granular cells of the dentate gyrus. In all of these neurons, GAS1 and NeuN co-localize in the cytoplasm; on the other hand, whereas NeuN is found alone in the nucleus, GAS1 is found in the cytoplasm of some pyramidal neurons closer to the stratum oriens where some smaller neurons are also stained. GAS1 is likewise found in neurons of the polymorphic dentate gyrus (Figs. 5A–5D).

Immunolocalization of growth arrest specific 1 (GAS1) protein in the hippocampus, and co-localization with neurons, as demonstrated by double labeling of neuronal nuclei (NeuN). Abbreviations of structures are indicated in Table 1. GAS1 is revealed in green and NeuN in red. Calibration bar A = 1 mm; bars B–E = 250 µm; bars F–I = 50 µm; bars J–M = 25 µm.
Mesencephalon
GAS1 co-localizes with NeuN in some neurons of the zona incerta and the substantia nigra, as well as in most neurons of the ventral tegmental area. In all these cells, GAS1 and NeuN are located in the cytoplasm and NeuN is also found in some nuclei. It is interesting that GAS1 is present alone in most surrounding neurons and NeuN is found alone in some nuclei (Figs. 6A–6C).
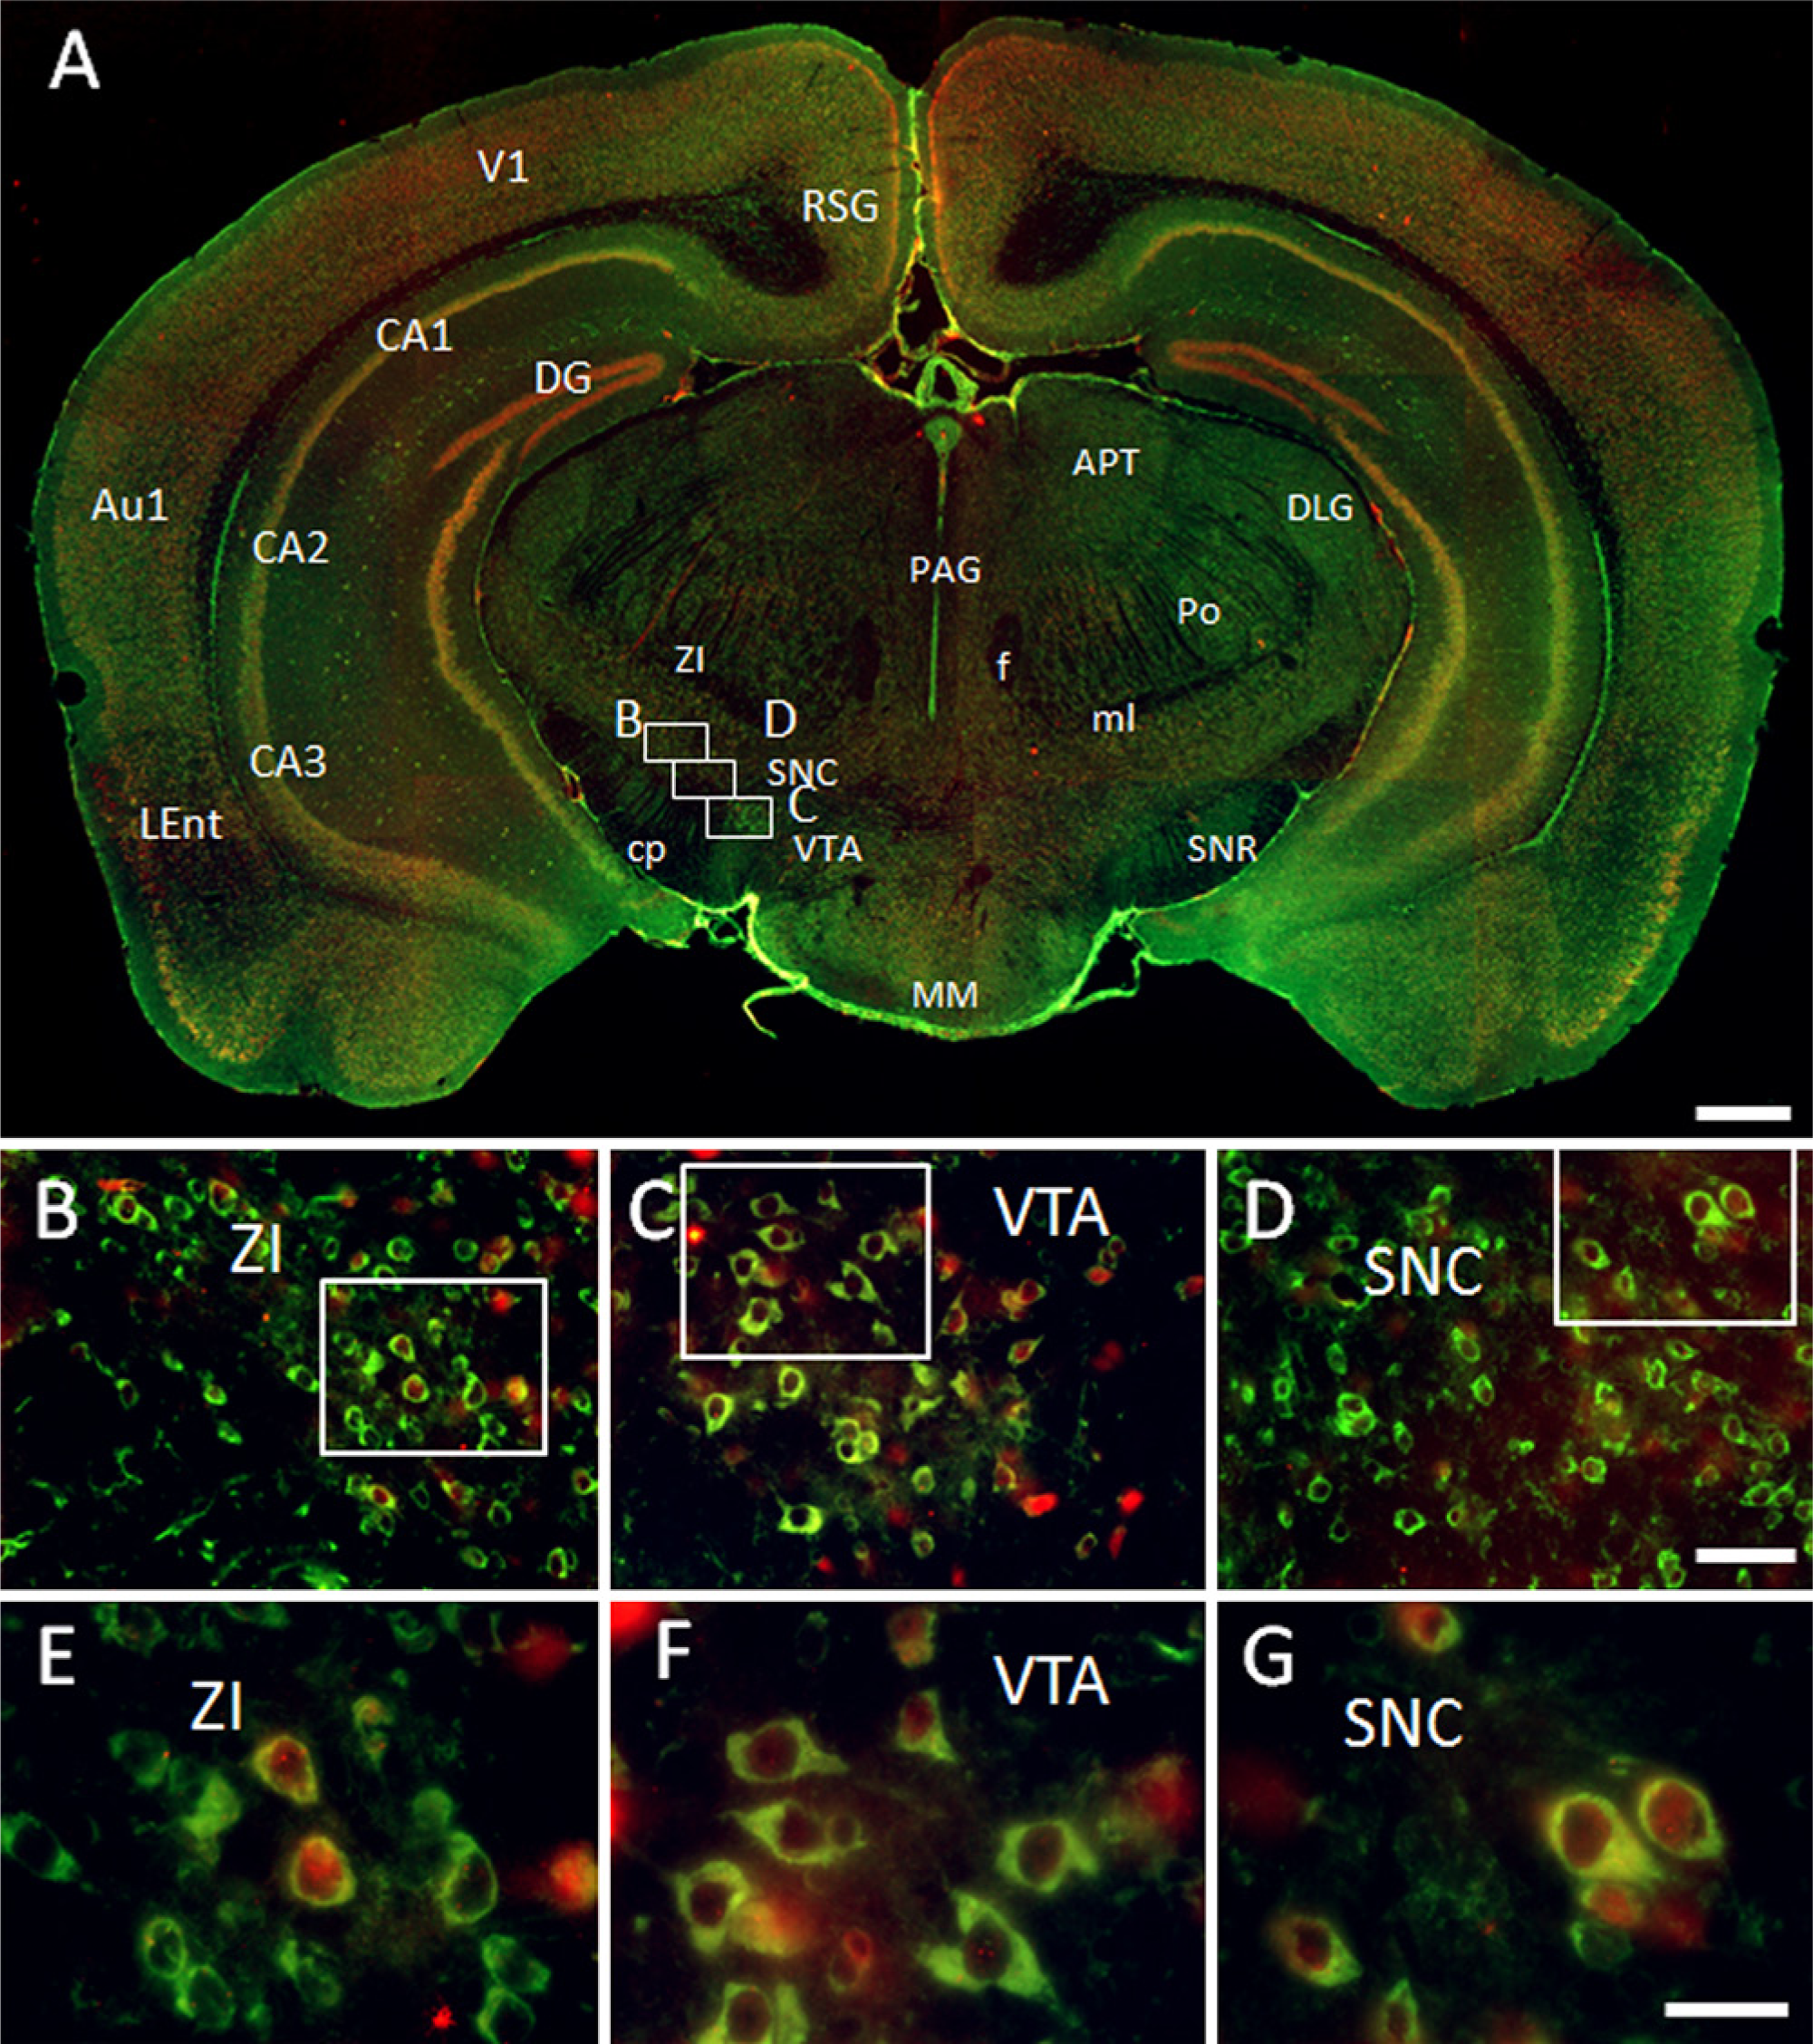
Immunohistochemical localization of growth arrest specific 1 (GAS1) protein in the mesencephalon, and co-localization with neurons, as demonstrated by double labeling of neuronal nuclei (NeuN). Abbreviations of structures are indicated in Table 1. GAS1 is revealed in green and NeuN in red. Calibration bar A = 1 mm; bars B–D = 50 µm; bars E–G = 25 µm.
Cortex
GAS1-immunoreactivity was observed in neurons throughout the cortical mantle. GAS1 co-localizes with NeuN in some neurons of the retrosplenial granular cortex, primary somatosensory cortex, primary auditory cortex, and lateral entorhinal cortex. In these cells, GAS1 and NeuN co-localize in the cytoplasm but NeuN is also found in the nuclei (Figs. 7A–7L).
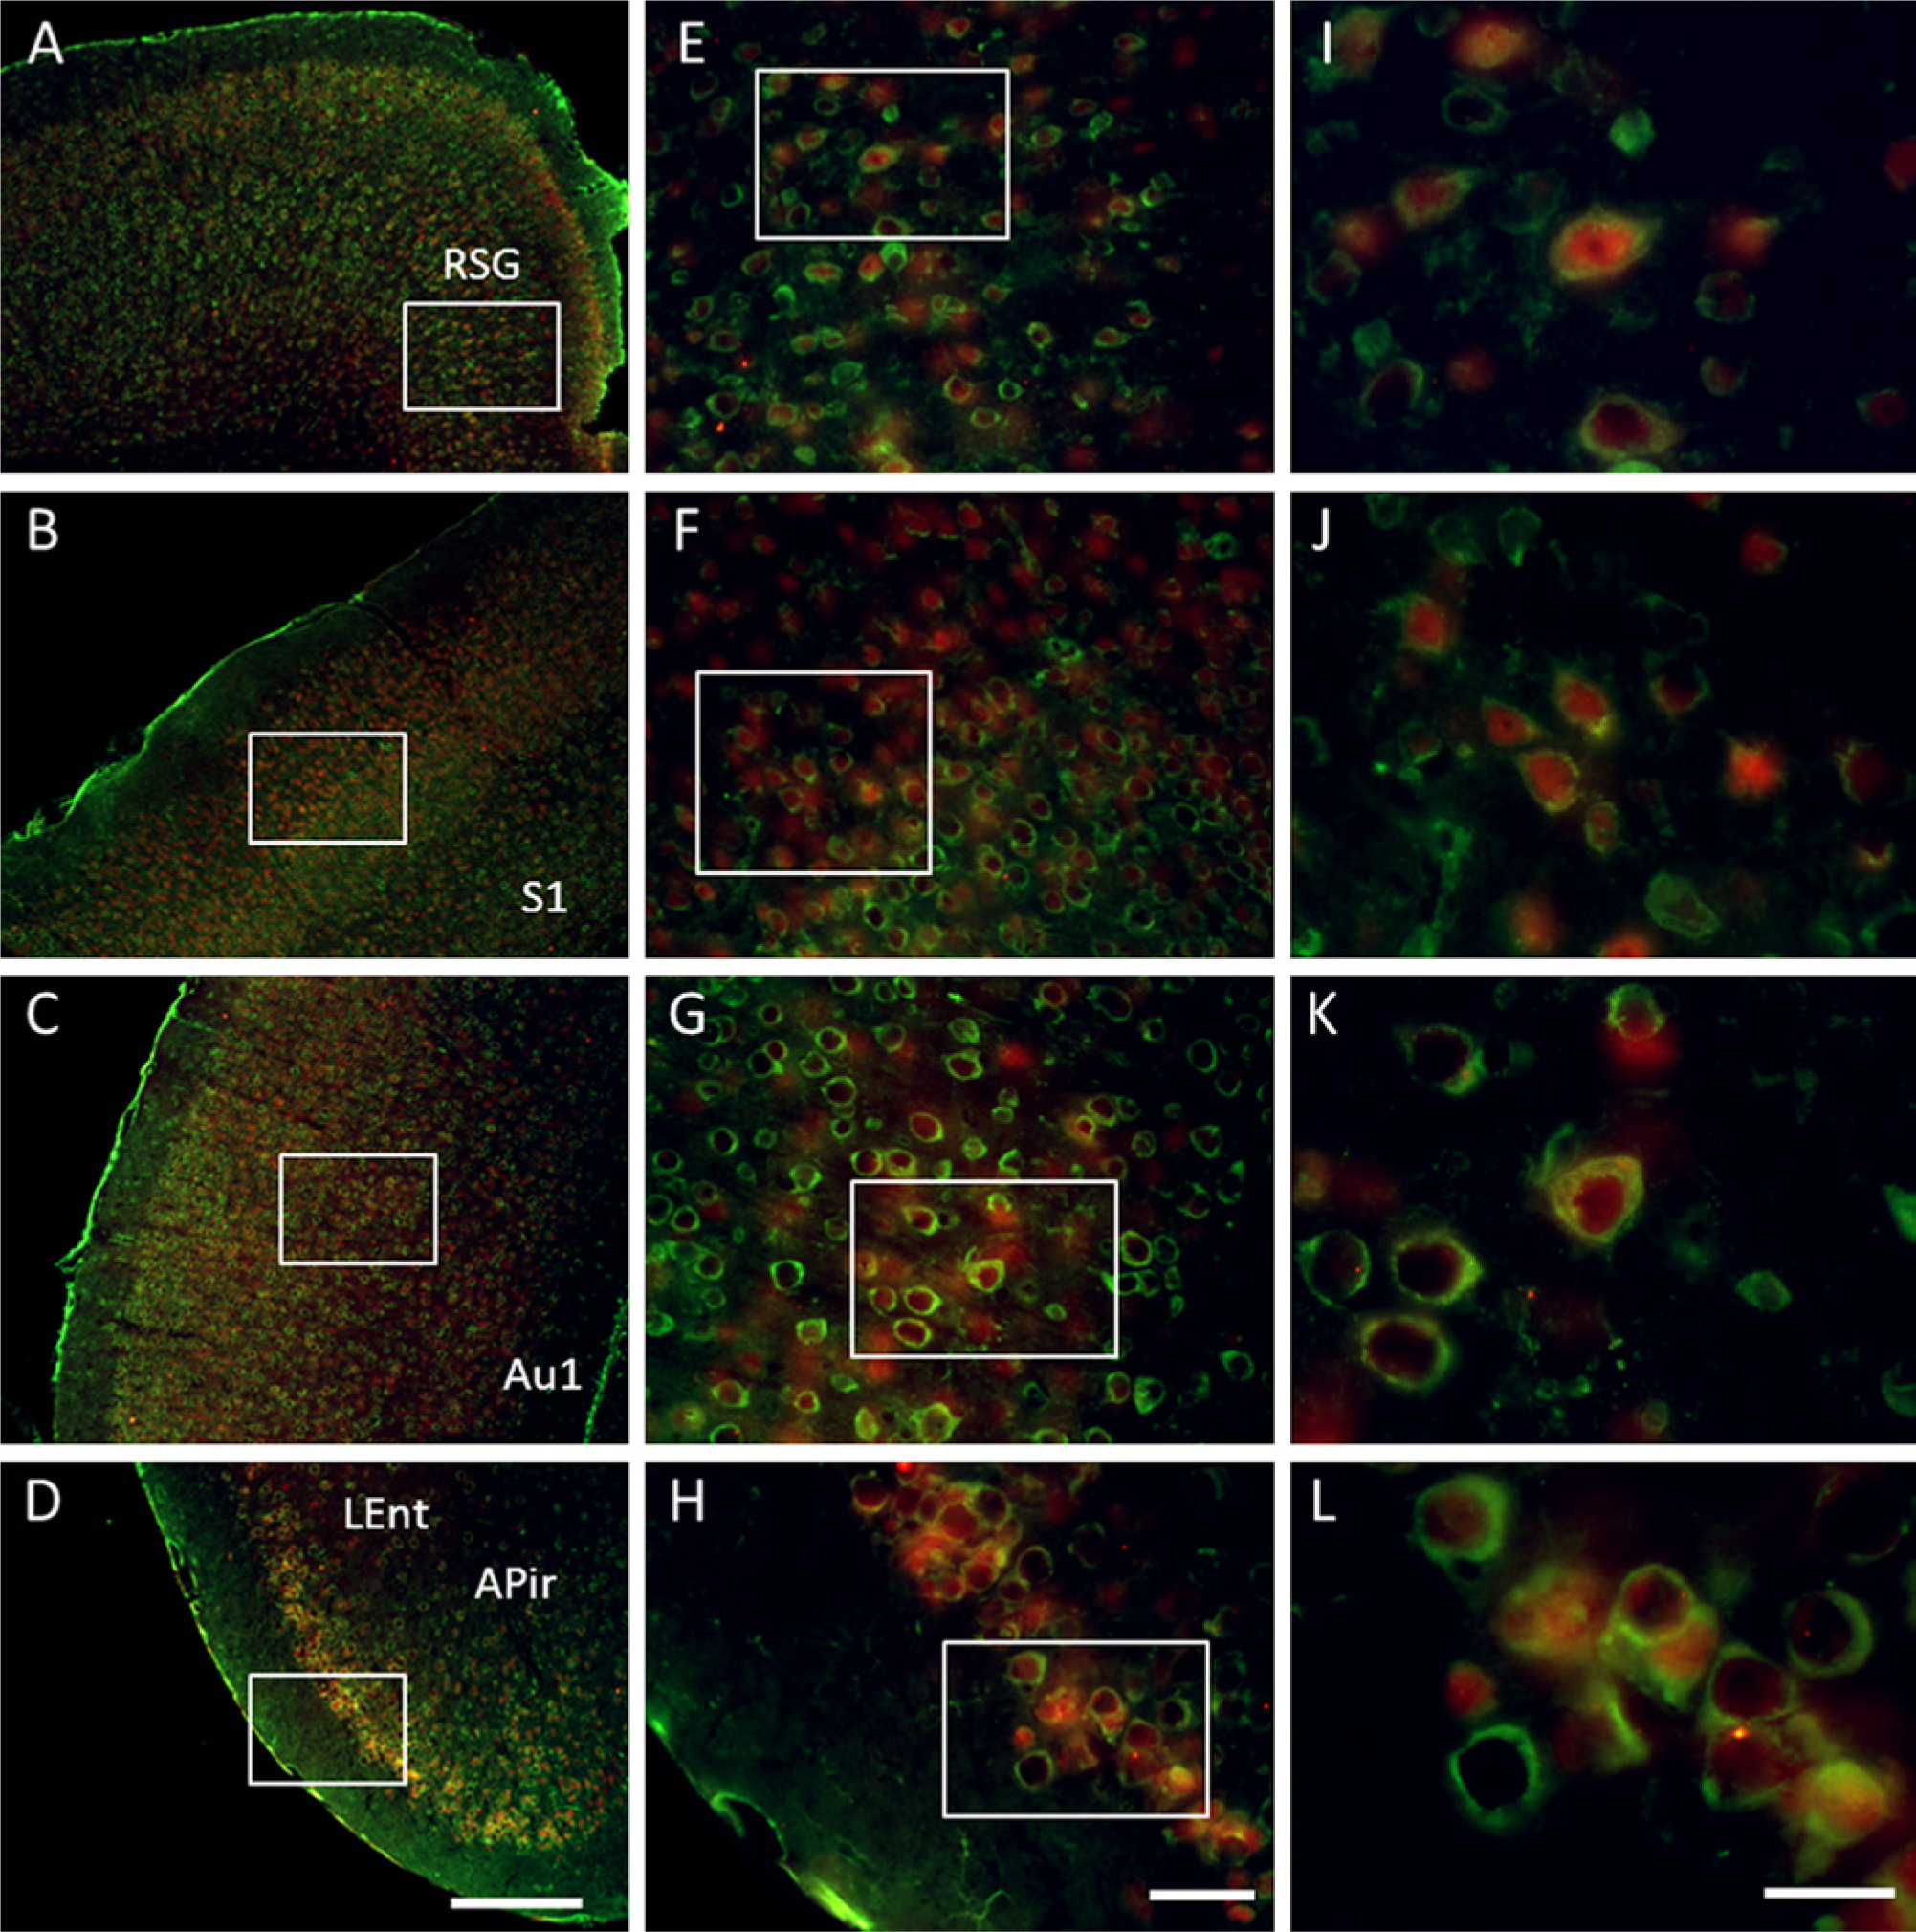
Immunolocalization of growth arrest specific 1 (GAS1) protein in different cortical regions, and co-localization with neurons, as demonstrated by double labeling of neuronal nuclei (NeuN). Abbreviations of structures are indicated in Table 1. GAS1 is revealed in green and NeuN in red. Calibration bars A–D = 250 µm; bars E–H = 50 µm; bars I–L = 25 µm.
Cerebellum
This region presents a very strong immunoreactivity to GAS1, which is found in Purkinje cells (negative for NeuN) (Mullen, Buck, and Smith 1992) and in basket cells of the molecular layer, as well as in small neurons of the nucleus interpositus. GAS1 is expressed in neurons of the granular layer and the interpositus nucleus, where it co-localizes with NeuN. It is interesting that, in neurons of the granular cell layer, NeuN is found in the nucleus and GAS1 in the cytoplasm, whereas in the interpositus, GAS1 and NeuN co-localize in the cytoplasm but NeuN is also present in the nucleus. NeuN labeling is subtle in the interposed and lateral cerebellar nuclei, where a strong GAS1 signal is detected, thus the double labeling can be observed only at high magnification (Figs. 8A–8J).
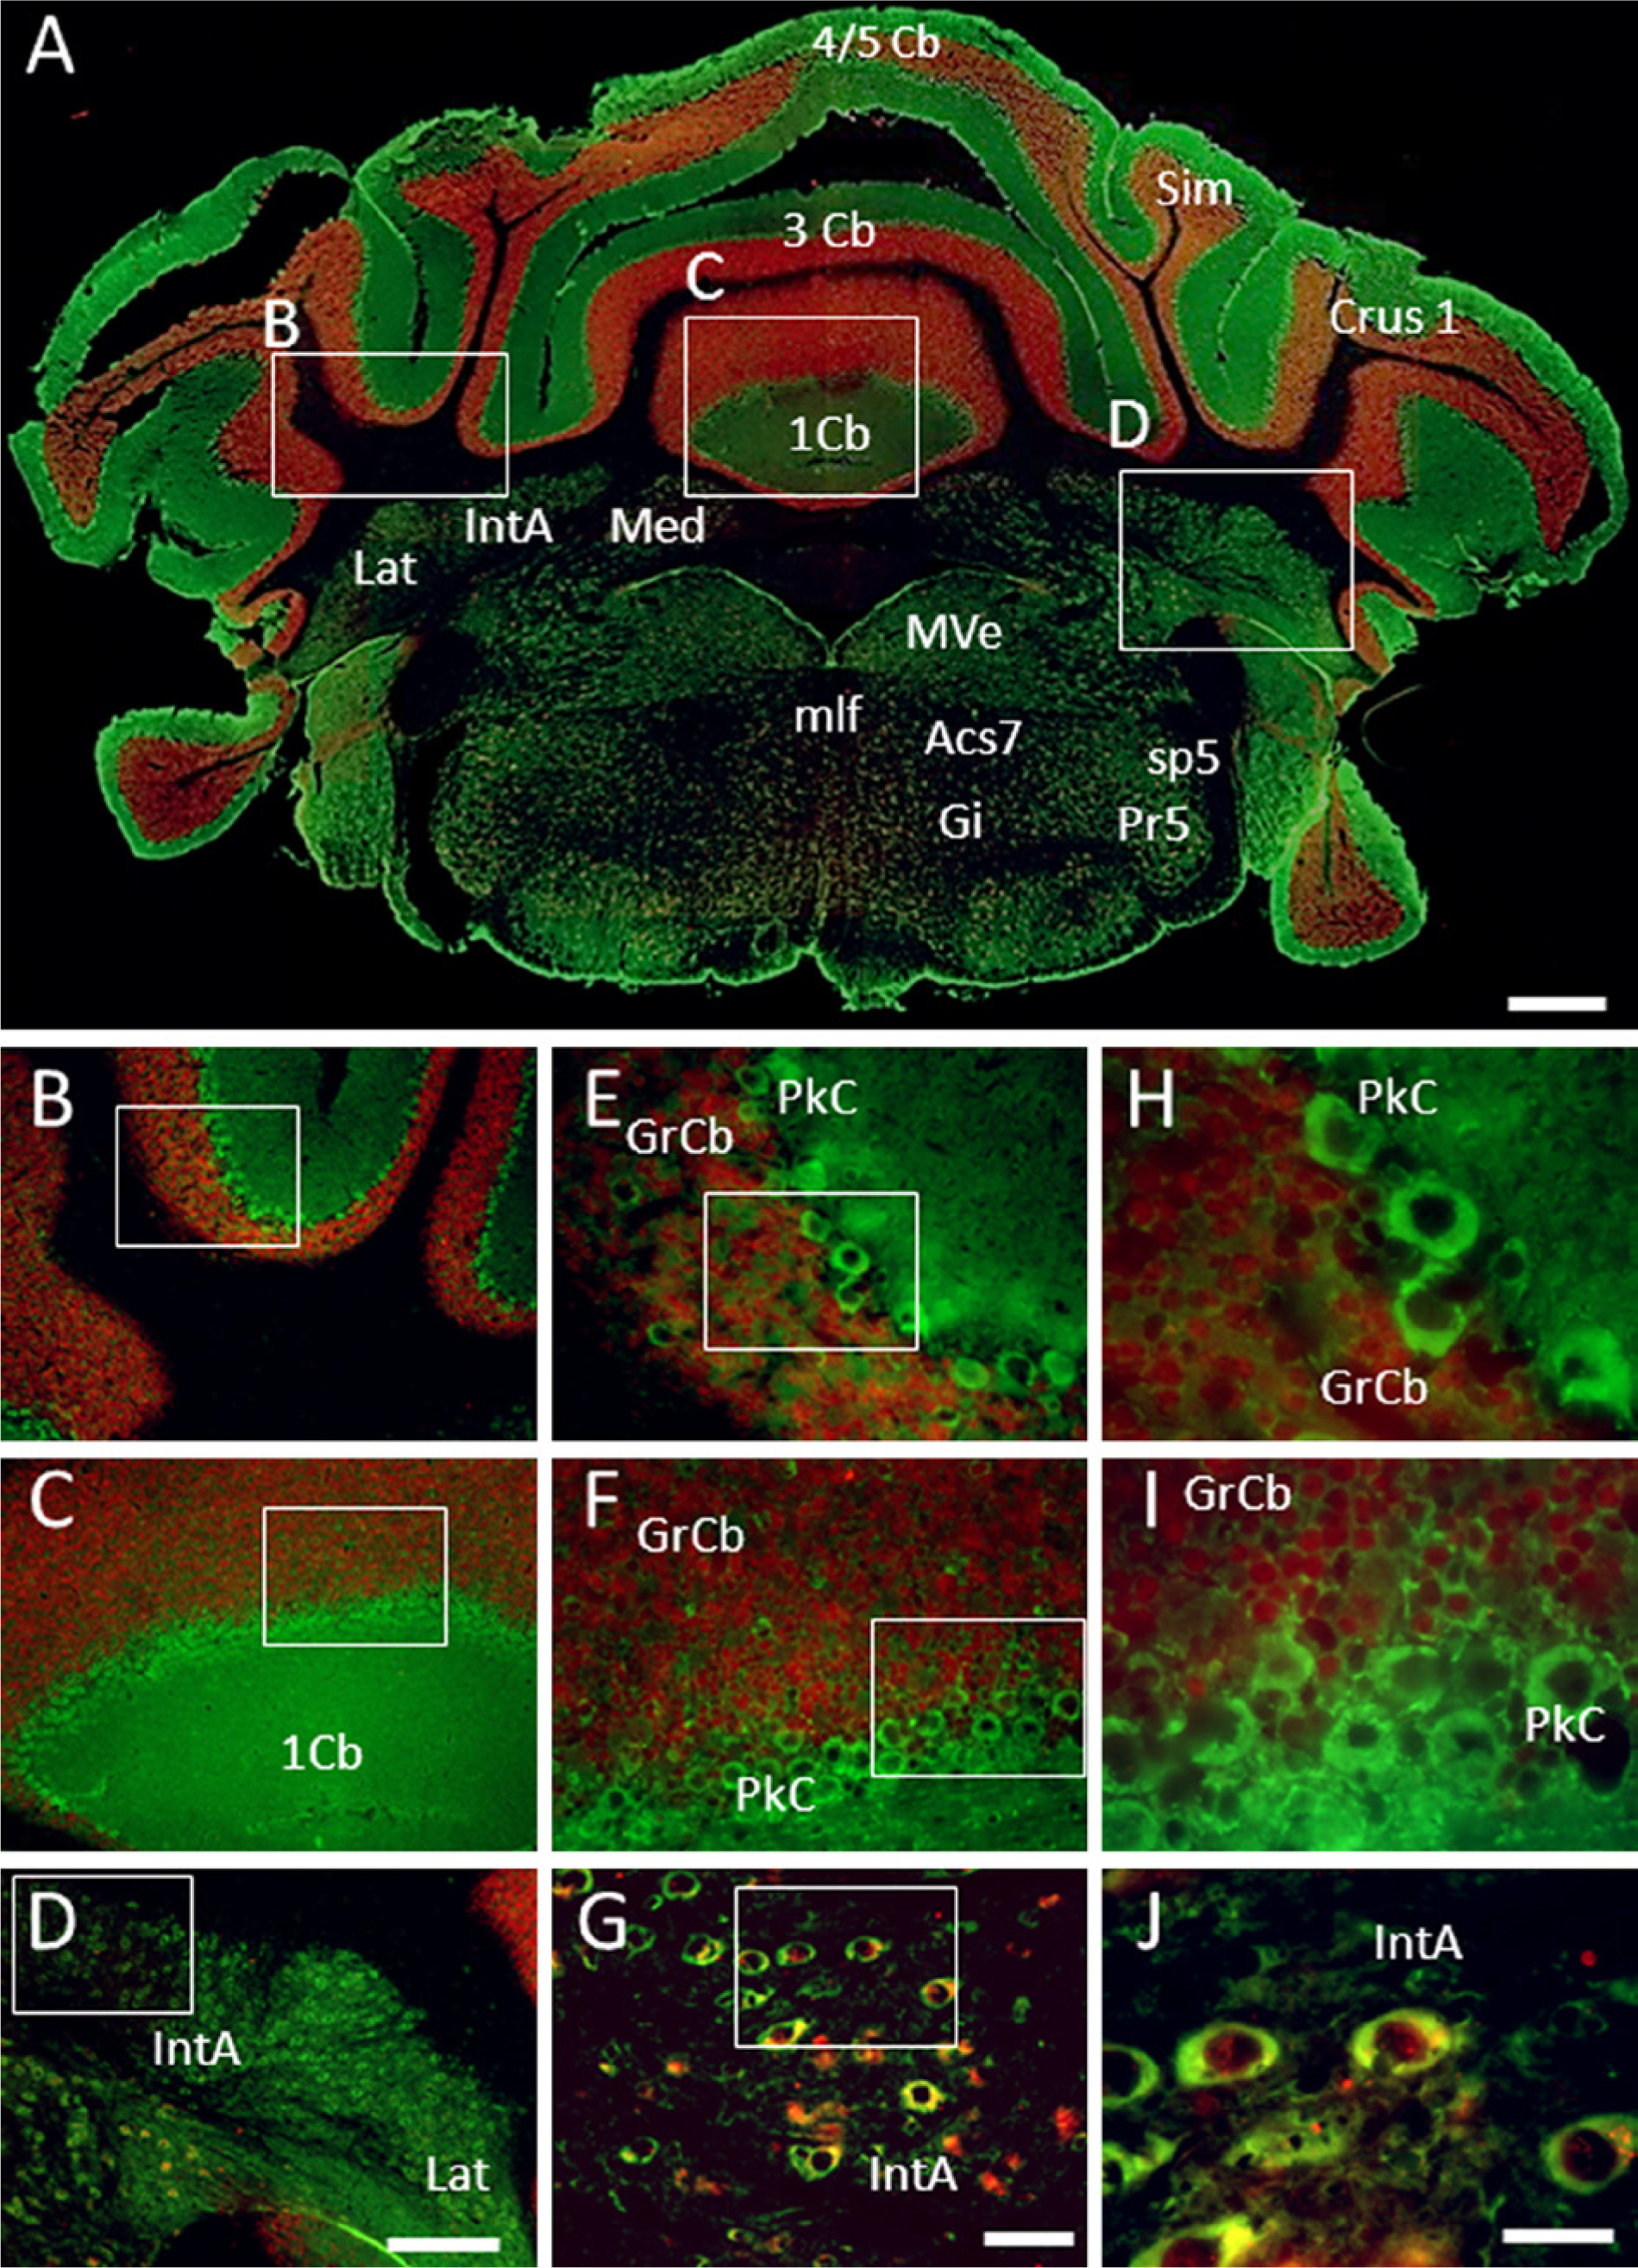
Immunolocalization of growth arrest specific 1 (GAS1) protein in the cerebellum, and co-localization with neurons, as demonstrated by double labeling of neuronal nuclei (NeuN). Abbreviations of structures are indicated in Table 1. GAS1 is revealed in green and NeuN in red. Calibration bar A = 1 mm; bars B–D = 250 µm; bars E–G = 50 µm; bars H–J = 25 µm.
Medulla Oblongata
GAS1 and NeuN co-localize in neurons of the hypoglossal nucleus, nucleus ambiguous, and raphe oscurus, where GAS1 and NeuN are found in the cytoplasm, while NeuN is also situated in some nuclei (Figs. 9A–9C).
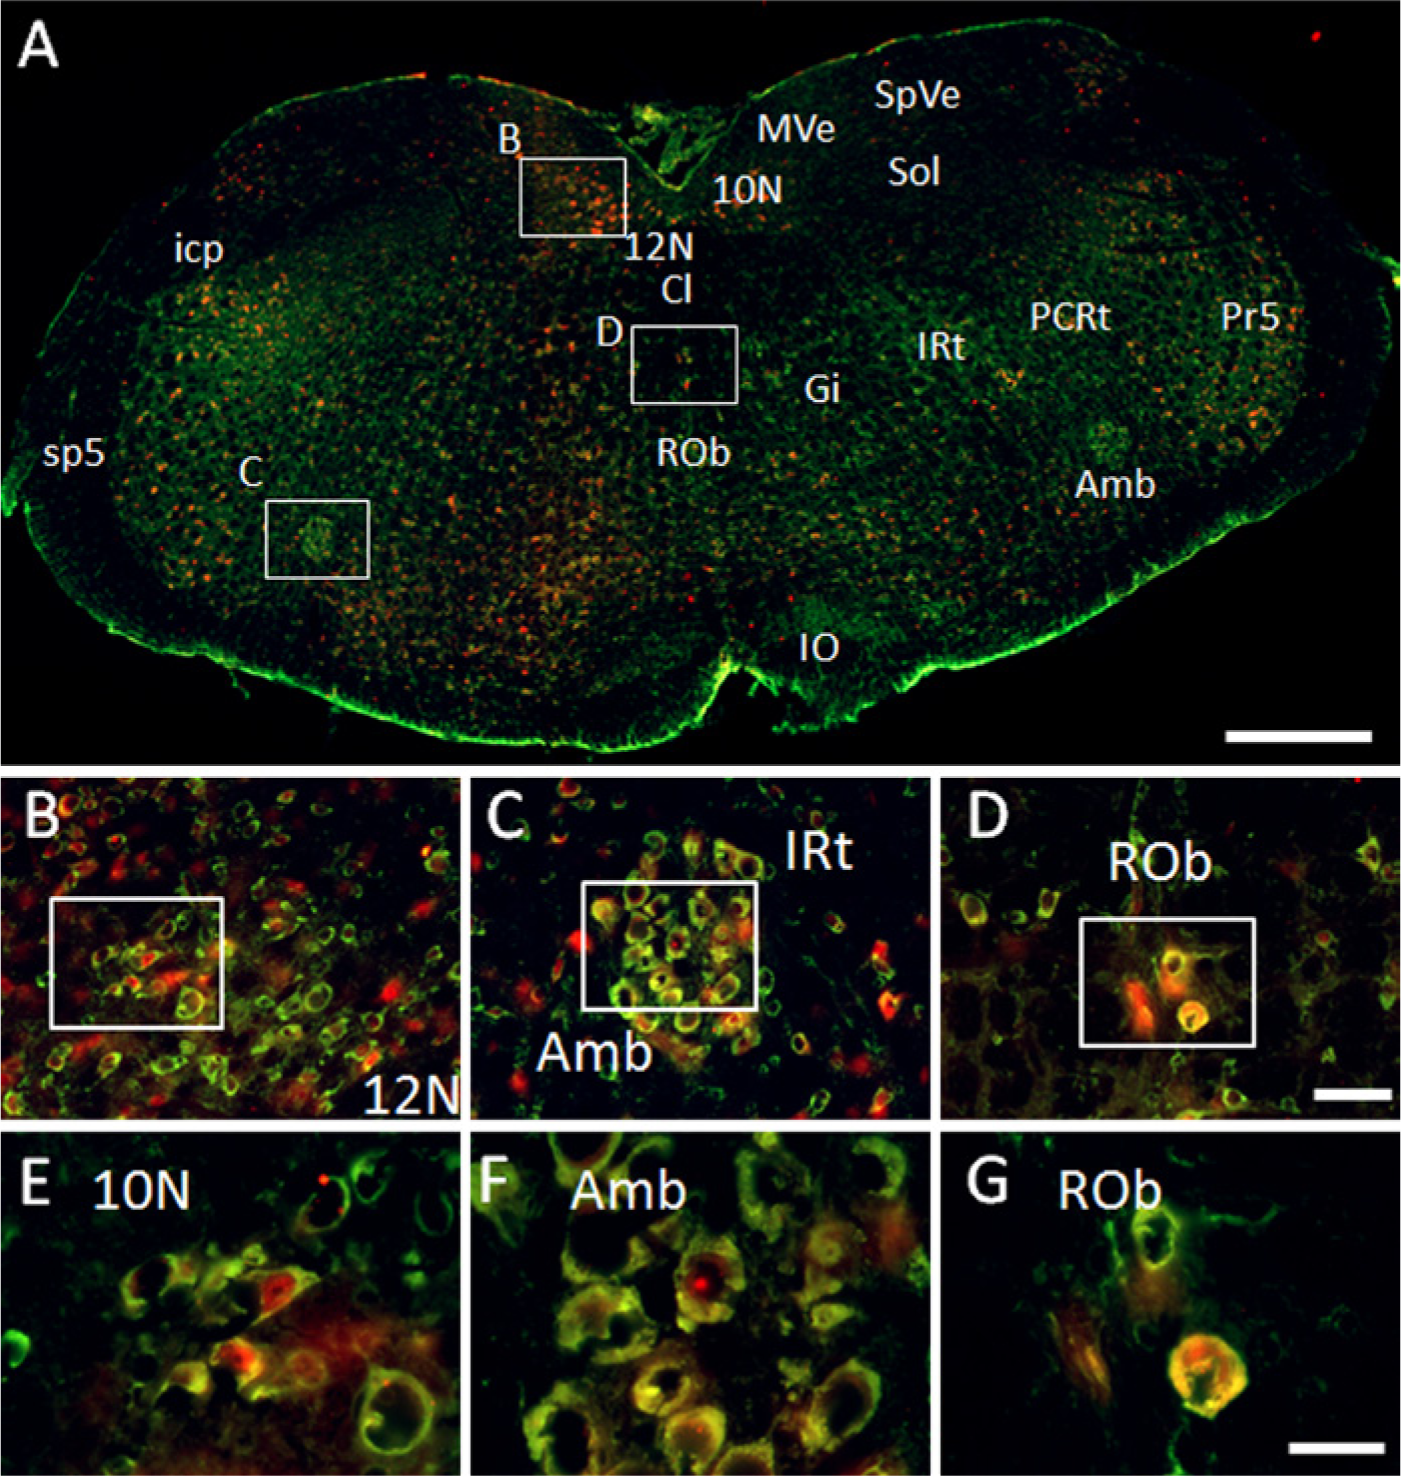
Immunolocalization of growth arrest specific 1 (GAS1) protein in the medulla oblongata, and co-localization with neurons, as demonstrated by double labeling of neuronal nuclei (NeuN). Abbreviations of structures are indicated in Table 1. GAS1 is revealed in green and NeuN in red. Calibration bar A = 500 µm; bars B–D = 50 µm; bars E–G = 25 µm.
Spinal Cord
GAS1 co-localizes with NeuN in about two thirds of the neurons. GAS1 is found in the cytoplasm whereas NeuN is in the nucleus, although in some motoneurons, GAS1 and NeuN also co-localize in the cytoplasm. We also observed that GAS1 is found in the cytoplasm of small neurons (probably interneurons in the ventral horn), which are NeuN negative, and in some neurons in the dorsal horn. NeuN is found alone in the nuclei of some neurons in the dorsal and intermediate horns (Figs. 10A–10C).
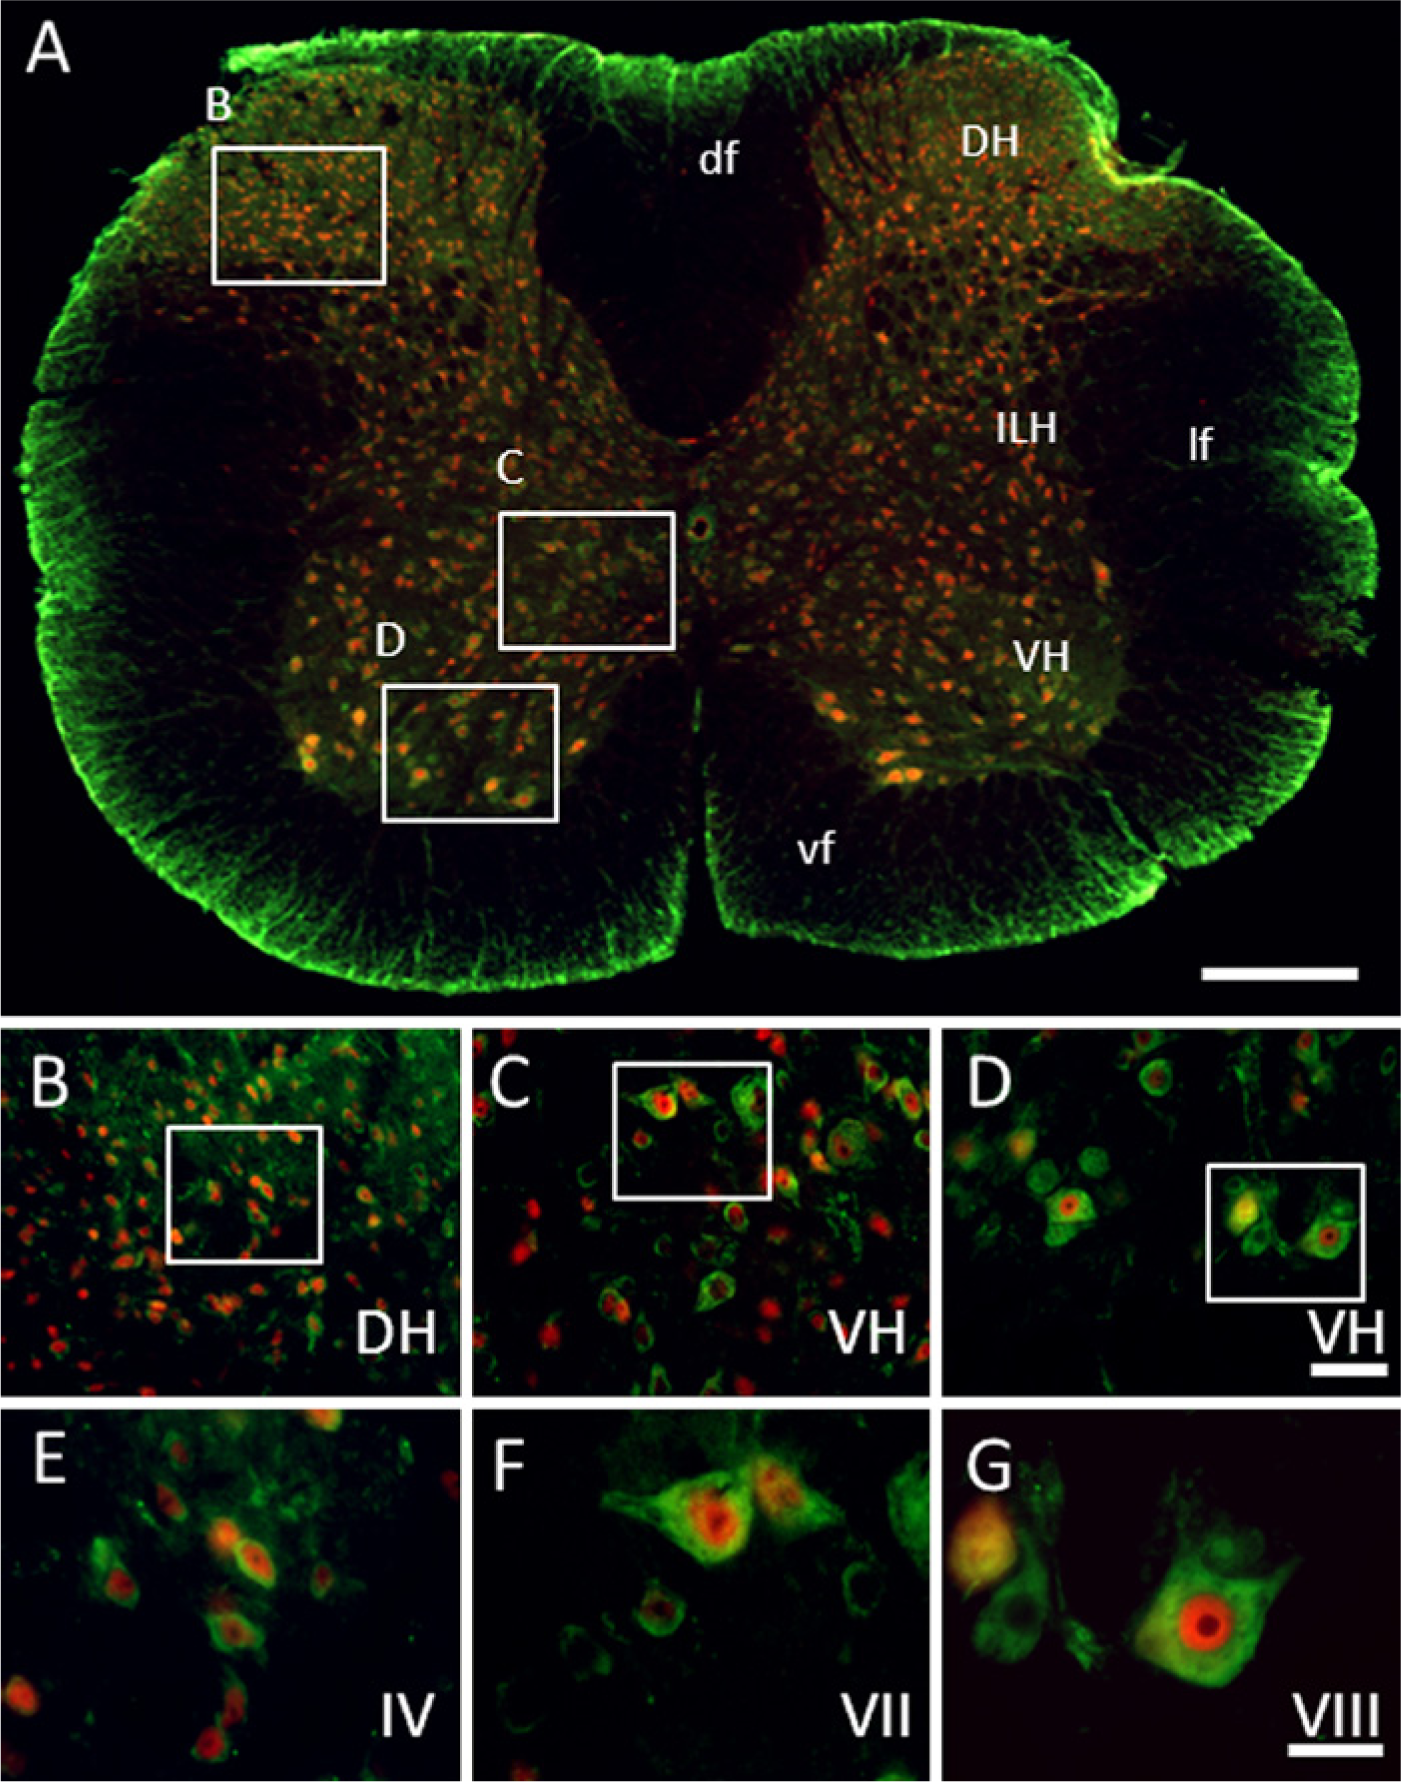
Immunolocalization of growth arrest specific 1 (GAS1) protein in cervical spinal cord, and co-localization with neurons, as demonstrated by double labeling of neuronal nuclei (NeuN). Abbreviations of structures are indicated in Table 1. GAS1 is revealed in green and NeuN in red. Calibration bar A = 500 µm; bars B–D = 50 µm; bars E–G = 25 µm.
Glial Cells
We also assayed for the possible expression of GAS1 in astroglial cells. For these experiments, we stained sections using the GAS1 antibody and determined the expression of GFAP, as a marker of glial cells in the same sections, using laser confocal microscopy. The results from these experiments show a non-homogeneous pattern of expression of GAS1 in astroglial cells. In the olfactory bulb, GAS1 co-localizes with many GFAP-positive cells, whereas in the caudate-putamen, GAS1 is found in fibrous astrocytes of the striosomes and in some astrocyte fibers in the corpus callosum, where we also find astrocytes that are GAS1 negative (Fig. 11, upper panel). We found a few GAS1/GFAP-positive cells immersed in the granular layer of the DG of the hippocampus, as well as in the mesencephalon and the medulla (Fig 11, lower panels). In contrast, we observed no expression of GAS1 in astroglia in cerebellum (Fig. 12, left panel). The population of GAS1/GFAP-positive cells in spinal cord is particularly interesting, because there is strong expression of GAS1 in radial glia (Fig. 12, right panel).
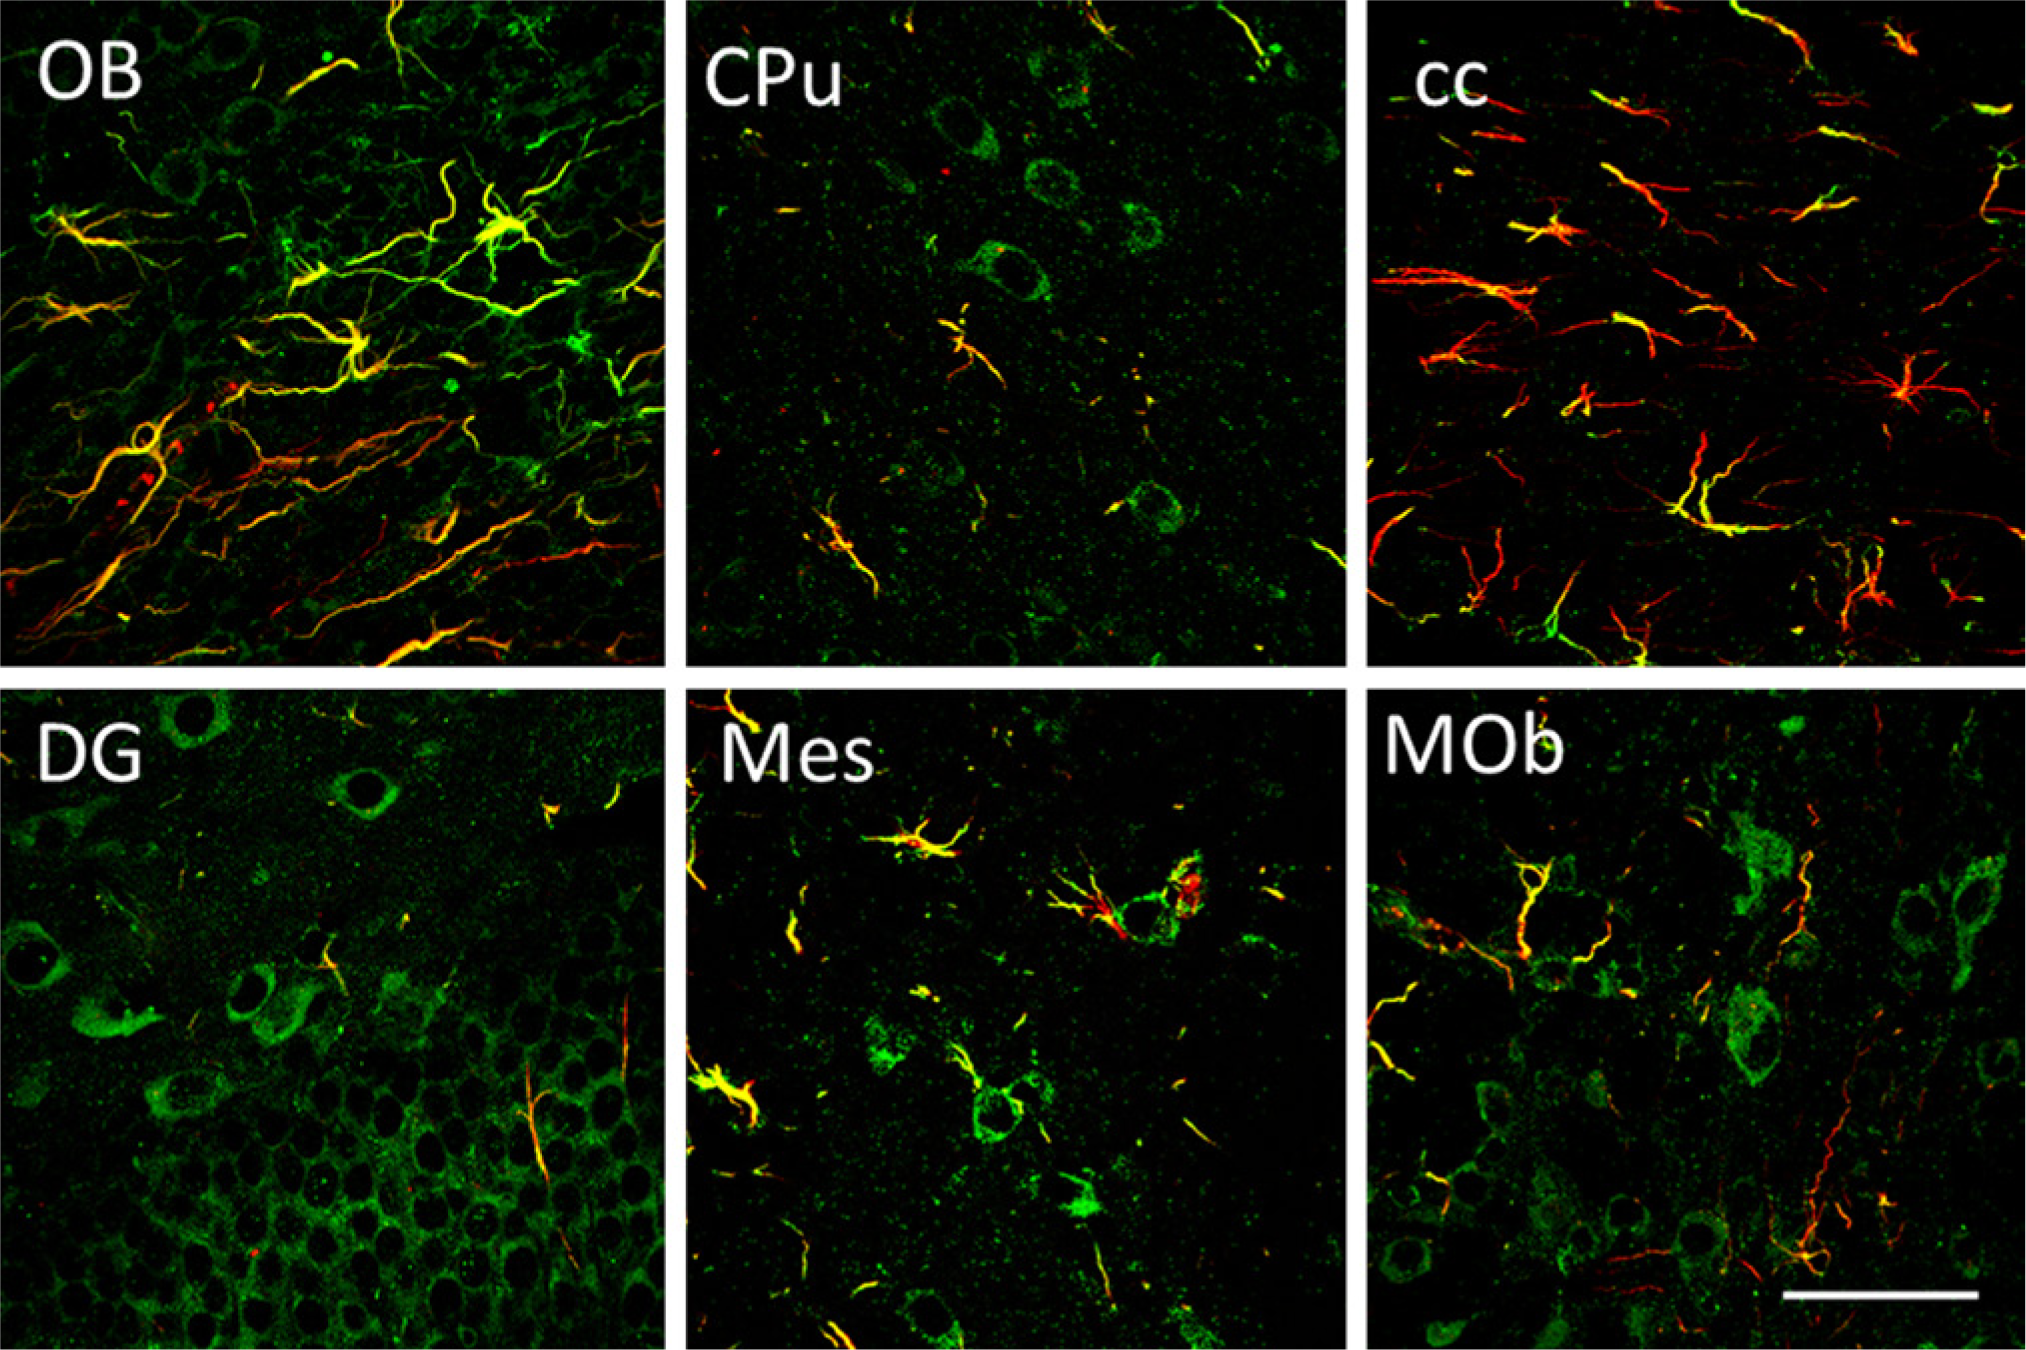
Expression of growth arrest specific 1 (GAS1) in astroglial cells as shown by immunofluorescence staining of GAS1 (green) and glial fibrillary acidic protein (GFAP) (red) in different regions of the adult mouse brain, as analyzed by laser confocal microscopy. (A) Olfactory bulb. (B) Caudate-putamen. (C) Corpus callosum. (D) Dentate gyrus. (E) Mesencephalon. (F) Medulla oblongata. Calibration bars = 50 µm.
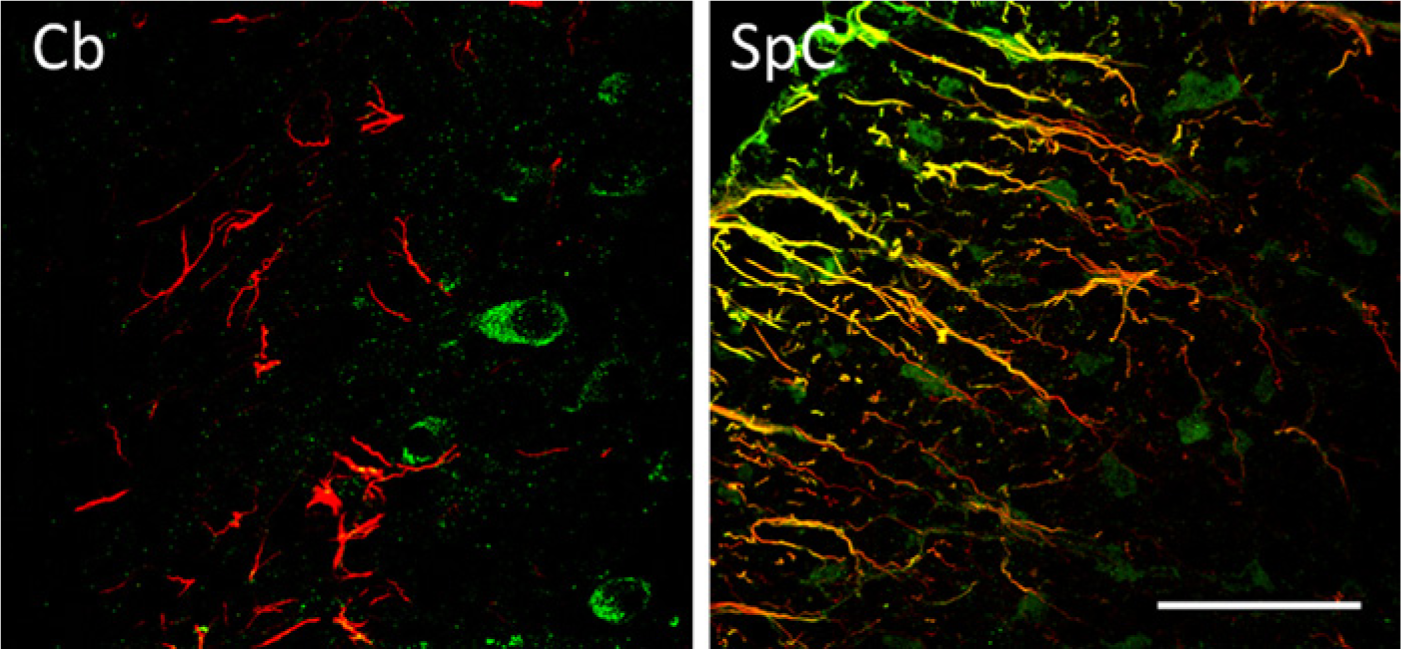
Expression of growth arrest specific 1 (GAS1) in astroglial cells as shown by immunofluorescence staining of GAS1 (green) and glial fibrillary acidic protein (GFAP) (red), as analyzed by laser confocal microscopy, in cerebellum (left panel) and in spinal cord (right panel). Calibration bars = 50 µm.
Taking all the data together, we conclude that GAS1 is expressed in all the regions studied in the adult mouse brain. This conclusion is based on the findings of GAS1 mRNA and of the protein, assayed by both western blot analysis and immunohistochemistry. Furthermore, double-staining immunohistochemical assays showed that GAS1 is extensively expressed in neurons and that it is also expressed, although in a more restricted manner, in astroglial cells.
Discussion
GAS1 was originally described as a protein associated with cell arrest (Schneider, King, and Philipson 1988). This property generated a great interest in understanding the function of GAS1 in cell cycle arrest, and death, so it could be used as a potential treatment for cancer. The reduced expression of GAS1 has been associated with a large number of tumors, and on the other hand, its over-expression has been used to induce cell death in several of these tumors. In either of these cases, targeted tumors include those originating in lung, thyroid, prostate, colon, and stomach; moreover, GAS1 has been proposed to be used as a biomarker for some of these tumors (Evdokiou and Cowled 1998; Rizzi et al. 2008; Jiang, Xu, and Cai 2011; Wang et al. 2012). GAS1 has also been implicated as an inhibitor of melanoma metastasis (Gobeil et al. 2008). In the case of gliomas, we have shown that the expression of GAS1 in these tumors induces cell arrest and apoptosis (Zamorano et al. 2003; Zamorano et al. 2004; Benitez et al. 2007; Dominguez-Monzon et al. 2009; Lopez-Ornelas et al. 2011).
Based on bioinformatics analyses, we proposed that GAS1 possesses a molecular structure similar to that of the receptors of the GDNF family of ligands (GFRαs) and that its effects preventing cell growth and inducing apoptosis are caused by its capacity to inhibit the intracellular signaling cascade elicited by GDNF (Schueler-Furman et al. 2006; Dominguez-Monzon et al. 2011). Further studies corroborated this hypothesis, and we have now molecularly dissected the pathway by which GAS1 induces an intrinsic apoptotic process. In this process, GAS1 inhibits the autophosphorylation of the Ret receptor, which prevents the activity of Akt, and in turn this facilitates the dephosphorylation of Bad, which translocates to the mitochondria and participates in the release of cytochrome-C to the cytosol, where it forms part of the apoptosome that activates caspase-9 and then caspase-3, leading to apoptosis of the cell (Lopez-Ramirez et al. 2008; Dominguez-Monzon et al. 2009; Zarco et al. 2012).
Although there is ample evidence for the relationship of GAS1 with cancer, and for the molecular mechanism by which it induces apoptosis, GAS1 exerts other effects, mostly related to its interaction with Boc and Cdo, facilitating the activation of the SHH pathway (Allen et al. 2011). It is interesting that the effects of GAS1 in inducing apoptosis are independent of the SHH pathway (Dominguez-Monzon et al. 2009; Dominguez-Monzon et al. 2011; Zarco et al. 2012). Previous experiments have shown that the overexpression of GAS1 can potentiate SHH signaling and that GAS1 inactivation decreases SHH signaling in the neural tube (Tenzen et al. 2006; Allen, Tenzen, and McMahon 2007; Martinelli and Fan 2007; Allen et al. 2011; Izzi et al. 2011). On the other hand, mutations in GAS1 are also associated with craniofacial malformations, revealing its function during development (Seppala et al. 2007). In the present study, we performed detailed analyses of the pattern of expression of GAS1 in the adult mouse brain. Tissue homeostasis can be defined as the balance between cell death and differentiation in response to extracellular signals, including factors involved in cell-to-cell contact. GAS1 is a GPI-linked protein, and this suggests that it may exert effects by binding with other signaling regulators including Ret, SHH, or GFRα1 and, in this manner, contribute to brain maintenance. Recently, it was demonstrated that GAS1 forms a complex with APP that negatively controls the vesicular trafficking of APP from the ER to the Golgi, and thus its maturation and processing (Chapuis et al. 2012). Here, we show that GAS1 is abundantly expressed in neurons, with a particularly high expression in hippocampus; hence, it will be relevant to further investigate this activity in the contexts of normal brain physiology and of its potential participation in Alzheimer’s disease.
Data of the decreased expression of GAS1 in human tumors, like gastric carcinoma, and thyroid tumors tacitly implicate its expression in adult human tissues but, so far, provide no indication of its function in normal, non-tumor cells (Wang et al. 2012). It has been reported that the expression of GAS1 is increased in hippocampus as a result of excitotoxic lesions, thus suggesting it is part of the gene expression program that leads to neuronal cell death; although in that article, no basal expression of GAS1 in adult rodent brain was noticed (Mellstrom et al. 2002).
It was recently demonstrated that GAS1 promotes myoblast differentiation (Leem et al. 2011) and that it is also an inhibitor of glomerular mesangial cell proliferation (van Roeyen et al. 2013). Moreover, enteric progenitors lacking GAS1 show altered responses to both GDNF and SHH and changes in the Ret signaling pathway, including Akt and Erk (Biau, Jin, and Fan 2013). Ret signaling mediates cell proliferation and survival through Erk and Akt (Airaksinen and Saarma 2002), and the expression of both Ret and SHH has been reported in different brain areas. In this study, we described the localization of GAS1 in both neurons and astroglial cells; thus, it will be pertinent to determine the expression of GAS1 and its function in neural cells that express Ret, GDNF, and SHH.
Previous studies using in situ hybridization showed the expression of the GAS1 gene in adult brain (www.brain-map.org; www.genepaint.org; www.stjudebgem.org). We have to consider, however, that these studies do not discriminate the cells expressing the mRNA and also that there is not necessarily a direct relationship between the levels of mRNA and protein expression. A transgenic mouse, in which the expression of a fluorescent reporter protein is driven by a GAS1 promoter, has been described. In this mouse, expression of the transgenic protein is observed in the CNS, including the cerebellum and the dentate gyrus (www.gensat.org). The pattern of expression of the reporter protein is consistent with that described from in situ hybridization assays. It appears that the distribution of the GAS1 protein we show in this article roughly corresponds with the previously mentioned reports. There is no doubt of the importance of transgenic models to understand the regulation and expression of genes. In this case, the transgenic mouse expresses a reporter gene (GFP) under the control of a UTR DNA sequence 5’ of the GAS1 coding region, contained in a BAC. Whereas this type of mouse has greatly reduced the positional effect of transgene insertion, it is not yet clear how the presence of other genes, transcription factors, microRNAs, or controlling regions present in these large DNA fragments may alter the expression of the protein under study (Matthaei 2007). Furthermore, the processing of the reporter protein is different from that of the endogenous protein: in this case, the reporter protein is soluble, thus its intracellular distribution is distinct from the endogenous (GAS1) protein. It has also been reported that GFP may silence transgenes, and in other cases the fusion of GFP to proteins affects the functioning of the cells (Dalle et al. 2005; Carnarius et al. 2012). In this article, we show the expression of the GAS1 gene by RT-PCR and of the native protein by western blot analysis and immunohistochemistry, providing higher anatomical resolution than the previously discussed works and distinguishing the cell types (neurons and astroglia) that express the GAS1 native protein in the adult brain. Furthermore, we present a semi-quantitative analysis of the levels of expression of GAS1, showing that it is one of the proteins with the highest concentrations in brain, particularly in cerebellum, where it is found in a 2:1 ratio compared with a constitutively expressed housekeeping protein, such as β-actin. Taking all this information together, we consider that the present study is complementary with others and that all collectively offer a more complete and accurate vision of the pattern of expression of GAS1, providing investigators with more tools to continue studying the function of GAS1 in the adult nervous system.
All this information, together with data that tie GAS1 with the development of both cerebellum and retina (Lee, May, and Fan 2001; Liu, May, and Fan 2001), prompted us to initiate a systematic search of GAS1 in adult mammalian brain; thus, the objective of this work is to provide the structural foundations for further investigations of the function(s) of GAS1 in the adult CNS. We report an extensive expression of GAS1 in brain at high levels, which are similar to, or even higher than, those of a housekeeping protein, as is β-actin, shown by western blot analysis. The fact that GAS1 is widely expressed in neurons, but in a more restricted manner in astroglial cells, may suggest that it is not fulfilling one single task, for instance, associated with the regulation of cell cycle or a metabolic process, but probably also particular functions related to the brain region and the specific neurons where it is expressed. At this point, we cannot tell which are these activities, but because of the high levels of expression of GAS1 and the variety of regions where it is found, it is likely to be relevant for brain functioning. We are currently investigating the specific neurochemical phenotypes of the neurons in which GAS1 is found, and the preliminary results suggest that GAS1 is expressed, as expected from the data shown in the present report, in neurons of different phenotypes but that there are not necessarily univocal relationships between GAS1 expression and neurochemical phenotypes (Bautista et al, unpublished results). The presence of GAS1 in astroglial cells is particularly interesting because it has been reported that, while GAS1 is expressed in neural stem cells, its levels decrease when the cells are differentiated to a glial phenotype (Obayashi et al. 2009). This, together with our previous observation of the lack of GAS1 in primary cultures of human gliomas (Dominguez-Monzon et al. 2009), leads us to hypothesize that GAS1 would not be expressed in adult astroglial cells, yet we identified GAS1/GFAP-positive cells in adult mouse CNS. As it is the case of neurons, we cannot at this point explain the functional role of GAS1 in astroglial cells. However, we find it intriguing that GAS1 is expressed in astrocytes in the encephalon, whereas in spinal cord it is associated with radial glia. It is also interesting that, although GAS1 is required for the normal development of the cerebellum (Liu, May, and Fan 2001), we detected no expression of GAS1 in astroglia of the adult cerebellum.
Taking into consideration the different roles of GAS1, including inducing cell arrest and apoptosis of tumor cells, during development and in the adult organism, the pleiotropic capacities of GAS1 become evident, and a thorough and systematic study of its expression becomes necessary. This, in conjunction with its intricate spatio-temporal pattern of expression, points to a critical and complex set of physiological functions in mammals in which GAS1 integrates different intercellular signaling systems. There is an abundant expression of GAS1 in the adult CNS, and we consider it essential to carefully describe its anatomical and histological distribution to provide the groundwork for future investigations of its function. In summary, we report an extensive expression of GAS1 in the adult CNS, indicative of a relevant involvement of GAS1 in brain functioning and activity.
Footnotes
Declaration of Conflicting Interests
The author(s) declared no potential conflicts of interest with respect to the research, authorship, and/or publication of this article.
Funding
The author(s) disclosed receipt of the following financial support for the research, authorship, and/or publication of this article: This work was partially supported by Conacyt (Mexico) grants 42993 (RA-R) and 127357 (JS).
References
Supplementary Material
Please find the following supplemental material available below.
For Open Access articles published under a Creative Commons License, all supplemental material carries the same license as the article it is associated with.
For non-Open Access articles published, all supplemental material carries a non-exclusive license, and permission requests for re-use of supplemental material or any part of supplemental material shall be sent directly to the copyright owner as specified in the copyright notice associated with the article.