
Abstract
The comet assay is a well-established, simple, versatile, visual, rapid, and sensitive tool used extensively to assess DNA damage and DNA repair quantitatively and qualitatively in single cells. The comet assay is most frequently used to analyze white blood cells or lymphocytes in human biomonitoring studies, although other cell types have been examined, including buccal, nasal, epithelial, and placental cells and even spermatozoa. This study was conducted to design a protocol that can be used to generate comets in subnuclear units, such as chromosomes. The new technique is based on the chromosome isolation protocols currently used for whole chromosome mounting in electron microscopy, coupled to the alkaline variant of the comet assay, to detect DNA damage. The results show that migrant DNA fragments can be visualized in whole nuclei and isolated chromosomes and that they exhibit patterns of DNA migration that depend on the level of DNA damage produced. This protocol has great potential for the highly reproducible study of DNA damage and repair in specific chromosomal domains.
Keywords
The alkaline comet assay is widely used in various research areas, including biomonitoring, routine genotoxicity assessment, and studies of DNA repair processes. Ostling and Johanson (1984) were the first to quantify DNA damage in cells using a microgel electrophoresis technique known as “single-cell gel electrophoresis” or the “comet assay.” However, the neutral conditions they used only allow the detection of double-stranded DNA breaks. Later, the protocol was adapted by Singh et al. (1988) for use under alkaline conditions, producing a sensitive version of the assay that could assess both double- and single-stranded DNA breaks and detect alkali-labile sites, which are expressed as frank strand breaks in DNA. Since its initial development, the assay has been modified at various steps (lysis and electrophoretic conditions) to make it suitable for assessing different types of DNA damage in different cell types (Collins 2004; Speit and Hartmann 2005). The assay is now a well-established, simple, versatile, visual, rapid, and sensitive tool, used extensively to assess DNA damage and DNA repair in individual cell populations (Olive and Banath 2006). Some other lesions involved in DNA damage, such as DNA crosslinks (e.g., thymine dimers) and oxidative DNA damage, can also be assessed using lesion-specific antibodies or specific DNA repair enzymes in the comet assay. The assay has gained wide acceptance as a valuable tool in fundamental DNA damage and repair studies (Speit and Hartmann 2005), genotoxicity testing (Moller 2005), and human biomonitoring (Kassie et al. 2000; Moller 2006a). White blood cells or lymphocytes are the cell types most frequently tested with the comet assay in human biomonitoring studies (Angerer et al. 2007; Faust et al. 2004; Moller 2006b). However, other cells have also been assayed, including buccal (Szeto et al. 2005), nasal (Mussali-Galante et al. 2005), epithelial (Emri et al. 2004; Graham-Evans et al. 2004; Rojas et al. 2000), and placental cells (Augustowska et al. 2007) and spermatozoa (Delbes et al. 2007; Fraser 2004; Schmid et al. 2007; Singh et al. 2003), with the simultaneous detection of single- and double-stranded breaks (Enciso et al. 2009). In all these cases, the final level of analysis is the cell nucleus and there have been no attempts to investigate the capacity of the comet assay to analyze DNA damage in individualized subnuclear units, such as the chromosomes, although specific genomic regions can be probed using a combination of the comet assay in whole nuclei and fluorescence in situ hybridization (FISH–comet; Fernández et al. 2001a). This methodological variant allows DNA breakage to be sensitively screened after its exposure to various kinds of DNA-damaging agents and is a good tool for assessing the distribution of region- or locus-specific DNA damage in the whole genome (Hovhannisyan 2010; Spivak 2010).
The present study was conducted to adapt the method of the alkaline comet assay to visualize putative DNA damage in subnuclear structures such as metaphase chromosomes.
Materials and Methods
HeLa Cell Cultures
HeLa cells were obtained from the European Collection of Cell Cultures (Wiltshire, UK). The cells were cultured with standard procedures in flasks at 37C in RPMI medium supplemented with 15% fetal calf serum, 1% glutamine, and antibiotics (streptomycin–penicillin) in an atmosphere supplemented with 5% CO2.
Chromosome Isolation
Chromosomes were isolated according to the method described by Goyanes and Méndez (1982), developed to isolate metaphase chromosomes for whole mounting for electron microscopy. The cells were arrested at metaphase by treatment with 0.5 µg/ml colchicine for 3 hr, harvested, and treated for 10 min with 0.075 M Kcl at 37C. After the hypotonic treatment, the cells were centrifuged at 1200 rpm (200 × g) for 7 min and the pellet was covered in acid isolation buffer (1% citric acid, 1% Triton X-100, and 6 mM MgCl2) for 30 min at room temperature. The cells were gently syringed 7–10 times through a 22-gauge needle, and the presence of isolated chromosomes was monitored by phase-contrast microscopy. At this stage, the isolated chromosomes can be classified, using florescence microscopy and image analysis, accordingly with the chromatin mass (CM). The CM is the resulting value after the area of the region of interest (ROI) selected after image analysis is correlated with the mean gray value obtained for the threshold region (CM = ROI area × mean gray value): for whole cells, CM > 200E10−400E10; for large chromosomes, CM > 100E10−200E10; for medium chromosomes, CM > 10E10−100E10; and for small chromosomes, CM = 5E5−10E10. Image processing included a fixed exposure time and current protocols for single-image background subtraction. The image analysis and processing for quantitative microscopy were performed using the Leica Qwin software (Leica Qwin; Leica Microsystems, Barcelona, Spain) to compare the CM and tail lengths generated for each chromosome and whole nucleus.
Comet Assay
The isolated chromosomes and cells were processed at room temperature by suspending the cells in RPMI medium to a final concentration of 5 × 10⁶ cells/ml. This chromosome–nuclei suspension was then mixed with low-melting-point agarose (0.7%) at 37C, and a 15-µL aliquot was placed onto a precoated glass slide (Halotech SL, Madrid, Spain). The cell–agarose mixture was then covered with a cover slip (10 mm × 60 mm) and allowed to solidify at 4C for 5 min. After the gel had solidified, the cover slips were gently removed and the slides were then ready for further processing.
The alkaline comet assay was performed using the basic rationale of Singh et al. (1988), with modifications. The slides were immersed in two lysis solutions for 30 min each at room temperature. The first solution contained 0.4 M Tris-HCl (pH 7.5) and 1% SDS, and the second solution contained 0.4 M Tris-HCl (pH 7.5), 1% SDS, and 0.05 M EDTA. The slides were washed in 1 × TBE buffer (89 mM Tris, 89 mM boric acid, 2.5 mM EDTA, pH 8.3) for 10 min and then treated with fresh alkaline solution (0.03 M NaOH, 1 M NaCl) for 2.5 min to cleave the alkali-labile sites. The slides were placed horizontally in an electrophoresis tray, which was filled with fresh alkaline electrophoresis solution (0.03 M NaOH, pH 13). Electrophoresis was performed at 20 V for 12.5 min at room temperature. After electrophoresis, the slides were gently removed from the tray and washed with neutralizing buffer (0.4 M Tris-HCl, pH 7.5) for 5 min. The slides were washed in distilled H2O for 5 min and then dehydrated in a sequential series of 70%, 90%, and 100% ethanol. Finally, the slides were stained with propidium iodide (20 µg/ml) and visualized under a Leica DMLA model motorized epifluorescence microscope controlled with software for automatic scanning and image digitization (Leica Microsystems). A Leica EL6000 fluorescence light source equipped with a metal halide lamp and a PL-Fluotar 40× objective was used for routine analysis, and a PL-Fluotar 60× objective was used to capture the images. The images were captured with a CCD DFC-350-FX Leica (scientific grade) for 8-bit gray-level imaging. A fluorescence filter block from Semrock (595-615 LF561-A; Semrock, Inc., Rochester, NY) was used for propidium iodide visualization.
The slides produced contained isolated chromosomes and whole nuclei or cells at interphase that were still recognizable on the slides after the chromosome isolation. In each experiment, 100 whole nuclei and 150 isolated chromosomes (50 large chromosomes, 50 medium chromosomes, and 50 small chromosomes) were included in the analysis and were classified into two categories: nuclei or chromosomes showing (a) slight chromatin displacement or no comet (no DNA damage) or (b) a prominent comet (DNA damage; see Figure 1).
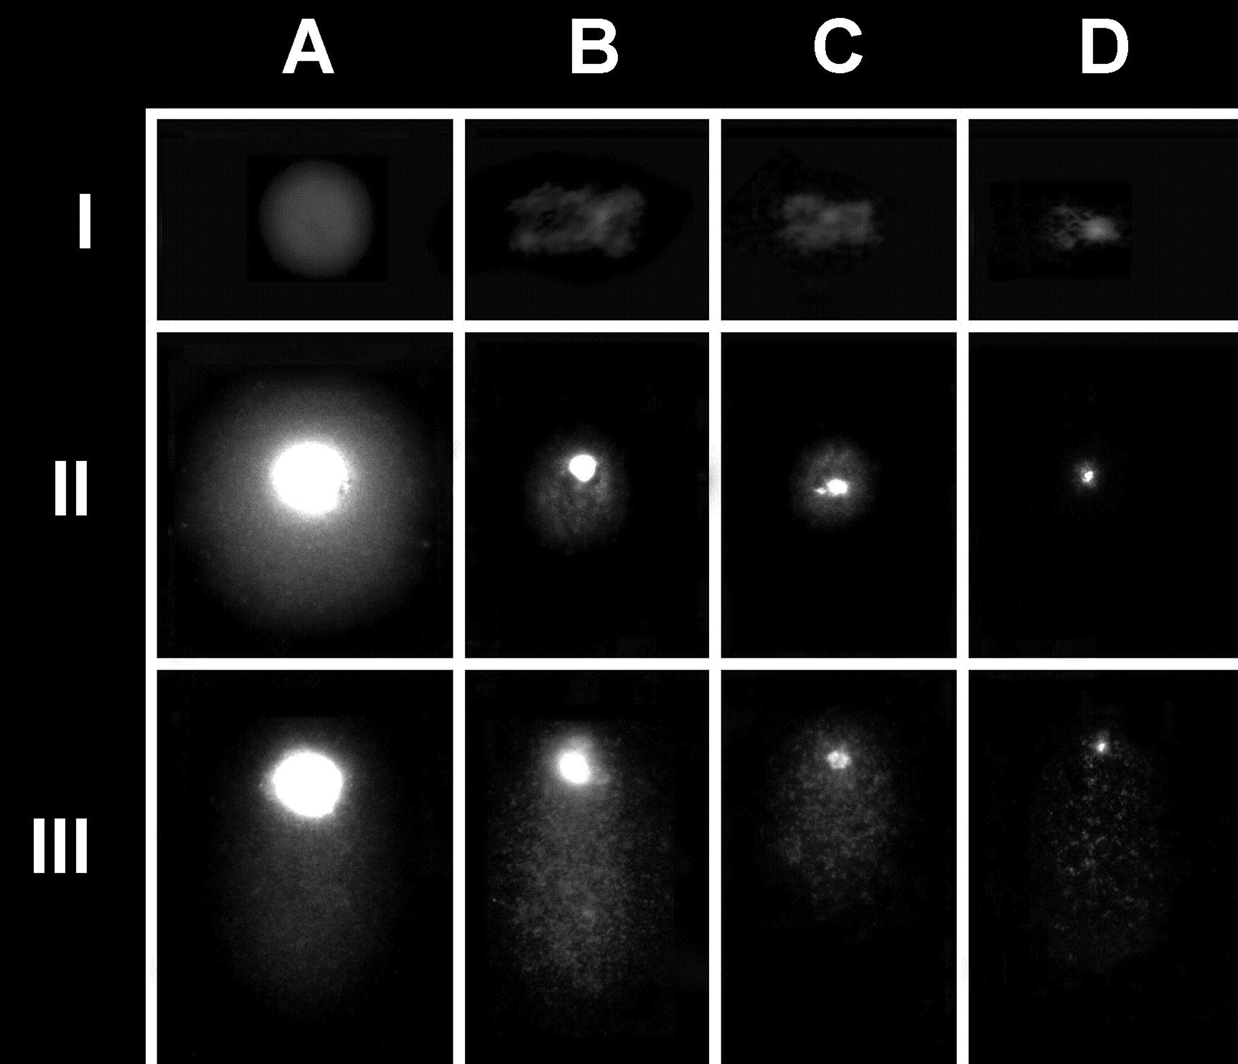
An overview of the chromosome-comet assay. I. Nuclei (A) and chromosomes (B, C, D) isolated from HeLa cells before protein depletion (I) and after protein depletion and alkaline electrophoresis (II and III). Level II includes nuclei and isolated chromosomes without DNA damage, whereas level III includes selected nuclei and chromosomes with clearly apparent DNA damage.
Positive Control
Microgel slides with isolated chromosomes and whole interphase cells were treated with 20 µM hydrogen peroxide for 30 min to produce massive single-stranded DNA damage. The slides were gently washed with PBS at 37C for 30 min and processed for the comet assay as previously described.
Statistical Procedures
Differences in CM among the chromosomes were assessed with one-way analysis of variance. A two-sided probability level of ≤0.05 was deemed significant. All analyses were performed with SPSS for Windows 13.0 (SPSS Inc., Chicago, IL).
Results and Discussion
HeLa cells treated with isolation buffer, when processed for electron microscopy and immobilized in a low-melting-point agarose support, produce a morphology good enough to distinguish whole nuclei (Figure 1, IA) or discrete isolated chromosomes in which the centromeric regions can be recognized (Figure 1, IIB, IIC, IID). This morphology varies substantially after protein depletion and electrophoresis. For example, the centromeric region of each individual chromosome can no longer be identified (Figure 1, IIB, IIC, IID). After controlled protein depletion and electrophoresis, both the whole nuclei (Figure 1, IIA) and the isolated chromosomes (Figure 1, IIIB, IIIC) displayed visible “comets,” with longer tails as the DNA damage became more intense (compare level II with level III in Figure 1). Thus, this method allows the discrimination of chromosomes without DNA damage from chromosomes with different levels of DNA damage, which can then be classified as mild, moderate, or severe (Figure 2).
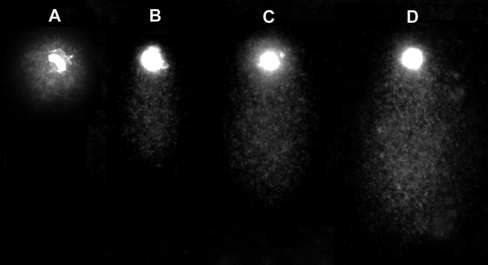
Chromosomes of HeLa cells after the comet assay, showing isolated chromosomes without DNA damage (A) or displaying different-sized tails according to the level of DNA damage: mild (B), moderate (C), and severe (D).
Under our experimental conditions, the percentage of damaged nuclei at interphase after the cells were harvested was 8%. The level of DNA damage in the isolated chromosomes was similar: large chromosomes were affected in 12% of cases, medium chromosomes in 9% of cases, and small chromosomes in 11% of cases. In contrast, the positive controls treated with H2O2 showed an appreciable increase in DNA damage, ranging from 87% of the whole nuclei to 93%, 89%, and 96%, respectively, of the isolated chromosomes.
Image analysis was used to compare the CMs and tail lengths distributed on each chromosome and in whole cells displaying a comet (Figure 3). We found no correlation between the whole DNA content and the level of DNA breaks calculated from the size of the tail on the comet (r2 = 0.18; p ≥ 0.05). Therefore, the DNA damage produced by H2O2 treatment did not seem to be induced at random, nor was it dependent on the chromosome size, but rather occurred at specific preferred sites or “hot spots” for this agent. These results are consistent with previous observations that, for example, these specific sites are not homogeneously disseminated within the genome in human and mouse cells. In the human genome, the most sensitive sites are associated with specific DNA sequences, such as satellite DNA 1, and 5 bp classical satellite DNA sequences on chromosome 1 (D1Z1 locus), chromosome 9 (D9Z3 locus), and the Y chromosome (DYZ1 locus) (Fernández et al. 2001b; Vázquez-Gundín et al. 2002). In the mouse, the major satellite DNA families, localized in the pericentromeric regions of each chromosome, are particularly sensitive to damage (Fernández et al. 1995).
These particular regions of the genome, which also include telomeric-like or subtelomeric DNA regions, are considered hot spots for the formation of symmetric exchanges between homologous chromatids, and cryptic aberrations in these regions are associated with human congenital abnormalities (Fernández et al. 1995; Obe et al. 2002). An inverse relationship has been observed between the density of active genes and the UV light sensitivity of DNA, insofar as gene-poor chromosomes seem to be more damaged than gene-rich ones. For example, the more highly sensitive X chromosome in female nuclei is probably the inactive X chromosome, which has a low density of actively expressed genes. Conversely, in humans, chromosomes 1 and 19, which have high densities of active genes, show low susceptibility to DNA damage. In contrast, X-ray-induced DNA damage occurs preferentially in gene-rich regions, indicating a different overall damaging mechanism, which is probably related to different subchromosomal DNA–protein interactions (Tucker and Senft 1994).
In future studies, the chromosome–comet assay, using the same rationale reported here but coupled to different whole-chromosome-painting DNA probes or single- chromosome DNA probes, may target DNA damage induced in specific chromosomal regions. In this way, we can gain precise information about putatively random or localized distributions of DNA damage. This information should extend our understanding of the chromosomal architecture, subchromosomal organization, and the role of DNA–protein interactions in chromosomal receptivity to DNA damage.
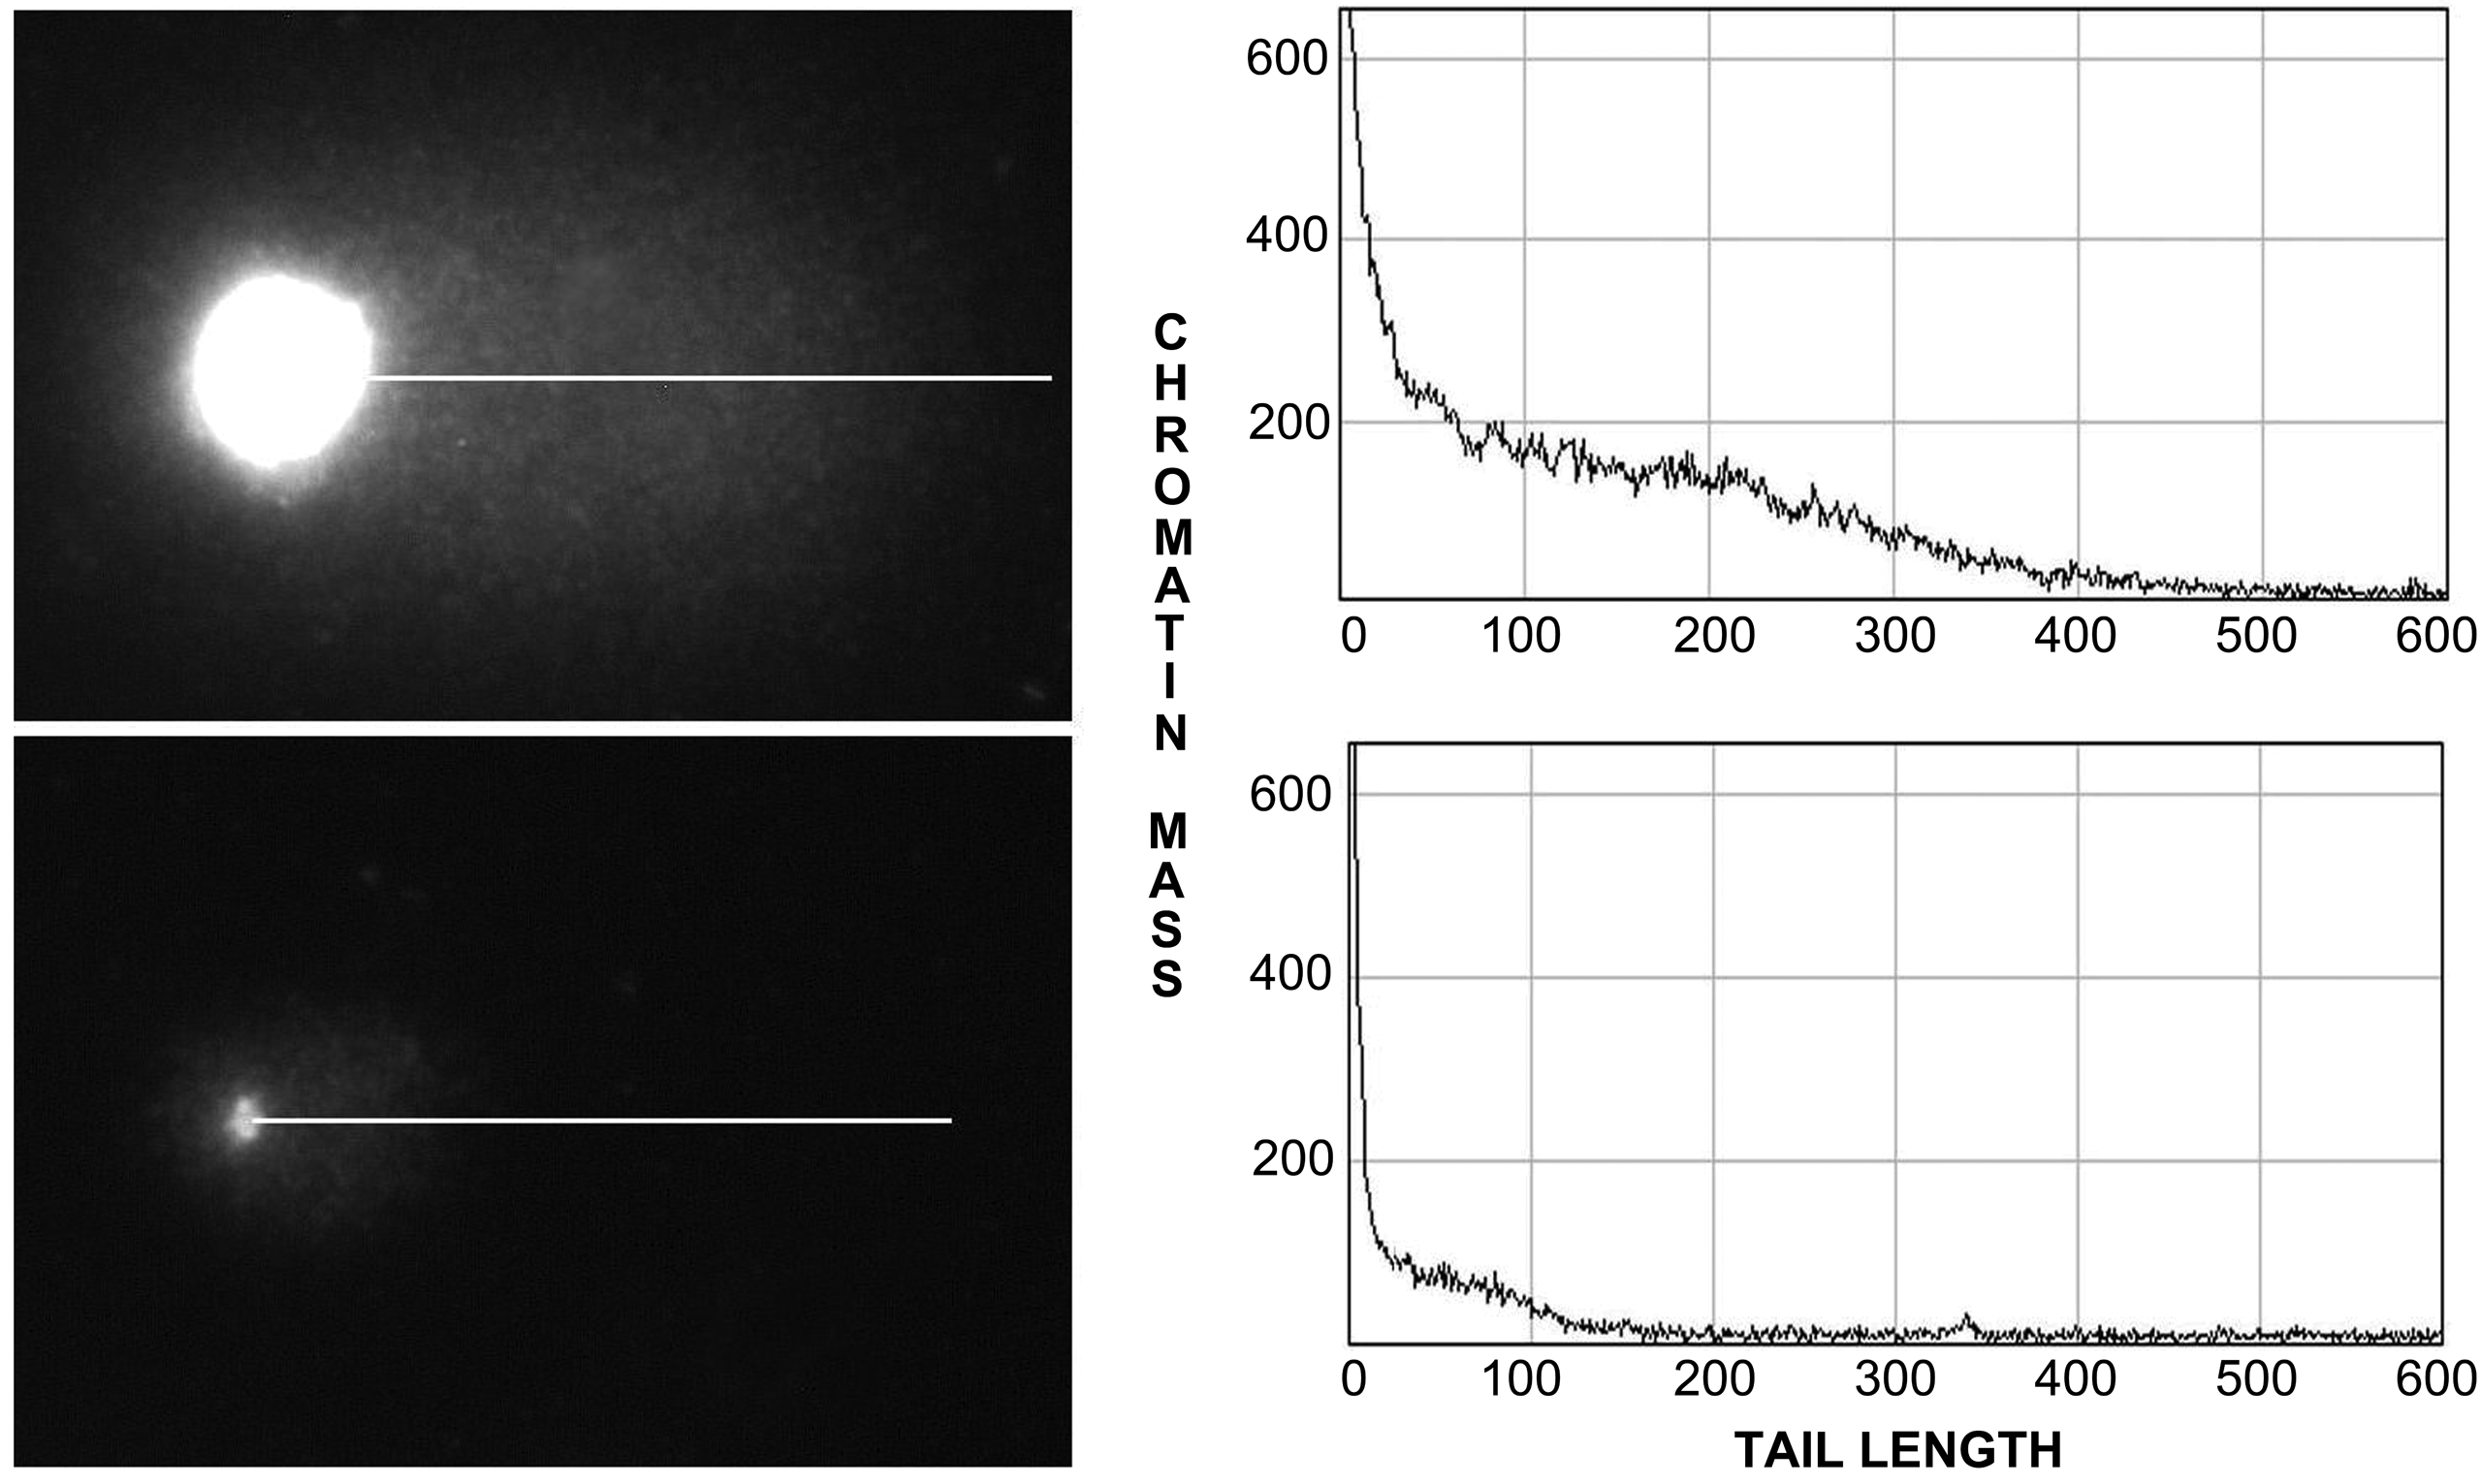
Alkaline comet assay of a whole nucleus and a small chromosome from HeLa cells. The graphic on the right shows the densitometric relationship between the chromatin mass and the comet tail length.
Conclusions
We have developed a new technique, based on chromosome isolation and the comet assay, to detect DNA damage in human chromosomes. This protocol has great potential for the highly reproducible investigation of DNA damage and repair in specific chromosomes or chromosomal domains. Once the technique has been established, we must investigate its sensitivity in other experimental contexts, for example (a) to record the susceptibility to DNA damage of different subchromosomal domains, using specific DNA probes, and/or (b) to establish chromosomal dose–response curves for classical damaging agents, such as different doses of ionizing radiation.
Footnotes
The author(s) declared no potential conflicts of interest with respect to the authorship and publication of this article.
The author(s) received no financial support for the research and authorship of this article.