
Abstract

The importance of the mitotic index (MI) as a prognostic factor in veterinary oncology has been emphasized recently. 5, 12– 14 In their interesting exploratory study on canine cutaneous mast cell tumors, Romansik et al. 12 showed a significant association between MI and overall survival, which could be important for clinical decision making, especially in the case of Patnaik grade II tumors. The median survival time for dogs with a tumor MI ≤ 5 was significantly longer than for those with a MI > 5, regardless of the grade. Similarly, dogs with Patnaik grade II tumors and a MI ≤ 5 survived longer than those with a MI > 5. The cut-point applied in this study was based on the distribution of the MI, as well as on MI categories published for other tumor types.
Because the choice of the cut-point is critical in prognostic factor studies 6, 7 and because the clinical relevance of new prognostic indicators should always be investigated in an independent group, 9, 10, 12 we started a validation study to test the utility of the cut-points suggested by Romansik et al. 12 Fifty-seven dogs with cutaneous mast cell tumors were included in this study. In every case, the diagnosis had been confirmed independently by 3 veterinary pathologists, and complete follow-up information had been obtained. The tumor grade was determined according to Patnaik 12 by consensus of the 3 observers. The number of mitotic figures/10 high-power fields was counted as described by Romansik et al. 12 and compared with survival data in a Cox proportional hazards model using MI as a stratified variable. 4 The mean MI of grade 1 tumors (n = 5) was 0.6 (range: 0–3). Grade II tumors (n = 41) had a mean MI of 2.2 (range: 0–16); grade III tumors (n = 11) had a mean MI of 7.4 (range: 0–21; Kruskal-Wallis test P = .0033). The Dunn posthoc test showed significant differences between grades I and II and between I and III but not between II and III. Furthermore, a Jonckheere-Terpstra test demonstrated that the MI values increased with grade (P = .001). When applying a cut-point at MI = 5, our results were very similar (Figs. 1, 2) to those reported by Romansik et al. 12 Dogs with an MI > 5 had a median survival time of 8 months, whereas dogs with MI ≤ 5 did not reach median survival time (P = .003; log-rank test). Next, we looked for other cut-points, submitting the MI values to a cluster analysis according to the Ward algorithm after a logarithmic transformation. 2, 9, 11 Furthermore, the R2 values, also called coefficients of determination, of each Cox regression were recorded. R2 varies between 0.0 and 1.0 and can be interpreted as the fraction of the total variance of the survival regression, which is explained by the MI score system. Finally, the stability of the regressions was tested by bootstrap resampling. This technique creates new data sets of equal size by random sampling of the original data with replacement. Then for each of these “new” sets a new Cox regression is calculated and the variables entering the “new” regressions are recorded. 1, 3, 4, 8 WinStat 3.1 and SPSS 8.0 software was used.
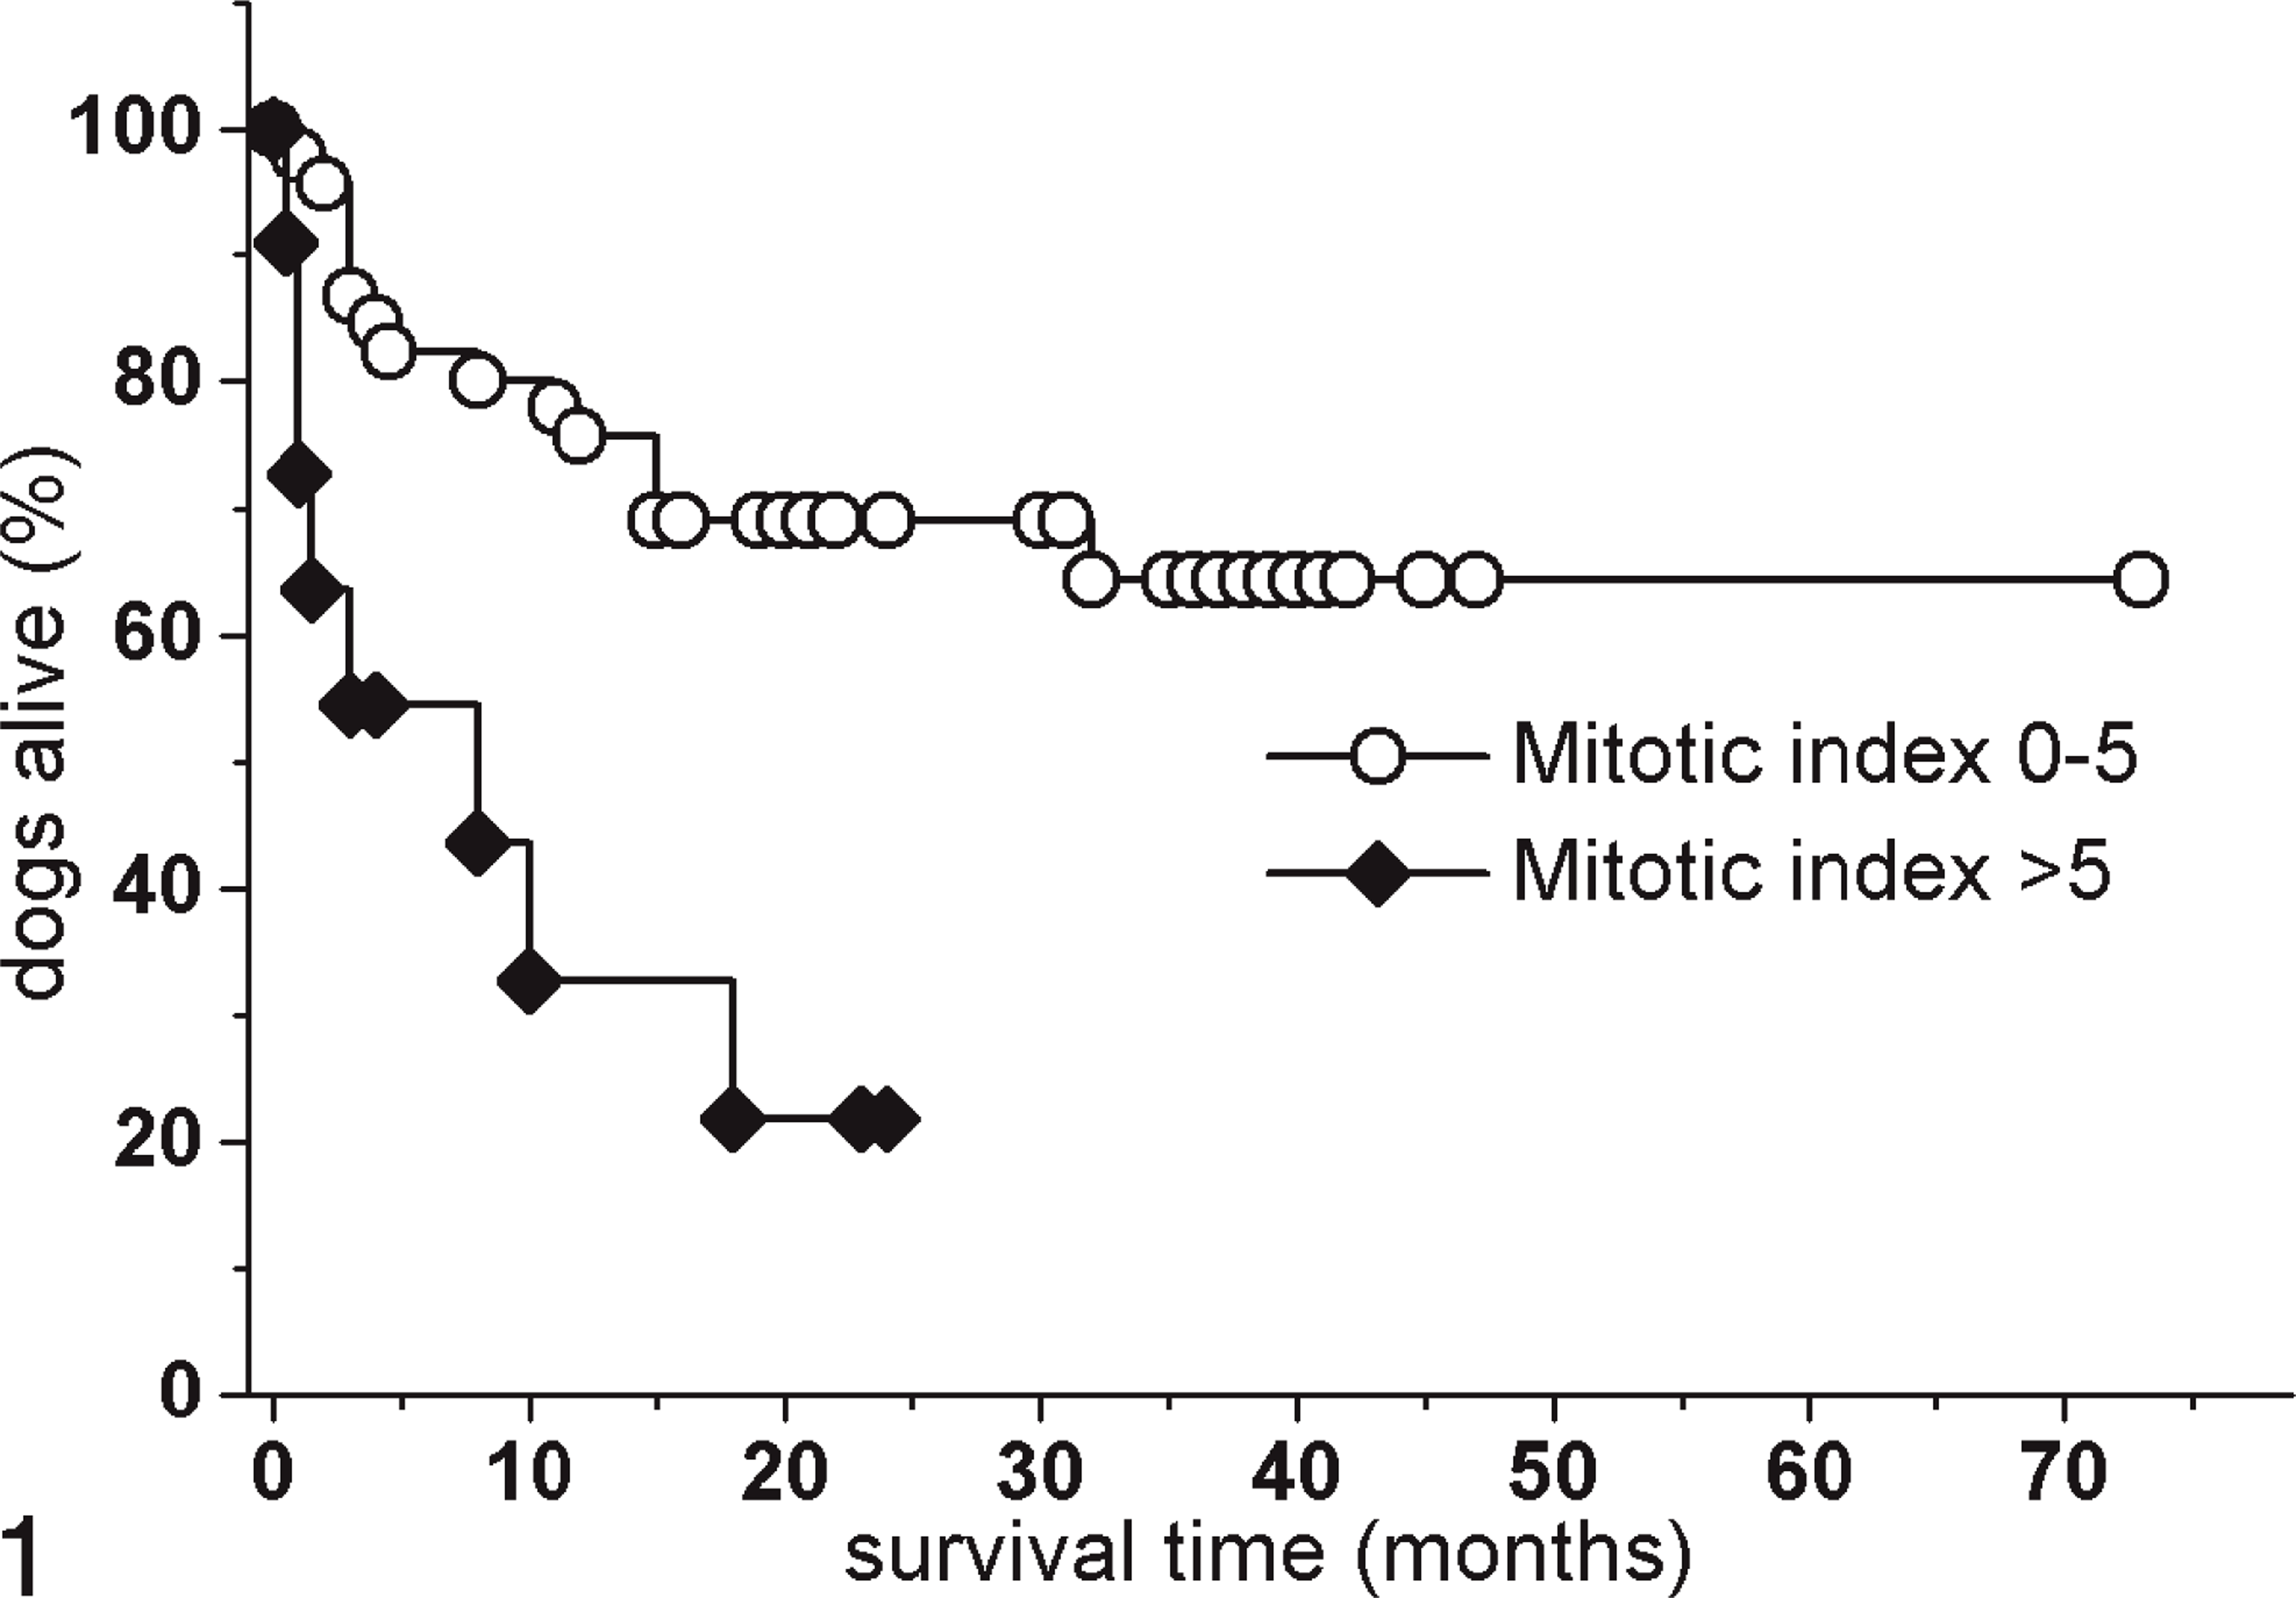
Kaplan-Meier survival plot of all dogs (n = 57). Stratification at a cut-point of MI = 5. Log-rank test P = .003.

Kaplan-Meier survival plot of grade II tumor-bearing dogs (n = 41). Stratification at a cut-point of MI = 5. Log-rank test P = .09.
The dendrogram derived from the cluster analysis strongly suggested the creation of 3 groups: 1) dogs with tumor MI = 0, which did not reach median survival; 2) dogs with tumor MI between 1 and 7 and a median survival time of 18 months; and 3) dogs with tumor MI > 7 and a median survival of 3 months (Fig. 3). When looking only at the subgroup with grade II tumors (Fig. 4), dogs with a tumor MI = 0 did not reach median survival, whereas dogs with a tumor MI between 1 and 7 had a median survival time of 15 months. The R2 value of Cox regression applying the MI stratification of Romansik et al. 12 was 0.05588 and therefore lower than that of the stratification proposed in this study (0.08596). The higher explanatory power of the latter was confirmed by the bootstrap resampling study: when comparing both MI stratifications simultaneously in 100 new bootstrap sets, the MI stratified according to our method entered into the final Cox model in 91% of the resampling sets; the MI stratified according to Romansik in only 9%.

Kaplan-Meier survival plot of all dogs (n = 57). Stratification in 3 groups; log-rank test P < .0001. Median survival time for group 3 (MI > 7), 3 months; for group 2 (MI between 1 and 7), 15 months; group 1 did not reach median survival time.

Kaplan-Meier survival plot of grade II tumor-bearing dogs (n = 41). Stratification at a cut-point of MI = 0/1 and MI = 7/8; log-rank test P = .0096. Group 3, composed of only 2 dogs, was not included in the diagram. Median survival for MI 1–7: 15 months.
In summary, our investigation underlines the prognostic importance of the mitotic count for dogs with cutaneous mast cell tumors. However, we believe that a stratification in 3 groups with cut-points at 1 and 7 mitoses per 10 high-power fields is superior to the stratification proposed by Romansik et al. 12 Further independent studies are necessary to corroborate our proposal.