
Abstract
Objectives
England's National Health Service (NHS) introduced a 62-day target, from referral to treatment, to make lung cancer patient pathways more efficient. This study aims to understand pathway delays that lead to breaches of the target when patients need care in both secondary and tertiary setting, so more than one institution is involved.
Design
Mixed methods cross case analysis.
Setting
Two tertiary referral hospitals in London.
Participants
Database records of 53 patients were analysed. Nineteen sets of patient notes were used for pathway mapping. Seventeen doctors, four nurses, eight managers and administrators were interviewed.
Main outcome measures
Qualitative methods include pathway mapping and semi-structured interviews. Quantitative analysis of patient pathway times from cancer services records.
Results
The majority of the patient pathway (68.4%) is spent in secondary centres. There is more variability in the processes of secondary centres but tertiary centres do not have perfect processes either. Three themes emerged from discussions: information flows, pathway performance and the role of the multidisciplinary approach.
Conclusions
The actions of secondary centres have a greater influence on whether a patient breaches the 62-day target, compared with tertiary centres. Nevertheless variability exists in both, with potential for improvement.
Introduction
The ‘NHS Cancer Plan: A plan for investment, a plan for reform’ aimed to reduce cancer mortality rates in England. One reason that cancer patients in England often have poorer prognoses than European counterparts was thought to be the time taken from initial referral to diagnosis and treatment.
DECLARATION
None declared
None
Ethical approval was obtained from the Brompton, Harefield and NHLI Ethics Committee (reference 07/Q0404/14). In line with its requirements, written informed consent was obtained from patients and staff
TH
All authors conceived the study and developed the design. HI, TA, AZ and RK collected the data. HI, TA, MD, AZ, DG and RK analysed the data and wrote the full report. HI drafted the paper. All authors had access to drafts and opportunity to contribute. HI and TH approved the final version
In a drive to reduce the time taken, the plan introduced a target of a maximum two-month (62-day) wait for patients from urgent GP referral with suspected cancer to the start of treatment. It seems to do that. The proportion of patients meeting the 62-day target increased from 75.8% in May 2005 to 94.5% in July 2006 nationwide. 1 However, the figure for Royal Brompton & Harefield NHS Trust (specializing in heart and lung diseases) was only 35% for the first quarter of 2006/2007 and 72.7% for the second quarter.
Most existing literature measuring delays in lung cancer pathways are retrospective audits of patient notes,2–5 in which delays are calculated from key dates. Waiting times for investigations and treatment appear to be problematic.6–8 These quantitative studies provide useful information about where delays may be occurring, but they fail to address why.9,10 Qualitative analysis is necessary to explain dysfunctional parts of the pathway and identify improvement.11,12
Studies7,13,14 have been conducted at individual tertiary centres, but they do not compare pathways between centres or seek to understand issues specific to the local context. In this study we aimed to assess how much of the responsibility for lung cancer patient pathways rested with the tertiary centres (Royal Brompton & Harefield NHS Trust). We compare the two hospitals’ approaches and considered how best they could improve their service to patients.
Methods
We conducted a mixed methods case study evaluation of two London tertiary centres. Although Royal Brompton Hospital (RBH) and Harefield Hospital (HH) belong to the same Trust, their internal pathways and referral sources differ.
Data sources
Quantitative data were retrieved from the Trust's InfoFlex Toolset. This recorded the progression of all target patients through the lung cancer pathway (May 2006 to May 2007). From the total sample of 214 patients, 53 were included for analysis (meeting the inclusion criteria of relevance to the 62-day target and adequate dataset).
We validated draft pathway maps (Appendix A), from the Trust Cancer Services Department, to see if they represented current practice. We did this by extracting metrics from nine sets of patient notes at RBH and 10 at HH. 14 Patients were selected through opportunistic and criterion sampling.
To obtain qualitative data, we purposively sampled staff at both sites. Eleven and 16 interviews were conducted at RBH and HH, respectively, in addition to two interviews of staff who worked at both sites, at which point data saturation was attained. Semistructured, face-to-face interviews were conducted using an interview guide [Appendix B].
Ethical approval was obtained from the Brompton, Harefield and NHLI Ethics Committee (reference 07/Q0404/14). In line with its requirements, written informed consent was obtained from patients and staff.
Data analysis
Analysis involved three stages: each source (quantitative, pathway maps, interviews) was analysed independently; these analyses were integrated by narrative synthesis at each site; finally we carried out a cross case analysis.
The raw quantitative data contained key dates from the patient pathway. These were processed to calculate the length of specific pathway segments. Using statistical methods, we tested three hypotheses: (1) most pathway time lies upstream (i.e. in secondary rather than tertiary centres); (2) secondary centres have greater influence on pathway length; and (3) there is greater variability upstream.
Pathway mapping highlighted:
15
Unnecessary delays; Unnecessary steps/handovers; Duplication of effort/waste; Illogical issues; Likely hotspots, bottlenecks or constraints.
We carried out content analysis 11 of the interview data for the two sites using the framework approach. We then compared and synthesized results from the two sites.
Results
Quantitative data
‘Most Pathway Time Lies Upstream’: The mean length of the total patient pathway from GP referral to treatment for all patients was 50.3 days (Table 1). The mean length of the secondary centre pathway was 34.4 days, compared with 15.9 for the tertiary centre. Hence, most of the patient pathway lies in the secondary centre (68.4%). This result was statistically significant at the 0.05 level. The mean length of the total pathway is 52.6 days for those who are referred to HH, while the corresponding figure for patients referred to RBH is 42.4 days. The difference between time spent on the two tertiary centres’ pathways was only 1.1 days. So the substantive difference lies in the time spent in the secondary centres; patients spend 11.4 days more in the secondary centre pathway for HH than that for RBH. ‘Secondary Centres Have Greater Influence On Pathway Length’: As the total length of the pathway increases, the time spent in the secondary and tertiary centres increases at different rates (Figure 1). This correlation is accentuated when looking at HH independently, as opposed to RBH (figures in Appendix D). Since more time is spent in the secondary centres, they appear to have a greater influence on the total pathway time and therefore any breach of the 62-day target. However, tertiary centres have some influence over their own internal pathway times. Take patients 28–31 (Appendix D), for example: all total pathway durations are 61 days, just shy of breaching. The tertiary centre pathway is reduced to prevent breaches when patients are sent late by secondary centres (e.g. patient numbers 12, 25 and 28 in Appendix D). In comparison, patients who arrive well before the breach date may take longer to progress through the tertiary centre pathway (e.g. patient numbers 29 and 34 in Appendix D). ‘There Is Greater Variability Upstream’: The range of the values in Table 2 suggests substantial variability in total pathway length. Total pathway times could be as short as 19 days or as long as 91 days. The standard deviation is another measure of the spread of values. When data for RBH and HH are combined, the standard deviation for the time spent in the secondary centre (11.9 days) is greater than the standard deviation for the tertiary centre part of the pathway (9.9 days). The F-test can be used to determine whether these standard deviations are significantly different. The F statistic of 1.46 was not significant at the P < 0.05 level, but was so at P < 0.10, supporting the impression that the variability in time spent in the secondary centres is greater. In summary, statistical analysis highlights three issues. More time is spent in the secondary centres. Secondary centres have greater influence over the total pathway length. There is greater variability in the time spent in the secondary centres. Chart showing the pathway lengths of secondary and tertiary centres respectively (data from Royal Brompton Hospital and Harefield Hospital combined). Secondary centres in red and tertiary centres in blue

Average time spent in various parts of the pathway
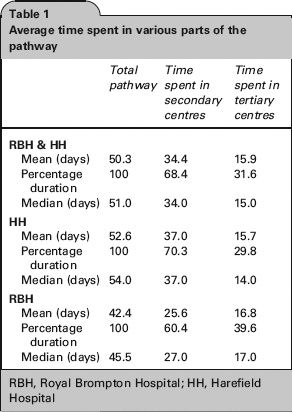
RBH, Royal Brompton Hospital; HH, Harefield Hospital
Various measures of spread

RBH, Royal Brompton Hospital; HH, Harefield Hospital
Pathway mapping
The pathway maps illustrate the routes that lung cancer patients follow at RBH (Figure 2) and HH (Appendix D). They demonstrate the heterogeneity in the journeys of lung cancer patients. Variability extends across several dimensions including the site of origin, the combinations of investigations required and where they are performed.
Map illustrating patient pathway for Royal Brompton Hospital
Qualitative data
Information flows
Between tertiary and secondary centres. ‘If patient is referred on day 60, we have two days to treat the patient… We are completely dependent on the amount of time left in the pathway.’ (RBH Administrator 2).
‘More and more patients are coming less investigated from the DGHs [secondary centre] because of the time limit.’ (HH Consultant radiologist 2).
‘Where we could improve is not so much in what we do here, but in how we communicate with the referring hospitals about what we need to have done to patients before they come here.’ (HH Consultant thoracic surgeon).
Within tertiary centres. ‘Everybody runs their practices in different ways, have different ways of communicating. Some would like a telephone call, to talk…about the patient, others would rather a referral letter. It's about trying to identify the best process, and making sure it's consistent.’ (RBH Nurse 1).
People in hospital have to ‘…run around because of missing bronchoscopy, CT-guided biopsy…’ (HH Consultant pathologist).
Pathway performance
Staff at both RBH and HH believed their respective pathway worked efficiently: ‘I think they run very well as they are. It is pretty streamlined.’ (HH Medical registrar).
When asked if targets were an incentive to work more efficiently, a radiologist remarked: ‘Not really…targets are there to give you some sort of benchmark, and as far as I'm aware, we are well within those.’ (RBH Consultant radiologist).
Six HH interviewees agreed that targets helped patients: ‘If used properly it can be used as a good tool to help get your investigations earlier and we're all trying to make sure they get treated’. (HH Administrator 1).
An implication of targets is queue adjustment: ‘I do think that in some cases, those patients that are not target patients are treated slower than those who are target patients.’ (RBH Administrator 2).
The interviews suggested that the delivery of diagnostic services is better at RBH than HH. HH seems stretched in terms of capacity, while RBH is seeking to engage with Trusts interested in purchasing cancer services.
‘Sometimes we get very complicated cases… being a tertiary referral centre, the patients have been managed elsewhere with no firm diagnosis, referred to us takes a bit longer for us to ‘sort them out’. (RBH Consultant physician 1).
Multidisciplinary approach
Both hospitals acknowledged the importance of the multidisciplinary team (MDT): ‘I'm a great believer in the MDT as it's a great time and energy saver. Otherwise you spend as much time organizing the care of one patient as you can do a dozen.’ (RBH Consultant thoracic surgeon 2).
‘I think sometimes you don't get max attendance at the MDT meetings, so you don't get as wide a field of view as you could get otherwise…’ (HH Thoracic surgery SHO).
The two main issues at HH are the lack of communication and leadership: ‘It could be due to lack of time to communicate back that there's been a change of plans’ (HH Administrator 1).
‘The MDT does not have a clinical lead, there isn't one person taking overall responsibility for what is the decisions being made…you need somebody with authority with other colleagues, that is actually going to make the treatment plan [and] stick to that treatment plan’. (HH Administrator 1).
Neither RBH nor HH have a formalized protocol for organizing diagnostic investigations, although there seems to be greater consistency at RBH. The consequence for HH has been the incomplete availability of results at clinic, possibly delaying clinical decisions.
Discussion
The interviews and pathway maps supplement the quantitative data to support our first hypothesis. One explanation is that the secondary centre is responsible for the earlier phase of the pathway, where more investigations are carried out. Interviewees said that these investigations are time consuming. Other secondary centres in England have a similar problem.2,9
‘Secondary centres have greater influence on pathway length’
It would be appropriate for patients to spend more time upstream if the additional time contributes to their care. But only a tiny proportion of total pathway time (1.37%) is value-added [Appendix C]. Complex patients may require more time. If patient complexity was the only limiting factor, one would expect the increase in pathway time to be proportional for secondary and tertiary centres. However, as the total pathway length increases (Figure 1), the proportion of time a patient spends within the secondary centre increases faster. When the quantitative data were disaggregated (to consider HH and RBH separately), the effect of time spent in secondary centres was more relevant to HH than RBH. Diagnostic pathways in referring centres may have varying potential for improvement.
‘There is greater variability upstream’
The interview data highlighted variations in when patients are referred, explaining the quantitative data. Previous studies demonstrated variability in pathway times at tertiary centres and secondary centres,14,16 but they did not make comparisons between tertiary and secondary centres. Differences in the work-up of patients were shown in the pathway maps, as mentioned in previous studies.17,18 This is partly because secondary centres manage a large number of patients with a wide array of conditions, while tertiary centres deal with a streamlined caseload. Variability in work-up creates difficulty for tertiary centres. If the patient arrives late and with an incomplete dataset, the tertiary centre will find it more difficult to meet the 62-day target.
Responsibility lies upstream
From the quantitative data, it appears that our three hypotheses hold more strongly for HH than RBH. We offer two explanations. Secondary centres referring to RBH are performing better than those referring to HH. Alternatively, all secondary centres are performing as well as each other, and HH's internal pathway is better than that of RBH. The results point to the first explanation. Patients are referred earlier along the 62-day pathway to RBH than HH while spending a similar length of time at both, and interview results indicate that referral mechanisms to both could be improved.
But are tertiary centres helpless?
If tertiary centres always worked efficiently, any variability in the total pathway length would be due to variability in the number of days spent in the secondary centre. Yet there is significant variability in the number of days spent in the tertiary centre. The literature acknowledge that some of the delays are reasonable due to difficult diagnoses,6,9,18 also evident from our interview data.
The time spent in the tertiary centre is actually longer than that in the secondary centre in some instances. We propose an explanation, whereby a secondary centre, realizing that a patient is too complex for them to treat, refers the patient to the tertiary centre earlier.
Urgently referred patients are often prioritized over conventionally referred patients. Prior studies suggest that the shift in resources required to prioritize urgent referrals may increase the waiting times for non-urgent referrals,19,20 a view supported by our work. So although extreme delays are minimized, the average pathway time (for all patients) may be increased. Furthermore, the literature reports no evidence that targets improve pathway efficiency.
The qualitative data highlight inefficiencies in the tertiary centre pathway such as missing documentation and scans, as in other centres. 7 Referrals could be improved too.
The MDT process is vital for coordination to achieve internal pathway efficiency. The interviews raised a number of issues to add to published research. 21 Some were previously identified by the National Action Cancer Team in 2006. 22 For example, the need for systematic recording of decisions and the importance of the lead clinician.
Conclusion
This study identifies some of the difficulties faced by tertiary centres in achieving the 62-day target, an attempt to speed the diagnosis and treatment of cancer patients, which appears generous enough to allow for the management of even the most complex patients and which appears to have succeeded in achieving its objective. Both secondary and tertiary centre processes affect pathway length. As hospitals are encouraged to network and specialize, a joint approach to streamlining patient pathways and accepting censure if targets are breached, whether by default in secondary or tertiary care may be needed. Alternatively, smarter targets that focus on the performance of individual units may be fairer and more effective. This would require the precise roles, diagnostic and treatment functions of individual units to be made explicit.
Footnotes
Acknowledgements
We thank Olga Jones and the other staff and patients at Royal Brompton & Harefield NHS Trust who participated in the study. We thank Juan Baeza, Paul Caffrey and Vicky Nicholson for their technical and administrative assistance
Appendix A
Part 1 – Lung cancer patients journey at Harefield Hospital
Part 2 – Lung cancer patients journey at Royal Brompton Hospital
Part 3 – Surgical route of the patient pathway for both hospitals
Part 4 – Medical/oncology route of the patient pathway for both hospitals
Part 5 – Palliative care route of the patient pathway for both hospitals
Appendix B
Are you aware of your institutions performance with regard to cancer targets?
What are your thoughts on the current lung cancer care pathway within the hospital? Can you identify any parts of the pathway that can be improved? How does your part of the treatment pathway fit with the parts immediately before or after? Can you suggest ways of improving the pathway? (Appendix A)
How do you think the section of the pathway that you are involved with is working? If necessary, prompt: can you suggest any improvements? What challenges are you facing in your part of the pathway? If necessary, prompt: are there any obstructions or limiting factors? Is there a single rate-limiting step? What can be done about these?
What is your part of the pathway's fastest turnaround time? What turnaround time can you guarantee for your part of the pathway?
Appendix C
GP consultation: 10 min GP dictates letter: 10 min Secretary types letter: 15 min Secretary faxes letter: 5 min Secretary at DGH receives the letter: 5 min Secretary transfers the letter to consultant: 5 min Consultant physician arranges investigations and appropriate clinic for the patient: 5 min Secretary organizes clinic list and sends a letter to the patient: 10 min Secretary phones the patient: 5 min Patient in respiratory clinic at DGH (including CT scan): 60 min Chest radiograph: 10 min PET Scan: 60 min Blood tests: 10 min Reports from investigations written and disseminated: 30 min Bronchoscopy: 60 min 2nd outpatient appointment at DGH: 30 min Referral to tertiary hospital respiratory physician – letter dictated and typed: 20 min; faxed: 5 min Respiratory consultation at tertiary hospital: 30 min Patient discussed at MDT: 10 min Patient referred to surgeon – letter dictated and typed: 20 min Correspondence from MDT and surgeon to DGH physician: 20 min Patient booked for further investigations (CT and chest radiograph): 90 min Patient admitted to hospital a day before the operation for ECG: 15 min; and blood tests: 10 min Preparation for surgery: 60 min
Surgery
Total value added time: 610 min
Total non-value added time: 62 (days) × 12 (hours) × 60 (minutes) = 44,640 min
(610/44640) × 100 =
Appendix D