
Abstract
The purpose of this study was to test the morphology and haemodynamics of the renal artery in the rabbit as evaluated by conventional and contrast-enhanced ultrasonography (CEUS). The morphology and haemodynamics of the rabbit renal artery, including the diameter, which were measured using B-mode ultrasonography (US), colour Doppler US and CEUS, and systolic velocity, diastolic velocity and resistive index (RI) were measured using pulsed wave Doppler US. CEUS was used to measure the renal artery diameter: 0.21 ± 0.04 cm (right) and 0.21 ± 0.03 cm (left). Values of the main renal artery diameter obtained from CEUS significantly correlated with those of digital subtraction angiography. The blood flow velocity of the right main renal artery was 44.20 ± 8.71/18.92 ± 6.26 cm/s (systolic/diastolic) and 36.30 ± 6.89/17.64 ± 5.58 cm/s (systolic/diastolic), at its origin from the aorta and at the renal hilus, respectively. The blood flow velocity of the left main renal artery was 45.10 ± 8.49/19.00 ± 6.80 cm/s (systolic/diastolic) and 41.70 ± 10.25/19.55 ± 7.90 cm/s (systolic/diastolic), at its origin from the aorta and at the renal hilus, respectively. Conventional US provides a more feasible modality for measuring the morphology and haemodynamics of the rabbit renal artery. CEUS is a more accurate method for measuring diameter. This information on the morphology and haemodynamics of the rabbit renal artery might be helpful for researchers.
Researchers often use rabbits for scientific experiments, and information on the size of the kidney and the morphology and haemodynamics of the renal artery might be helpful for them. 1–3 However, there are few reports on the normal rabbit renal artery obtained using ultrasound. Ultrasonographic techniques, including B-mode, colour and pulsed wave (PW) Doppler, have been used as the first-line modalities for evaluating blood vessel architecture and vascularity. The vessel's cavity can be displayed easily by colour Doppler ultrasonography (US). PW Doppler US can be used to measure haemodynamics accurately when the ultrasound beam is in line with the direction of blood flow, so it has been used to measure the haemodynamics of the rabbit renal artery. When using colour Doppler to detect the vessel's cavity, aliasing occurs when blood flow velocity results in a frequency shift that is more than half the pulse repetition rate for the recorded Doppler frequency. This phenomenon is well recognized in duplex Doppler imaging as a ‘folding over’ of the frequency spectrum. 3 In colour Doppler flow imaging, aliasing results in a reverse colour assignment, which may interfere with the measurement of the blood flow velocity. However, contrast-enhanced ultrasonography (CEUS) has been widely studied in clinical trials and animal experiments. It enhances the visibility of peripheral arteries and vessels in normal organs and tumours. 4,5
Ultrasonography contrast agents are gas-filled, echogenic microbubbles that remain exclusively in the vascular compartment. CEUS using a second-generation contrast agent with a low mechanical index (MI) can display the simple backscattering sound wave of microbubbles with minimal bubble destruction and permits prolonged evaluation of the haemodynamic distribution of contrast agents in realtime. 6,7 CEUS is more accurate than colour Doppler when used to measure the diameter of the vessel. 8
The purpose of this study was to measure the morphology and haemodynamics of the rabbit renal artery using conventional US and CEUS. The renal artery stenosis can affect the haemodynamics of the renal artery. The data of the renal artery could be applied in the associated research (e.g. renal artery stenosis).
Methods
Animals and housing conditions
All aspects of the study were approved by Harbin Medical University Institutional Animal Care and Use Committee and were performed in accordance with institutional policy and the National Institutes of Health guidelines governing the humane treatment of vertebrate animals. Animals were maintained in accordance with the Guide for the Care and Use of Laboratory Animals in a facility accredited by the Association for the Assessment and Accreditation of Laboratory Animal Care International. Ten healthy adult New Zealand White rabbits were used in this study (5 males and 5 females; 8–11 months old; weighing 3.0–4.1 kg. SCXK: NZW; The Laboratory Animal Centre of Harbin Pharmaceutical Group Co Ltd, General Pharm Factory, Harbin, China).
The animals were maintained individually in stainless-steel cages (630 mm in length × 530 mm in width × 450 mm in height) with slatted floors and no bedding in an animal room under controlled conditions (temperature: 22.5 ± 3.5°C; relative humidity: 50 ± 20%; air ventilation: 10–15 times per hour; artificial lighting: 12 h per day), and were allowed free access to diet (RC4; Suhang Technology Co, Ltd, Shuzhou, China) and to water via an automatic water supply system (Suhang Water Union, Suzhou, China).
The rabbits were fasted on the night before the experiment. Scissors were used to depilate both flanks of the rabbits and 3% amobarbital sodium (30 mg/kg; Sigma Chemical Co, Deisenhofen, Germany) was administered intramuscularly for anaesthesia. Animals breathed spontaneously during anaesthesia. Monitoring of mean arterial pressure (MAP), heart rate (HR), end-tidal CO2 (PCO2) and peripheral arterial oxygen saturation (SpO2) were conducted using a patient monitor (Infinity Vista XL, Dreager Medical Systems, Inc, Telford, PA, USA) during anaesthesia. The rabbits were under general anaesthesia during the experiments and were recovered 40 min later.
Ultrasound technique and analysis
The Esaote Mylab90 system and L523 transducer (Esaote, Genova, Italy) were used for ultrasound imaging. The ultrasound frequency was 4–13 MHz. Coupling gel was applied to each rabbit's flank. Before administration of the contrast agent, B-mode greyscale US was performed to scan the kidneys and renal artery thoroughly. The main renal artery diameters were measured from one intima to the other intima perpendicularly in B-mode. Then, colour Doppler and PW Doppler US (with 5.6 MHz Doppler at a pulse-Doppler radar [PRF] of 3.0 kHz) were performed to visualize the renal artery and haemodynamics of the renal artery, including its origin from the aorta and at the renal hilus, the segmental artery, the arteriae interlobar renis and the arteriae interlobular renis. The haemodynamics of the renal artery could be obtained when one point was set at the systolic peak and the other point was set at the end-diastolic. Representative example of haemodynamic measurements in the intrarenal artery are shown in Figure 1, as described in a previous study. 2
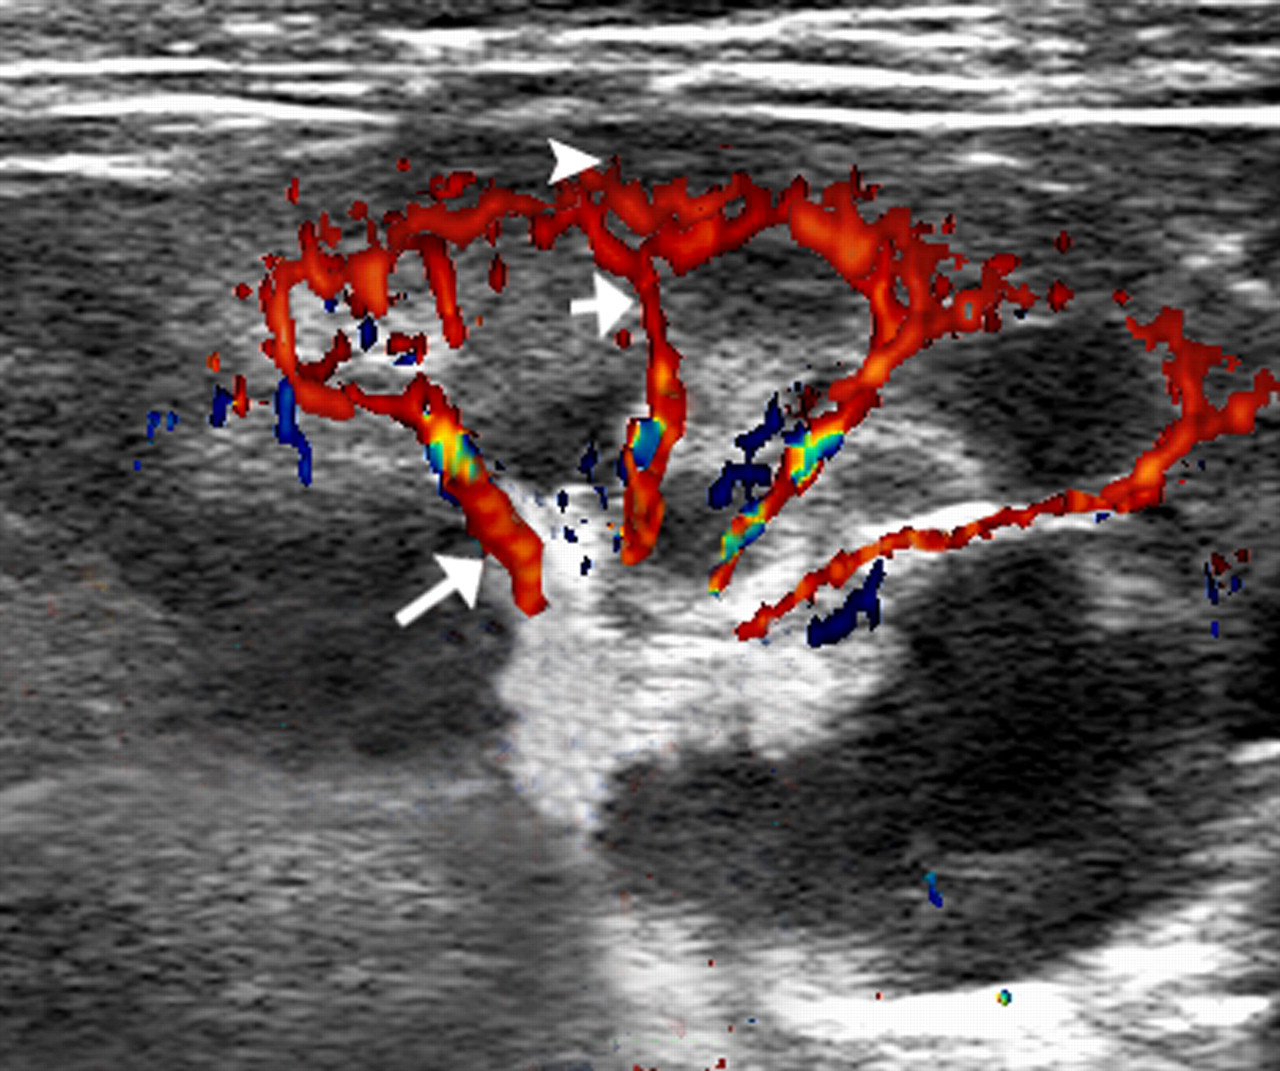
Representative example of haemodynamics in the intrarenal artery. The long arrow shows the segmental artery. The short arrow shows the arteriae interlobar renis and the arrow head shows the arteriae interlobular renis
The imaging settings such as gain, depth and focus were optimized to clearly visualize the renal artery and kidneys. These settings were unchanged throughout the experiment. The MI was 0.06 for CEUS. The second step of the sonography was performed in greyscale with non-linear imaging modes using realtime imaging techniques following an intravenous bolus injection of SonoVue (Bracco, Italy), a second-generation contrast agent. A white, milky suspension of sulphur hexafluoride (SF6) microbubbles was obtained by adding 5 mL of physiological saline (0.9% sodium chloride) to the stock powder (25 mg), using aseptic techniques, followed by hand agitation. Each rabbit received two intravenous bolus injections of SonoVue (0.05 mL/kg each) via a 24-gauge intravenous catheter placed in the marginal ear vein followed by a 2 mL sterile saline flush. One injection to visualize one renal artery and the time interval was 30 min. The direction of the transducer was in line with the main renal artery. Digital subtraction angiography (DSA) was performed for angiography. The diameters of the renal artery at its origin from the aorta (range from 0.5 to 1.0 cm) were measured by B-mode sonography, colour Doppler and CEUS, all of them were compared with that measured by DSA.
Statistical analysis
Data from ultrasonography analysis for each rabbit were registered separately and processed in a blinded manner for statistical evaluation. Quantitative data are expressed as the mean ± SD. All data are normally distributed. Statistical significance was evaluated using analysis of variance followed by independent samples Student's t-tests. Correlation analyses were performed using Pearson's test and P < 0.05 was considered statistically significant. Statistical analyses were performed with SPSS version 13.0 software for Windows (SPSS Inc, Chicago, IL, USA).
Results
Morphology of the rabbit artery
We examined all of the rabbits successfully. The mean dimensions of the left and right kidneys were 4.17 ± 0.48 × 1.98 ± 0.21 cm and 4.28 ± 0.32 × 1.95 ± 0.30 cm, respectively. The diameters of the rabbit renal artery measured using different US modalities are shown in Table 1.
The diameters of the rabbit renal artery measured using different ultrasonography modalities
BM represents B-mode US, CDUS represents color Doppler US, CEUS represents contrast-enhanced ultrasonography and DSA represents digital subtraction angiography, RKA: right kidney artery; LKA: left kidney artery
The renal artery was clearly visualized on B-mode, colour Doppler and CEUS (Figure 2). Values of the main renal artery diameter obtained from CEUS significantly correlated with those of DSA (r = 0.71, P = 0.02 (right); r = 0.66, P = 0.04 (left); Figure 3).
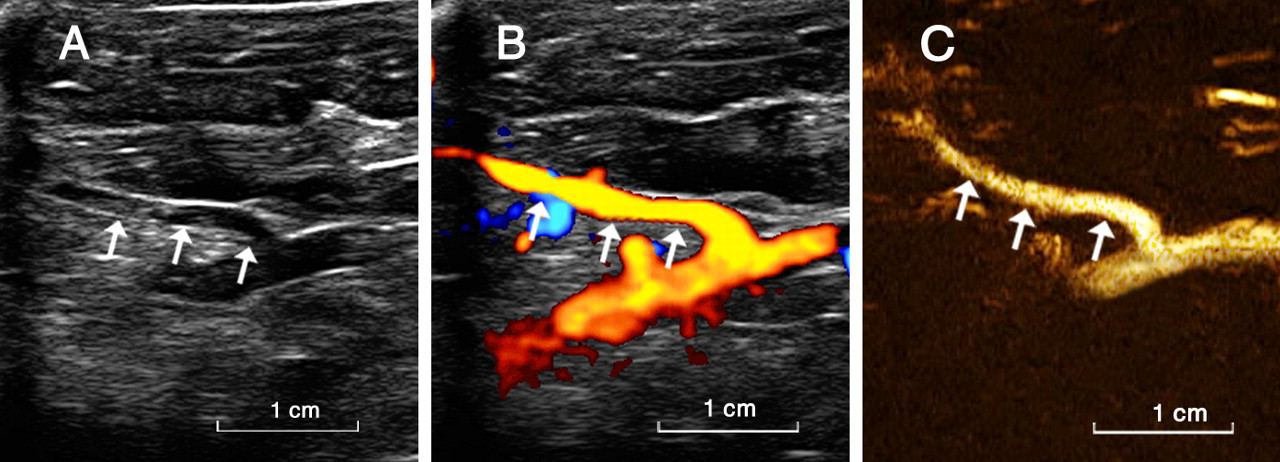
Visualization of the rabbit renal artery in different modalities. B-mode, colour Doppler and contrast-enhanced ultrasonography (CEUS) can all be used to display the rabbit renal artery. A shows the right rabbit renal artery in B-mode. B shows the right rabbit renal artery in colour Doppler. C shows the right rabbit renal artery in CEUS
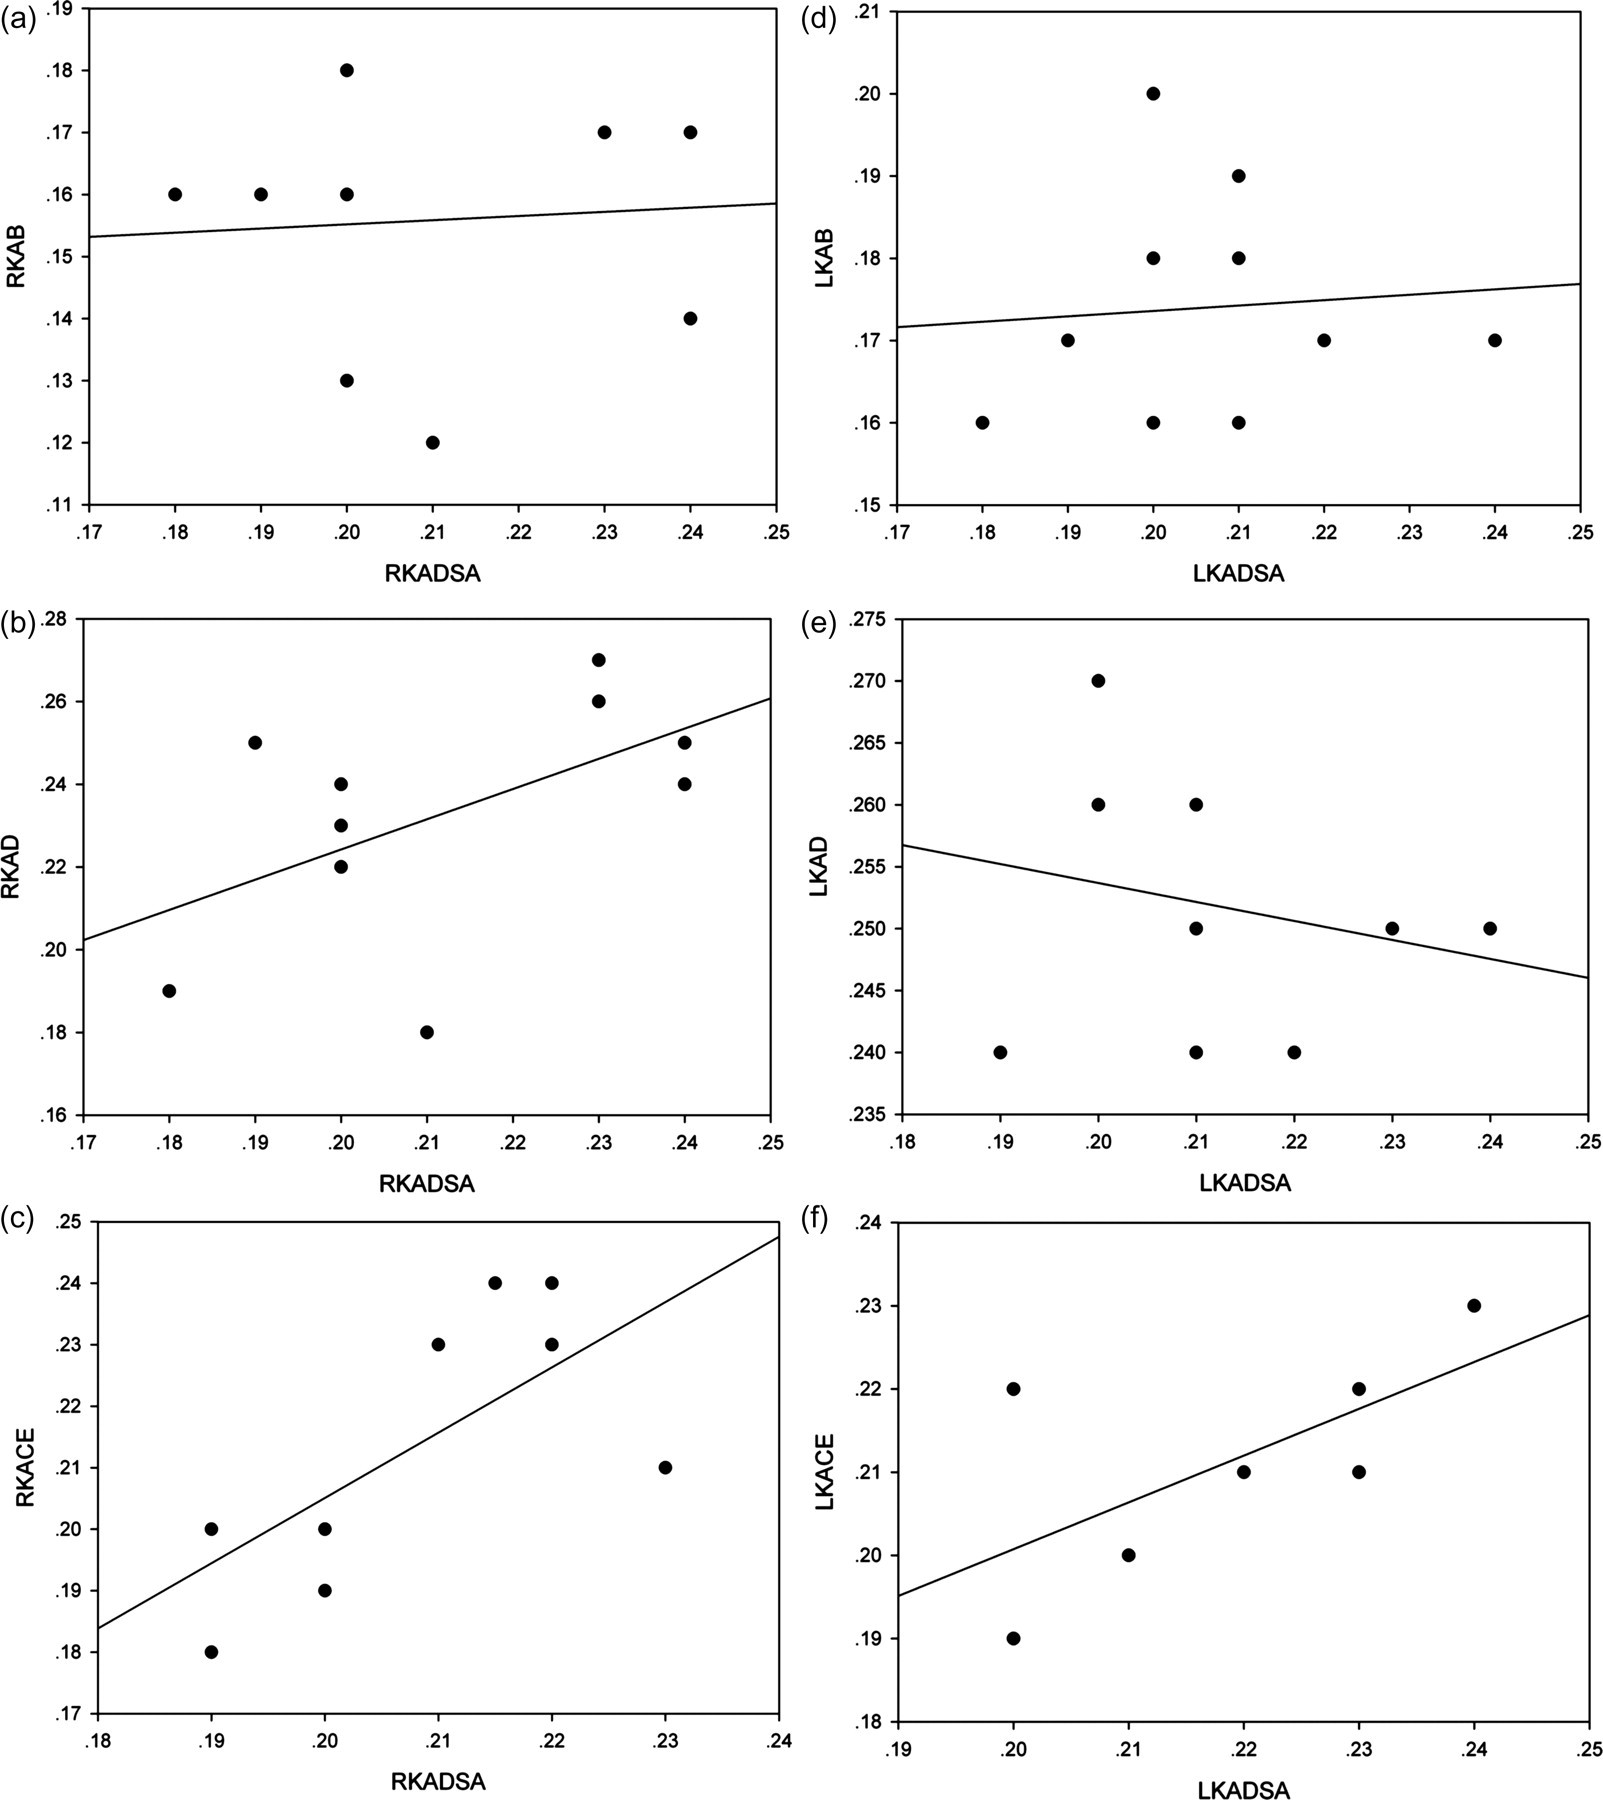
Correlations of the diameters of the renal artery using B-mode, colour Doppler, contrast-enhanced ultrasonography (CEUS) and digital subtraction angiography (DSA). Values of the main renal artery diameter obtained from CEUS significantly correlated with those of DSA. (a)-(c) show the correlations of the diameter of the right rabbit renal artery and (d)-(f) show the correlations of the diameter of the left rabbit renal artery. RKAB, RKAD, RKACE and RKADSA represent the measurements of the right rabbit renal artery in B-mode, colour Doppler, CEUS and DSA. LKAB, LKAD, LKACE and LKADSA represent the measurements of the left rabbit renal artery in B-mode, colour Doppler, CEUS and DSA
Haemodynamics of the rabbit renal artery
The blood flow velocity of the right main renal artery was 44.20 ± 8.71/18.92 ± 6.26 cm/s (systolic/diastolic) and 36.30 ± 6.89/17.64 ± 5.58 cm/s (systolic/diastolic) at its origin from the aorta and at the renal hilus, respectively. The blood flow velocity of the left main renal artery was 45.10 ± 8.49/19.00 ± 6.80 cm/s (systolic/diastolic) and 41.70 ± 10.25/19.55 ± 7.90 cm/s (systolic/diastolic) at its origin from the aorta and at the renal hilus, respectively. The blood flow velocity of the intrarenal artery decreased progressively along with the branching of the renal artery in the parenchyma of the kidneys (Figure 4).
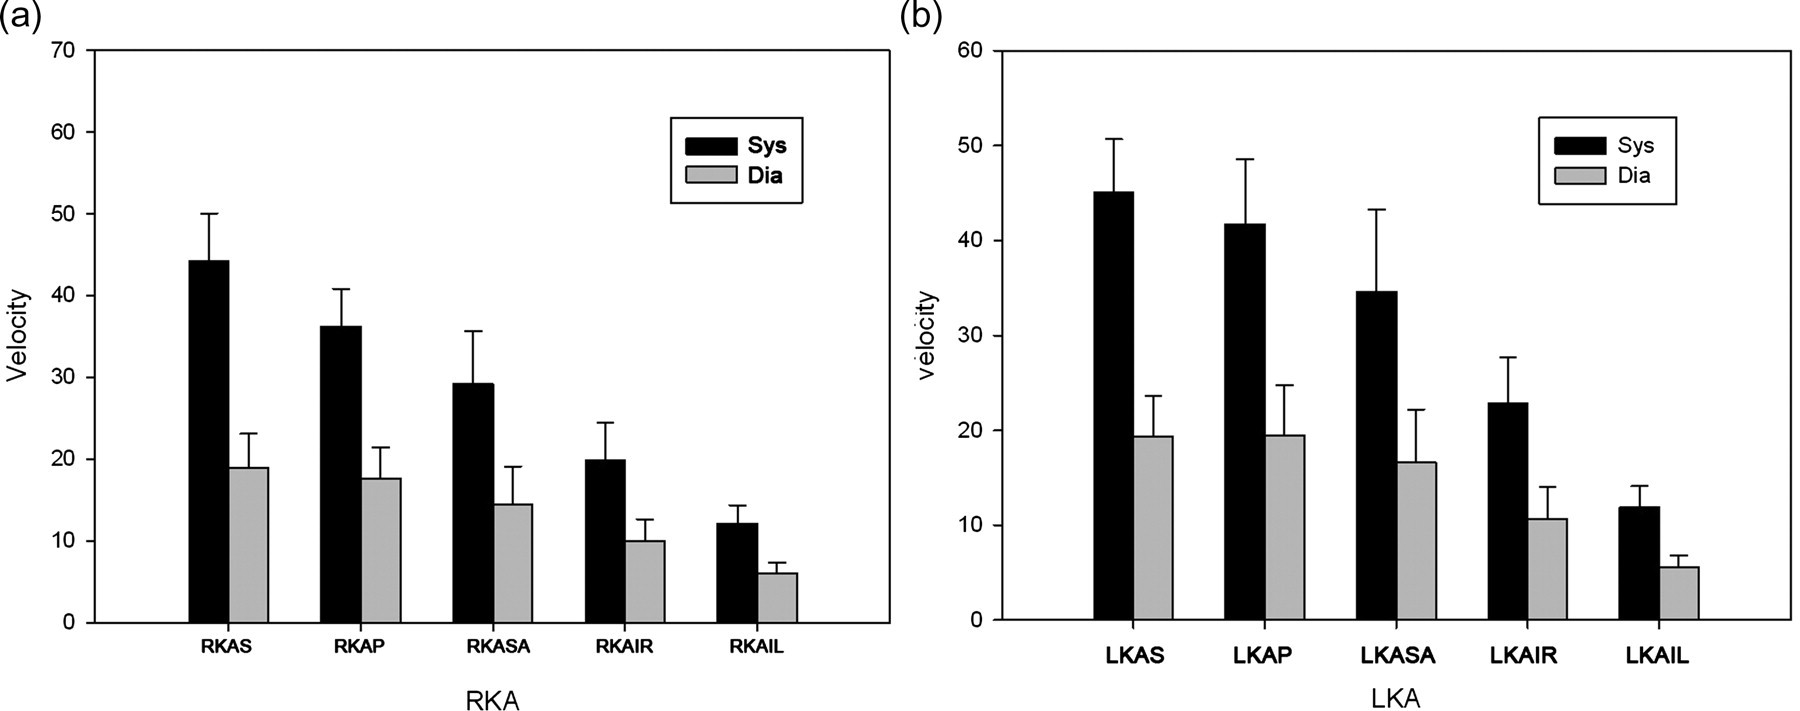
Rabbit renal artery blood flow velocity in different parts. (a) shows the right renal artery and (b) shows the left renal artery. RKAS represents the right main renal artery at its origin from the aorta, RKAP represents the right main renal artery at the renal hilus, RKASA represents the right segmental artery, RKAIR represents the right arteriae interlobar renis and RKAIL represents the right arteriae interlobular renis. LKAS represents the left main renal artery at its origin from the aorta, LKAP represents the left main renal artery at the renal hilus, LKASA represents the left segmental artery, LKAIR represents the left arteriae interlobar renis and LKAIL represents the left arteriae interlobular renis
The resistive index (RI) values of the right main renal artery were 0.57 ± 0.08 and 0.52 ± 0.07, at its origin from the aorta and at the renal hilus, respectively. The RI values of the left main rabbit renal artery were 0.57 ± 0.10 and 0.54 ± 0.11 at its origin from the aorta and at the renal hilus, respectively. There was no significant difference in the RI of the various renal artery segments.
Anaesthesia and perioperative monitoring
There were almost no adverse effects following the administration of amobarbital sodium in the rabbits during the induction and maintenance phase. Only four rabbits presented amyostasia occasionally which lasted less than 5 s. The agent was safe for the rabbits when it was administered intramuscularly for anaesthesia. The rabbits presented adynamia after the experiment, which lasted less than 15 min, and no other adverse effect was observed after the experiment. HR was 273.10 ± 16.38 bpm. MAP was 69.13 ± 8.51 mmHg. PCO2 was 5.37 ± 0.52 kPa. SpO2 was 98.89 ± 3.48% during the experiment.
Discussion
Rabbits are often used as experimental animals, so data on the morphology and haemodynamics of the rabbit renal artery could be helpful for those researchers engaged in associated studies. It can be the reference when we determine the abnormality of the rabbit renal vessel, especially when we use the rabbit as the model of the graft rejection and renal artery stenosis. Clinically, both the graft rejection and renal artery stenosis can affect the haemodynamics of the renal artery. 9,10 The most important function of the normal value of the renal artery is its reference role. In our study, we successfully measured the morphology and haemodynamics of the rabbit renal artery using B-mode, colour Doppler, PW and CEUS. We attempted to make the ultrasound beam in line with the direction of the blood flow in both the main renal artery and intrarenal arteries to reflect the haemodynamics accurately. 11,12 The blood flow velocity of the renal artery decreased in the parenchyma of the kidney, as shown in Figure 4. There was no significant difference in the RI of the various renal artery segments. We did not find any references on the haemodynamics of the rabbit renal artery obtained using US. Our research provided the exact data of the morphology and haemodynamics of the rabbit renal artery in US technique for the first time. B-mode US, colour Doppler US and CEUS can all be used for measurements in the renal artery, but CEUS may be the most accurate non-invasive technique for measuring the diameter. We used DSA as the gold standard in such measurements. The dimensions of the arteries measured by CEUS correlated well with those of DSA. Some researchers have used CEUS for the diagnosis of renal artery stenosis because it is very sensitive. 8
Colour Doppler US is widely used for the detection of vessels. PW can be used to measure the velocity correctly when the direction of blood flow is in line with the ultrasound beam. CEUS is preferable when US is used to measure the diameters of vessels as it gave a significant correlation with that of DSA in our study.
There are some limitations in our study. First, the sample was small and we could not provide any confidence ranges of the measures. Second, the haemodynamic parameters were measured in anaesthetized animals, which could affect the haemodynamics of the cardiovascular system.
In conclusion, we measured the morphology of the rabbit renal artery using conventional US and CEUS. PW was used for haemodynamic measurements, including the systolic velocity, diastolic velocity and RI. CEUS is a feasible method for measuring the diameter of the renal artery.
Footnotes
ACKNOWLEDGEMENTS
This work was supported by a program grant (No. 2006051) from the Department of Health of Heilongjiang Province, China.
This work was also supported by a grant from the Key Program (No. GC10C302) from the Heilongjiang Provincial Science and Technology Committee, China.
Yinzhu Chu and Haixia Liu contributed equally to this work.