
Abstract
The kinetics of α 2-macroglobulin (α2M) and α 1-acid glycoprotein (AAG) in rats repeatedly stimulated with intramuscular injections of turpentine oil at doses 0.05 and 0.4 mL/rat were investigated. Mean serum levels of α2M peaked at 48 h after the first turpentine oil injection, reaching 1.74 and 2.36 mg/mL at 0.05 and 0.4 mL/rat, respectively. AAG peaks were also observed at 48 h after injection, and the mean values were 2.02 and 2.53 mg/mL, respectively. These peak values of α2M and AAG differed significantly between the 0.05 and 0.4 mL/rat injection groups. Mean serum levels of interleukin-6 (IL-6) at 0.05 mL/rat were 52.61 pg/mL at 12 h, 48.86 pg/mL at 36 h and 81.93 pg/mL at 84 h after the first injection. Mean IL-6 serum levels at 0.4 mL/rat were 215.24 pg/mL at 12 h, 56.33 pg/mL at 36 h and 39.25 pg/mL at 84 h after the first injection. Mean serum levels of cytokine-induced chemoattractant-1 (CINC-1) at a dose of 0.05 mL/rat were 5.70 ng/mL at 12 h, 5.58 ng/mL at 36 h and 4.58 ng/mL at 84 h after the first injection. Mean serum levels of CINC-1 after injection at 0.4 mL/rat were 11.57 ng/mL at 12 h, 4.68 ng/mL at 36 h and 4.42 ng/mL at 84 h. Serum levels of IL-6 differed significantly at 12, 24, 72 and 84 h, while those of CINC-1 differed significantly at 12, 24, 48 and 96 h between the 0.05 and 0.4 mL/rat injection groups. Differences in peak serum levels in the 0.05 and 0.4 mL/rat groups were attributed to differences in the production of IL-6 and CINC-1, which are thought to contribute to α2M and AAG production.
Keywords
Serum levels of acute-phase proteins increase in response to acute inflammation, infectious diseases, surgical trauma or pregnancy. 1–5 C-reactive protein is recognized as a typical acute-phase protein in humans and dogs, 6–10 and is a useful marker of acute inflammation in clinical situations. 6–14
On the other hand, α 2-macroglobulin (α2M) and α 1-acid glycoprotein (AAG) are used as typical acute-phase proteins in rats. 15,16 Serum levels of α2M increase after inoculation with Staphylococcus aureus, surgical treatment and injection of turpentine oil. 17–19 AAG is also induced in rats injected with turpentine oil or indomethacin, and after inoculation with S. aureus or Pseudomonas aeruginosa. 20 Furthermore, interleukin (IL)-6 and cytokine-induced chemoattractant-1 (CINC-1) increase prior to elevation of α2M and AAG in rats after injection of turpentine oil. 18,20 The production of α2M and AAG is thus thought to be regulated by both cytokines.
The above investigations were based on single inflammatory stimulation; however, the changes in serum levels of α2M and AAG and the extent of acute-phase protein increases in rats stimulated repeatedly have not been clarified. Thus, fundamental data on α2M and AAG in rats are still lacking. In this study, changes in serum α2M and AAG were investigated in rats stimulated with repeated injection of turpentine oil. Furthermore, the changes in IL-6 and CINC-1 were investigated for their role in the production of acute-phase proteins.
Materials and methods
Animals
Fourteen 9-week-old male Sprague-Dawley (Jcl:SD) rats were purchased from CLEA Japan, Inc (Tokyo, Japan) and were used in this study. Rats were kept in isolators at a temperature of 23 ± 2°C and a relative humidity of 55 ± 10% on a 12/12 dark/light cycle (06:00–18:00) with the air exchanged 12 times or more per hour. All rats were fed a maintenance diet (MF: Oriental Yeast Co, Ltd, Tokyo, Japan), and were allowed free access to water.
Treatment
The 14 rats were divided into two groups (n = 7 in each group). Both injection and blood collection were performed under light ether anaesthesia and rats recovered immediately afterward. Turpentine oil was alternately injected intramuscularly in the right and left femoral regions at 0.05 or 0.4 mL/rat at three time points (0, 24 and 72 h). Blood (0.3 mL) was collected from the venae cervicalis superficialis by syringe at 10 time points (pretreatment and at 12, 24, 36, 48, 72, 84, 96, 120 and 144 h after the first injection of turpentine oil), and the total amount of blood collected from individual animals was 3.0 mL. Body weights of rats used in this study ranged from 300 to 340 g. Thus, the total amount of blood collected was equivalent to 0.3% of body weight. The influence of drawing volume on production of acute-phase proteins has not been clarified. However, the production of acute-phase proteins was not considered to be influenced by the total amount of blood collected in this study.
Sera were obtained after centrifugation at 2200
Preparation of monoclonal antibody for rat α2M
Anti-rat α2M monoclonal antibody 16 and rabbit anti-rat α2M antibody 15 were prepared as described previously.
Measurement of α2M, AAG, IL-6 and CINC-1
Sera collected at pretreatment and at 24, 48, 72, 120 and 144 h after the first injection were subjected to measurement for α2M and AAG, and those collected at pretreatment and at 12, 24, 36, 48, 72, 84, 96, and 120 h after the first injection were subjected to measurement for IL-6 and CINC-1.
Serum levels of α2M were measured by enzyme-linked immunosorbent assay (ELISA). Rabbit anti-rat α2M antibody in 0.05 mmol/L sodium bicarbonate buffer (pH 9.6) was incubated at 100 μL/well at room temperature for one hour. After blocking with 1% bovine serum albumin in sodium bicarbonate buffer (pH 9.6) at 200 μL/well, plates were incubated at room temperature for one hour and rinsed with phosphate-buffered saline (pH 7.2) containing 0.1% polyoxyethylene (20) sorbitan monolaurate (Wako Chemical Industries, Ltd, Osaka, Japan). Standard sera with a known α2M concentration or sample sera were then added at 100 μL/well. Plates were incubated at room temperature for one hour and were rinsed as described previously. Mouse anti-rat α2M monoclonal antibodies were added at 100 μL/well. After incubation for one hour and rinsing as described previously, peroxidase-conjugated goat anti-mouse IgG antibodies (MP Biomedicals, Inc, Aurora, OH, USA) were added at 100 μL/well and plates were rinsed as described previously. Substrate was 1% 2,2-azino-di-(3-ethyl-benzthiazoline sulphonic acid-6), and after incubation for one hour (Zymed Laboratories, South San Francisco, CA, USA), absorbance at 415 nm was measured using a microplate reader (Corona Electric Co, Ltd, Ibaraki, Japan). The standard curve was obtained using solutions ranging from 0.2 to 28.2 μg/mL.
Serum levels of AAG were measured by single radial immunodiffusion (SRID) using a commercial kit (α 1-AG (AGP) SRID; Institute for Metabolic Ecosystem Co, Ltd, Miyagi, Japan). The standard curve was obtained using solutions ranging from 0.06 to 1 mg/mL.
Serum levels of IL-6 and CINC-1 were measured by ELISA using commercial kits. Commercial ELISA kits were purchased from BioSource International, Inc (Rat Interleukin-6 (rail-6) ELISA; Camarillo, CA, USA) for IL-6 and from Panapharm Laboratories Co, Ltd (Rat CINC-1; Kumamoto, Japan) for CINC-1. Standard curves were obtained using solutions ranging from 0.03 to 2 ng/mL for IL-6 and from 0.01 to 0.8 ng/mL for CINC-1.
All experiments were approved by the Institutional Review Board of Azabu University and were conducted in accordance with the institute's animal experimentation guidelines (Japanese Association for Laboratory Animal Science, JALAS, 1987).
Statistics
All values are expressed as means ± SEM. Analysis of significance between variables was performed using Student's t-test. P values of <0.05 were considered to be statistically significant.
Results
Changes in serum levels after injection of turpentine oil are shown in Figures 1 and 2 for α2M and AAG, respectively (Tables 1 and 2). Mean pretreatment serum levels of α2M were 0.03 mg/mL in the 0.05 mL/rat injection group and 0.04 mg/mL in the 0.4 mL/rat injection group. Mean pretreatment serum levels of AAG were 0.08 mg/mL in the 0.05 mL/rat injection group and 0.10 mg/mL in the 0.4 mL/rat injection group. Peak serum levels for both α2M and AAG were observed at 48 h after the first injection of turpentine oil, with α2M reaching 1.74 mg/mL in the 0.05 mL/rat injection group and 2.36 mg/mL in the 0.4 mL/rat injection group. These values were 57.6- and 59.0-fold higher, respectively, than pre-injection levels. Mean peak serum levels of AAG were 2.02 mg/mL in the 0.05 mL/rat injection group and 2.53 mg/mL in the 0.4 mL/rat injection group, which were 25.3- and 25.3-fold higher, respectively, than pre-injection levels. Significant differences in serum levels of α2M were observed at 24, 48 and 120 h after injection of turpentine oil between the 0.05 and 0.4 mL/rat injection groups, and significant differences in serum levels of AAG were observed at 24, 48, 120 and 144 h after injection of turpentine oil between the 0.05 and 0.4 mL/rat injection groups.
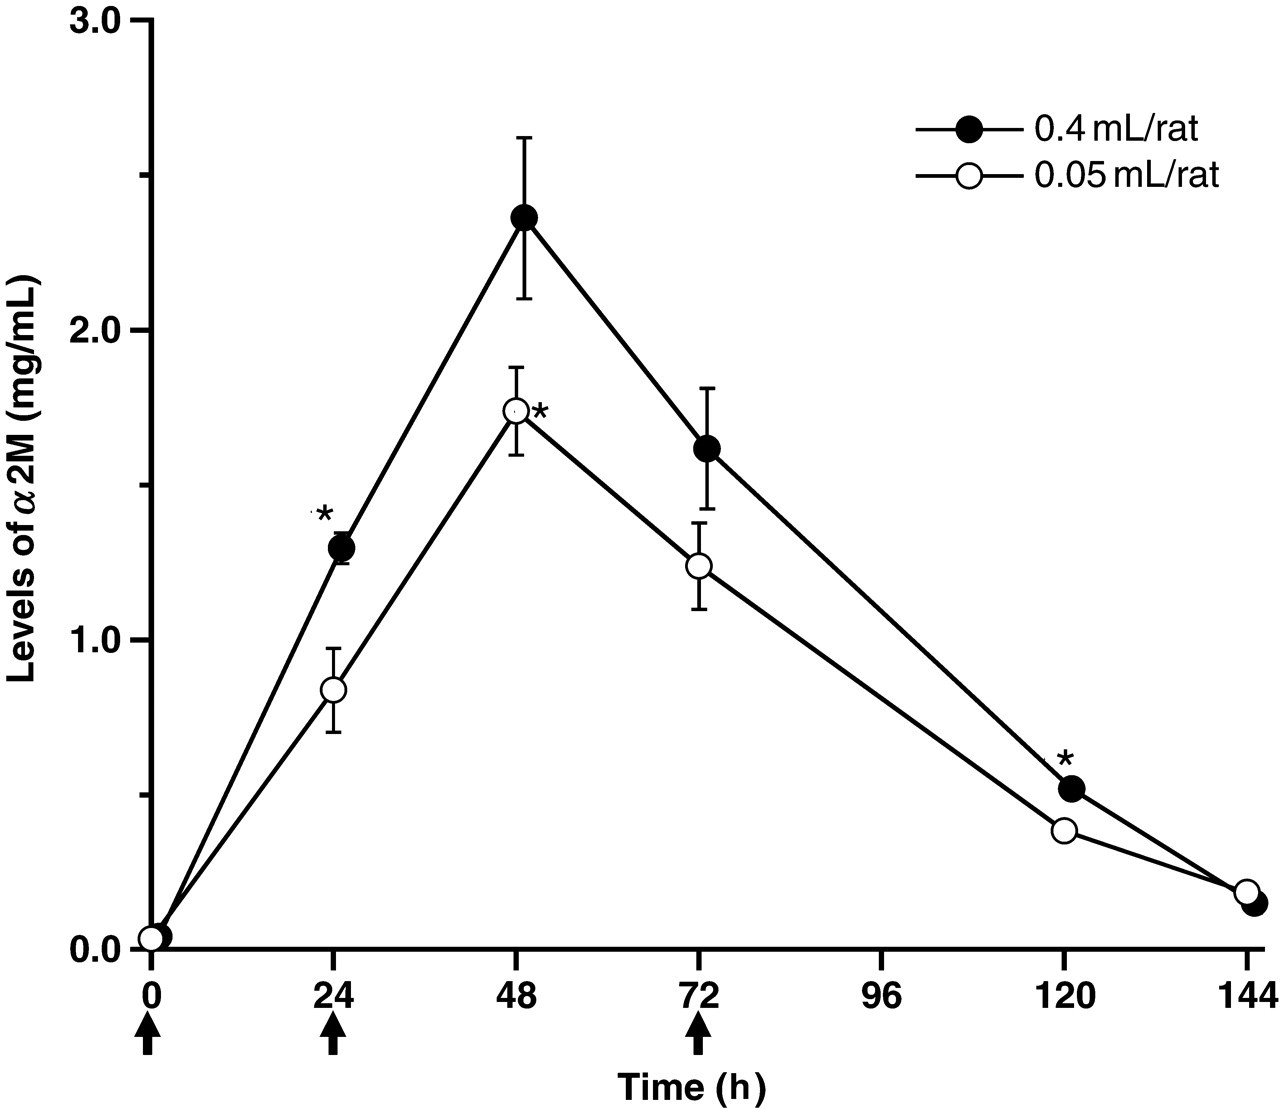
Changes in serum levels of α 2-macroglobulin (α2M) in rats after repeated injection of turpentine oil at doses of 0.05 and 0.4 mL/rat. Arrows indicate the injection of turpentine oil at 0, 24 and 72 h. Data are expressed as means ± SEM (n = 7). Differences were compared between 0.05 and 0.4 mL/rat by Student's t-test. *P < 0.05, significantly different from the 0.05 mL/rat injection group
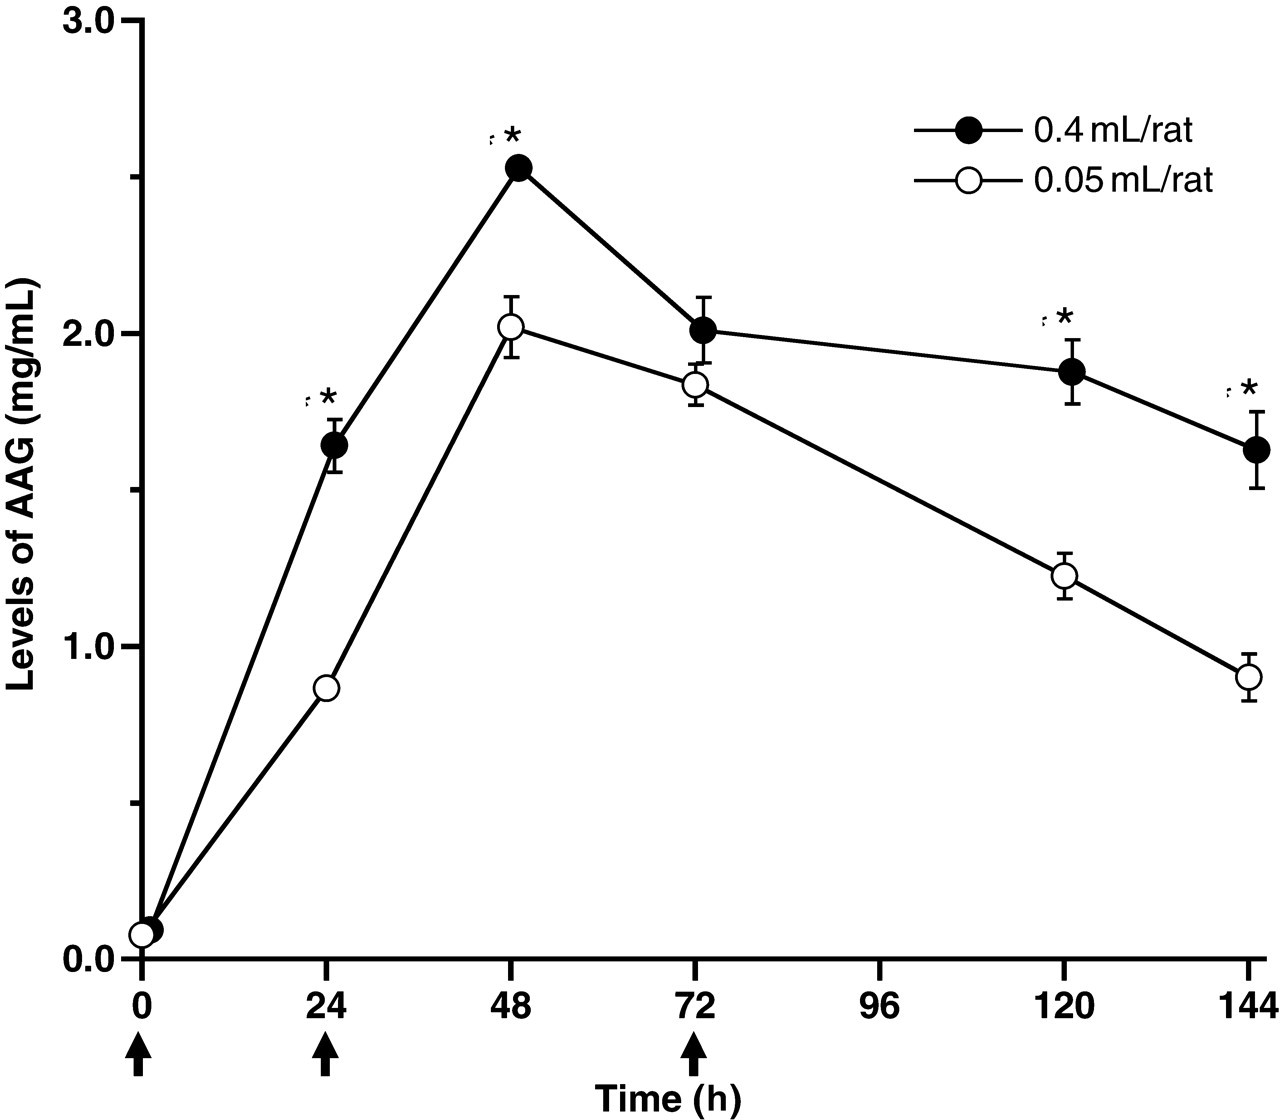
Changes in serum levels of α 1-acid glycoprotein (AAG) in rats after repeated injection of turpentine oil at doses of 0.05 and 0.4 mL/rat. Arrows indicate injection of turpentine oil at 0, 24 and 72 h. Data are expressed as means ± SEM (n = 7). Differences were compared between 0.05 and 0.4 mL/rat by Student's t-test. *P < 0.05, significantly different from the 0.05 mL/rat injection group
Serum levels of α2-macroglobulin (mg/mL) in rats repeatedly stimulated with turpentine oil
Values are expressed as means ± SEM. Differences were compared between 0.05 and 0.4 mL/rat by Student's t-test
*Significantly different from the 0.05 mL/rat injection group (P < 0.05)
Serum levels of α 1-acid glycoprotein (mg/mL) in rats repeatedly stimulated with turpentine oil
Values are expressed as means ± SEM. Differences were compared between 0.05 and 0.4 mL/rat by Student's t-test
*Significantly different from the 0.05 mL/rat injection group (P < 0.05)
Changes in IL-6 and CINC-1 serum levels after injection of turpentine oil are shown in Figures 3 and 4, respectively (Tables 3 and 4). The mean pretreatment serum levels of IL-6 were 16.16 pg/mL in the 0.05 mL/rat injection group and 19.10 pg/mL in the 0.4 mL/rat injection group. Serum levels of IL-6 in the 0.05 mL/rat injection group increased to 52.61, 48.86 and 81.93 pg/mL at 12, 36 and 84 h after the first injection of turpentine oil, respectively, and these were 3.3-, 3.0- and 5.1-fold higher, respectively, than pre-injection levels. IL-6 levels after injection in the 0.4 mL/rat injection group were 215.24, 56.33 and 39.25 pg/mL at 12, 36 and 84 h after the first injection of turpentine oil, respectively, and these were 11.2-, 2.9- and 2.0-fold higher, respectively, than pre-injection levels. Mean pretreatment serum levels of CINC-1 were 0.15 ng/mL in the 0.05 mL/rat injection group and 0.14 ng/mL in the 0.4 mL/rat injection group. Serum levels of CINC-1 in the 0.05 mL/rat injection group increased to 5.70, 5.58 and 4.58 ng/mL at 12, 36 and 84 h after the first injection of turpentine oil, respectively, and these values were 37.9-, 37.2- and 30.5-fold higher, respectively, than pre-injection levels. CINC-1 levels in the 0.4 mL/rat injection group were 11.57 , 4.68 and 4.42 ng/mL at 12, 36 and 84 h after the first injection of turpentine oil, respectively. Significant differences in serum levels of IL-6 were observed at 12, 24, 72 and 84 h after injection of turpentine oil between the 0.05 and 0.4 mL/rat injection groups, and significant differences in serum levels of CINC-1 were observed at 12, 24, 48 and 96 h after injection of turpentine oil between the 0.05 and 0.4 mL/rat injection groups.
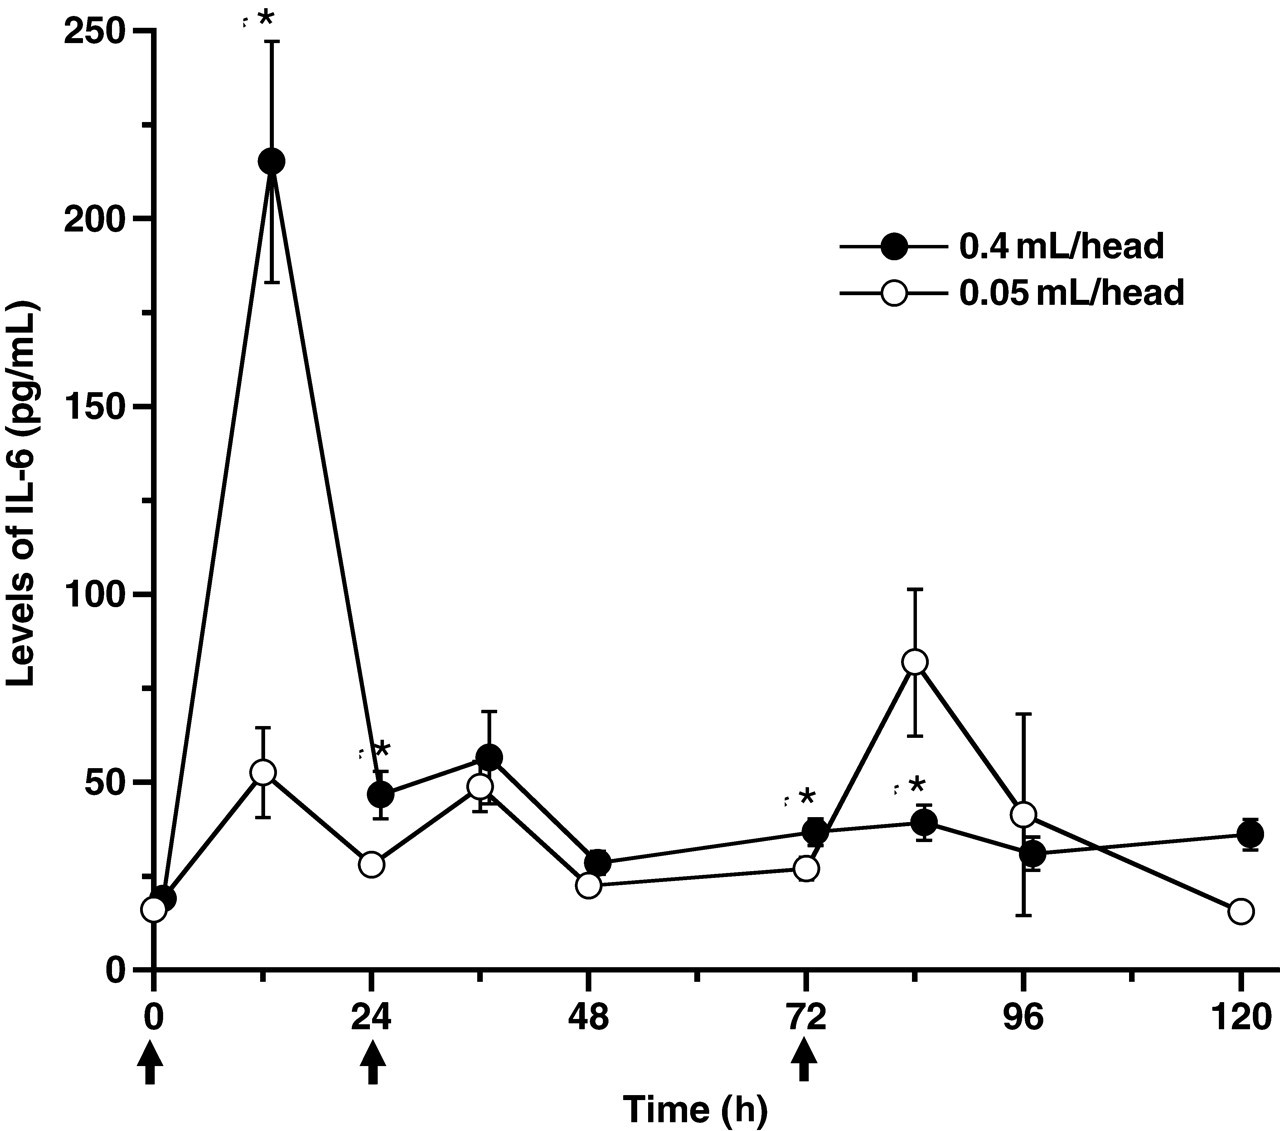
Changes in serum levels of interleukin-6 (IL-6) in rats after injection of repeated turpentine oil at doses of 0.05 and 0.4 mL/rat. Arrows indicate injection of turpentine oil at 0, 24 and 72 h. Data are expressed means ± SEM (n = 7). Differences were compared between 0.05 and 0.4 mL/rat by Student's t-test. *P < 0.05, significantly different from the 0.05 mL/rat injection group
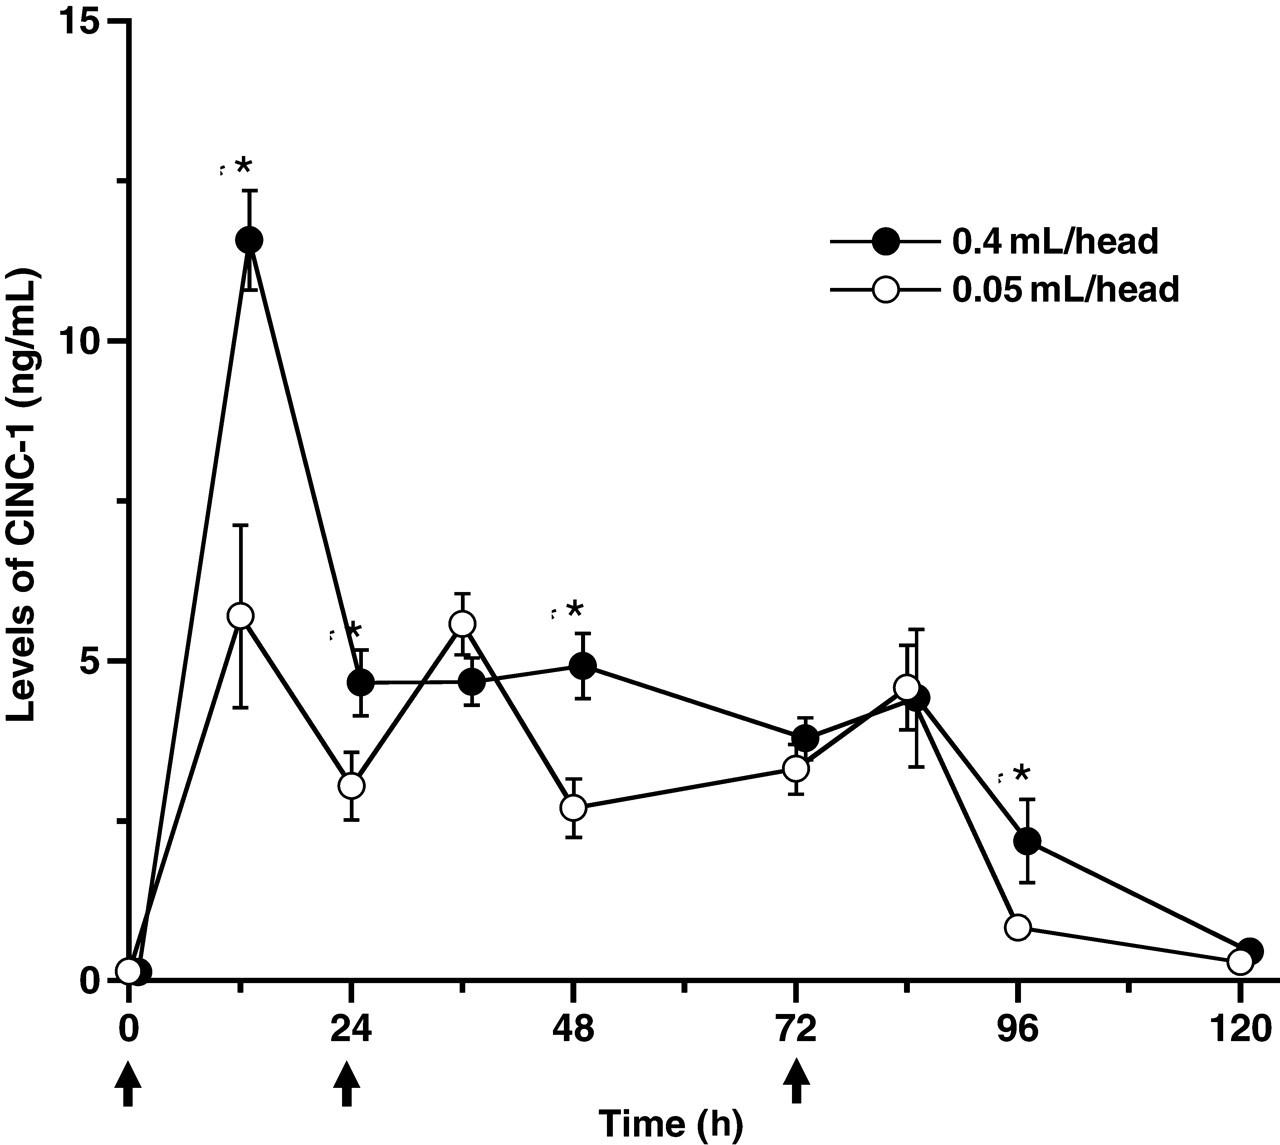
Changes in serum levels of cytokine-induced chemoattractant-1 (CINC-1) in rats after repeated injection of turpentine oil at doses of 0.05 and 0.4 mL/rat. Arrows indicate injection of turpentine oil at 0, 24 and 72 h. Data are expressed as means ± SEM (n = 7). Differences were compared between 0.05 and 0.4 mL/rat by Student's t-test. *P < 0.05, significantly different from the 0.05 mL/rat injection group
Serum levels of interleukin-6 (pg/mL) in rats repeatedly stimulated with turpentine oil
Values are expressed as means ± SEM. Differences were compared between 0.05 and 0.4 mL/rat by Student's t-test
*Significantly different from the 0.05 mL/rat injection group (P < 0.05)
Serum levels of cytokine-induced chemoattractant-1 (ng/mL) in rats repeatedly stimulated with turpentine oil
Values are expressed as means ± SEM. Differences were compared between 0.05 and 0.4 mL/rat by Student's t-test
*Significantly different from the 0.05 mL/rat injection group (P < 0.05)
Discussion
Serum levels of α2M and AAG are known to increase after single injection of turpentine oil, peaking at 48 h after injection. 17,20 In this study, turpentine oil was injected into rats three times at doses 0.05 and 0.4 mL/rat in order to investigate the effects of repeated acute inflammatory stimulation.
The authors presumed that peaks would occur after each injection and that serum concentrations of α2M and AAG would continue to increase due to the repeated injection of turpentine oil. It has been reported that peak levels of α2M and AAG after single injection of 0.4 mL/rat of turpentine oil are 4.53 and 3.22 mg/mL, respectively. 17,20 Peak levels of α2M and AAG after 0.4 mL/rat injection in this study were certainly high. However, the changes in α2M and AAG indicated a similar pattern to single injection in both dose groups.
Peak serum levels of α2M and AAG differed significantly between the 0.05 and 0.4 mL/rat injection groups. However, peak values of α2M and AAG in the 0.4 mL/rat injection group were about 1.4- and 1.3-fold higher than those in the 0.05 mL/rat injection group, respectively, despite the 8-fold difference in dose. Peak levels of IL-6 and CINC-1 were observed at 12 h after injection in previous reports. 17,20 Serum levels of IL-6 and CINC-1 at 12 h after the first injection were significantly different between the 0.05 and 0.4 mL/rat injection groups. However, serum levels of IL-6 in the 0.4 mL/rat injection group at 84 h after first injection, which corresponded to 12 h after the third injection, were significantly lower than in the 0.05 mL/rat injection group. Peak levels of these cytokines in the 0.05 mL/rat injection group were similar when compared with pre-injection levels. However, the peak levels of both cytokines in the 0.4 mL/rat injection group decreased after every injection.
A clear significant difference was observed in peak serum levels of α2M and AAG. However, the differences between the groups were not proportional to dose. This may be the result of differences in the production of IL-6 and CINC-1 between the 0.05 and the 0.4 mL/rat injection groups. IL-6 has been reported to stimulate acute-phase protein production. 10,21–23 Rat CINC-1 is considered to be the counterpart of human IL-8. 24,25 IL-8 is known to regulate the production of acute-phase proteins on human hepatocytes. 26 In this study, IL-6 and CINC-1 were produced at similar levels after each 0.05 mL/rat injection, but were produced in proportion to dose only after the first injection in the 0.4 mL/rat injection group. α2M and AAG production occurred after each injection in the 0.05 mL/rat group. On the other hand, these acute-phase proteins were not produced in small amounts after the second and third injections in the 0.4 mL/rat group. Thus, the difference in peak levels between both injection groups was not dose dependent.
In summary, the changes in serum levels of α2M and AAG after repeated acute inflammatory stimulation at doses of 0.05 and 0.4 mL/rat showed a similar pattern to single stimulation. Furthermore, peak serum levels in the 0.05 and 0.4 mL/rat groups were largely comparable. This phenomenon was thought to be caused by differences in the production of IL-6 and CINC-1 in the two groups. In the future, experiments are needed to clarify the individual functions of IL-6 and CINC-1 in the production α2M and AAG in rats. However, the present results suggest that IL-6 and CINC-1 contribute to α2M and AAG production.
Footnotes
Acknowledgement
This research was partially supported by the Promotion and Mutual Aid Corporation for Private Schools of Japan, Grant-in-Aid for Matching Fund Subsidy for Private Universities.