
Abstract
Recent technical developments in high-field magnetic resonance (MR) scanners, improvement in radio frequency coil design and gradient performance along with the development of efficient pulse sequences and new methods of enhancing contrast have made high-quality imaging of animal arthritis models feasible. MR can provide high-resolution structural information about the osteoarthritic changes in animal models, and also information about the biophysical properties of cartilage. This paper reviews the MR techniques available for animal knee imaging, and the various MR-derived readouts of knee osteoarthritis in animal models. Pitfalls in interpreting animal joint anatomy and joint composition are highlighted.
Osteoarthritis (OA) occurs in more than 60% of people over the age of 65 and is second only to cardiovascular disease as a cause of morbidity in Western society (Cooper et al. 1995). OA progresses slowly, characterized morphologically by destruction of cartilage, formation of bone cysts, sclerosis of subchondral bone and presence of osteophytes at the joint margin. However, it is not yet clearly understood which of them is first or predominantly affected in the early stages of the disease. These limitations in knowledge are partly due to the absence of means to detect early changes or to follow the natural history of the disease in individual patients. Because of the lack of specific early signs, OA can be recognized with certainty only relatively late in its course. Despite the high and vastly increasing number of patients, currently there exists no accepted medical treatment for OA that can effectively modify the disease or its structure.
As tissue sample cannot be reliably obtained in the early stages of human OA, a number of animal models have been devised to investigate the pathogenesis of OA, where the same joint can be studied both in the earliest and much later stages of disease within a predictable time span. OA animal models are also used to evaluate potential new treatments. The development of any new therapy is facilitated by proof-of-concept and proof-of-principle studies in animal models (Brandt 2002). OA animal models are divided into two main categories: spontaneous joint degeneration models and experimentally-induced OA models. Spontaneous OA in the knee joint of mice (Sokoloff et al. 1962, Nordling et al. 1992) and guineapigs (Bendele & Hulman 1988, Bendele et al. 1989) has been described. Experimentally-induced OA models are further subdivided into biochemically and biomechanically-induced OA. Biochemical induction is achieved by intraarticular injection of chemicals that cause lysis of specific cartilage constituents, such as collagen, proteoglycans (PG) and/or chondrocytes. Biomechanical induction involves the initiation of biomechanical instability through surgical transection of a ligament, such as an anterior cruciate ligament, or the partial removal of the meniscus (meniscectomy) or a combination of both (Bendele et al. 1999, Bendele 2001). It is a great advantage for research that the time course of spontaneous OA in animals, such as guineapigs, is much more rapid than the development of OA pathology in humans. For testing potential OA drugs, the ideal model would be a small species such as rat or guineapig, which would allow for dosing relatively large groups of animals. The disease progression should occur over no longer than three months (Bendele et al. 1999). The knee is the joint most used for OA induction, as compared with other joints, the knee is easily accessible to intervention and assessment.
Magnetic resonance (MR) imaging has already been applied to investigate a variety of OA animal models, including mouse (Munasinghe et al. 1995), rat (Wang et al. 2005, Wang et al. 2006c), guineapig (Watson et al. 1996b, Tessier et al. 2003), rabbit (Calvo et al. 2001, Laurent et al. 2003), monkey (Gahunia et al. 1995), goat (Laurent et al. 2006) and dog (Libicher et al. 2005). MR imaging can non-invasively provide detailed images of joints displaying cartilage, skin, synovial cavity, muscle and bones (Wang et al. 2006a). Furthermore, MR imaging can be used to carry out in vivo longitudinal follow-up in the same animal and track the disease, monitor its progress and see how it responds to potential treatments. In a recent study of a mono-iodoacetate-induced arthritis model in rats (Wang et al. 2005), MR imaging demonstrated that intraarticular soft tissue inflammatory changes peaked at day 3 and started regression afterwards; bony damages appeared at day 14, peaked at day 21, with hallmarks of repair visible by day 35. A similar biphase pain response was observed clinically with the 1 mg mono-iodoacetate dose group, peaking at days 3 and 21. Therefore, MR imaging was able to characterize the pathological course of the arthritis model, which enables a link to be established between the structural changes and clinical joint discomfort. For spontaneous animal models where OA develops spontaneously and sometimes asymptomatically, it is difficult to determine precisely the onset, the extent of the disease and inter-animal variation. With such variability, it is highly desirable to be able to non-invasively monitor animal disease progression. In a spontaneous guineapig OA model, Watson et al. (1996b) reported that serial observations with MR imaging was able to detect significant progression of lytic bone lesions, subchondral sclerosis and osteophyte size over a period of six weeks. From the perspective of reduction, refinement and replacement, compared with terminal histological methods, MR imaging can lead to dramatic reduction in animal usage. With the advent of new MR techniques, the ability to non-invasively assess the effect of treatment on the cartilage matrix can benefit the development of chondroprotection therapies (Laurent et al. 2006). MR imaging-derived measurements have been suggested as surrogate endpoints for disease-modifying anti-OA agent. However, validation of MR imaging endpoints for OA trials in human studies is still incomplete. The design and interpretation of a clinical trial is strengthened if the effect of the drug is shown by the same endpoint in a valid animal model.
This paper reviews the MR techniques for animal knee imaging, and the various MR-derived readouts of knee OA in animal models, with an aim to further disseminate MR imaging techniques to the bioscientific community.
MR techniques for animal knee imaging
OA models of small animals are preferred due to economic as well as ethical reasons. The requirement for high resolutions in small animal knee MR imaging demands high performance of MR instruments. The increased availability of high-field MR scanners, continuous improvements in radio frequency (RF) coil design and gradient performance along with the development of more efficient pulse sequences and new methods of enhancing contrast have made high-quality imaging techniques of small rodent knees feasible for the bioscientific community.
MR techniques for imaging knee joints of experimental animals require good signal-to-noise ratio (SNR), good spatial resolution and good tissue contrast. SNR is the ratio between the intensities of the signals from tissue and background. Tissue contrast is the difference between the signal intensities of a target tissue (or a lesion) and the surrounding or adjacent tissues. Spatial resolution refers to the smallest size of detail that is visible on images. The spatial resolution is determined by the thickness of the slice and the size of the smallest element of the image, the pixel.
The instruments help to determine the quality of the image. With increasing magnetic field strength, the SNR increases. The quality of the RF coil receiving the signal also significantly affects SNR. Because the spatial resolution, SNR and contrast-to-noise ratio (CNR) and acquisition time are mutually interdependent, optimizing one of these parameters at a given magnetic field strength necessitates sacrifices in the others. The best compromise depends on the instruments, the data acquisition sequences and, most importantly, the study requirements.
Magnet and RF coil
A higher magnetic field offers a higher SNR. This can be traded for better spatial resolution. Using a goat osteochondral defect-repair model, Kangarlu and Gahunia (2006) have reported that MR images from an 8 Tesla scanner have improved SNR, delineation of joint tissues and visualization of tissue microstructure compared with those from a 1.5 Tesla scanner. However, it is technically difficult to build a very high-field MR scanner with a large horizontal bore to hold large animals. Due to this limitation and also cost constraints, though high-field large bore scanners are available on the market, high-field research MR scanners are usually equipped with small bores that can hold animals up to the size of rabbits or rats. For imaging of large animals like dog and goat, clinical human scanners are commonly used, which have a magnetic field of 1.5–3 Tesla, mostly together with an RF coil designed for the human knee. It has been reported that with a standard human knee RF coil, it is feasible to scan both knee joints of a dog in parallel position (Libicher et al. 2004). For signal optimization, suitable RF coils for animal knees can be custom-made and interfaced with clinical human scanners.
For small animals, small bore research scanners with a magnetic field of 4.7 Tesla or above are preferred. The RF coils are usually home-made, or made by some small specialist companies. The most commonly used is the single-turn solenoid RF coil (for the principle of these RF coils, see Fan et al. 1987). They are designed to open at the top. Animals can be placed on a perspex platform with one hind leg extending through the RF coil, with the knee centred in it. While designed to completely cover the knee joint of the animal species imaged, the length and diameter of the coil are optimized to minimize the image field of view so as to get a good filling factor. To prevent motion, the animal's paw of the scanned leg can be secured to a secondary lower platform.
MR pulse sequences
The pattern of joint structures as seen on MR images can be modified in various ways by the choice of MR pulse sequences, and the addition of pulses and contrast agents. Numerous studies have evaluated different MR pulse sequences in order to obtain high-resolution images of the knee joint with high SNR. The most commonly used pulse sequences include fat-suppressed (FS) T1-weighted three-dimensional (3D) gradient-echo (GE) sequence and FS T2-weighted or intermediate-weighted fast spin-echo (FSE) sequence. GE sequence allows very short time of echo (TE), this can improve signal sensitivity when small structures are imaged. GE sequences with short TEs and relatively large flip angles provide T1-weighted images where the intraarticular fluid is less intense than the cartilage and fat is suppressed, therefore maximizing the contrast between cartilage, fluid and marrow, with cartilage showing a bright signal. Intermediate-weighted and T2-weighted FSE imaging depict high intensity synovial fluid and intermediate to low signal intensity cartilage. With human knee MR imaging, it has been demonstrated that FSE images offer the most accurate measurements of cartilage thickness, whereas small focal cartilage defects are best identified using the 3D GE images (Tervonen et al. 1993).
With high-field MR scanners, a 3D data-set of around 100 μm resolution can be obtained with scanning duration of <1 hour (Faure et al. 2003, Wang et al. 2006c). One study of the human knee joint demonstrated that cartilage volume measurements based on the images with the highest resolution had the best reproducibility (Hardy et al. 2000). Using a model of artificial cartilage lesions in rabbit joints, Link et al. (1998) demonstrated that the ability to detect small cartilage lesions critically depends on the spatial resolution and that achieving a high spatial resolution justifies some degree of sacrifice in SNR. With 3D data-sets, images can be reconstructed and analysed in any desirable plane. However, 3D data acquisitions are generally more time-consuming than two-dimensional (2D) techniques. Before acquiring 3D data that typically takes 40–60 min for small animal joint imaging, ‘scout image’ or ‘pilot scan’ using multislice 2D sequences are used. These multislice 2D experiments provide a quick way of testing and adjusting the animal positioning, slice orientation and also pulse sequence parameter optimization.
FS is important for increasing the dynamic range between cartilage and adjacent structures and to eliminate chemical shift artefacts (see ‘imaging artefacts’ below) at the cartilage–bone interface. FS enhances the contrast for the cartilage and it has been reported that it can lead to better reproducibility of the volumetric measurements (Sittek et al. 1996). FS is accomplished by spectral fat saturation using a pre-pulse tuned to the resonant frequency of fat (chemical selective fat suppressing), or by frequency-selective water excitation or short-tau inversion-recovery (STIR) technique. Marrow abnormalities are most sensitively demonstrated with FS T2-weighted spin-echo or FSE images and STIR images. One limitation of FS images is that local magnetic field heterogeneities near irregularly-shaped anatomy, such as the patella, or near metal debris/implant can result in areas of failed FS, which can mimic abnormality (see ‘imaging artefacts’ below).
MR relaxation time measurement
During the early stages of OA, articular cartilage constituents degenerate before any substantial morphological changes occur. Clinically, anatomical signs of cartilage breakdown are not always detected, even in some symptomatic patients (Pessis et al. 2003). During disease progression, changes in the tissue MR relaxation values (T1, T2 and T1ρ [or, T1 in the rotating frame]) reflect early alteration in the tissue architecture and biochemical composition.
T1ρ is defined as the spin-lattice relaxation time in the rotating frame and is influenced by the relaxation of water protons in the presence of extracellular matrix molecules (Hulvershorn et al. 2005, Wheaton et al. 2005). The diffusion-induced signal losses, susceptibility artefacts and orientation dependence are substantially reduced in T1ρ MR imaging. In articular cartilage, T1ρ is strongly correlated with PG content and mechanical properties (Wheaton et al. 2005). The T1ρ pulse sequence consists of a 90° pulse followed by a spin lock pulse.
The inversion recovery with multiple delays is the standard technique to measure precontrast enhancement T1 values. However, in the absence of contrast agent, it has been suggested that T1 is relatively insensitive to cartilage degeneration (Bashir et al. 1999). T2 can be measured using spin-echo sequences with multiple echoes. There is substantial heterogeneity of T2 across healthy cartilage. This spatial variation should be taken into account during interpretation.
Quantification of T1, T1ρ and T2 is technically more challenging than structural measurement. Literature reports are mostly studies on fresh specimen or 2D techniques are employed where the weight-bearing area is investigated. In addition, these results may not be consistent if different RF coils, sample geometries or acquisition techniques are utilized, and cross-study comparison remains difficult.
Magnetic transfer MR imaging
Magnetization transfer (MT) imaging has been used to evaluate the quality of cartilage tissue in early cartilage degeneration (Wachsmuth et al. 1997). MT imaging depends on the existence of two pools of mobile water protons in the cartilage: a free pool of water protons and a bound pool of water protons that are linked to different macromolecules. Due to a dipolar coupling between mobility-restricted and freely moving water, relaxation of one pool will influence the relaxation of the other. After saturation of only the bound water protons, the subsequent exchange of magnetization to the free water protons results in a reduction in the MR signal. The magnitude of the MT effect depends on the presence and extent of the bound pool and the ease of interaction between bound and free water protons. When compared with other body tissues, articular cartilage exhibits the most pronounced MT effect (Ceckler et al. 1992). Studies comparing the contribution of the different macromolecular components of the cartilage on the MT effect have led to the conclusion that the collagen network is the most important contributor (Kim et al. 1993, Gray et al. 1995). Collagen network functions as a load-bearing material, providing a smooth surface for joint articulation and also extra stiffness.
An MT pulse can be added to an MR imaging sequence (Wolff & Balaban 1994). For imaging, two data-sets are acquired, one with and one without an MT pulse, and then a magnetic transfer ratio (MTR) image (MTR = [(M 0 − M s)/M 0] with M 0 and M s referring to signal intensities before and after saturation, respectively) can be calculated. Due to the high MTR, the normal hyaline cartilage appears dark in images after MT and bright in the MTR images; in contrast, the pathological cartilage appears bright after MT and dark in the MTR images. An MTR rate constant can be measured by varying the time duration of MR pulse and the rate constant derived from the initial slope of the exponential decay (Laurent et al. 2001). The MTR rate constant was found to be similar for rabbit and goat and, therefore, allows cross-species comparison, and is more sensitive to changes (Laurent et al. 2003).
Delayed Gd-[diethylene triamine pentaacetic acid (DTPA)] 2− enhanced MR imaging
The constituents of articular cartilage extracellular matrix include PG, collagen, non-collagenous proteins and water. The major function of PG is hydration of the cellular matrix, which provides much of the cartilage resiliency. The negative charges on PG sidechains lead to a high-fixed charge density (FCD) (Grushko et al. 1989). A decrease in FCD can expose cartilage to dehydration. Early changes in the biochemical composition of articular cartilage, such as PG depletion and loosening of the collagen network, play an important role in the aetiology and progression of OA (Lohmander 1994). These lead to altered water-binding behaviour of articular cartilage. The early diagnosis of OA requires the ability to non-invasively detect degenerative changes in PG concentration and collagen network integrity.
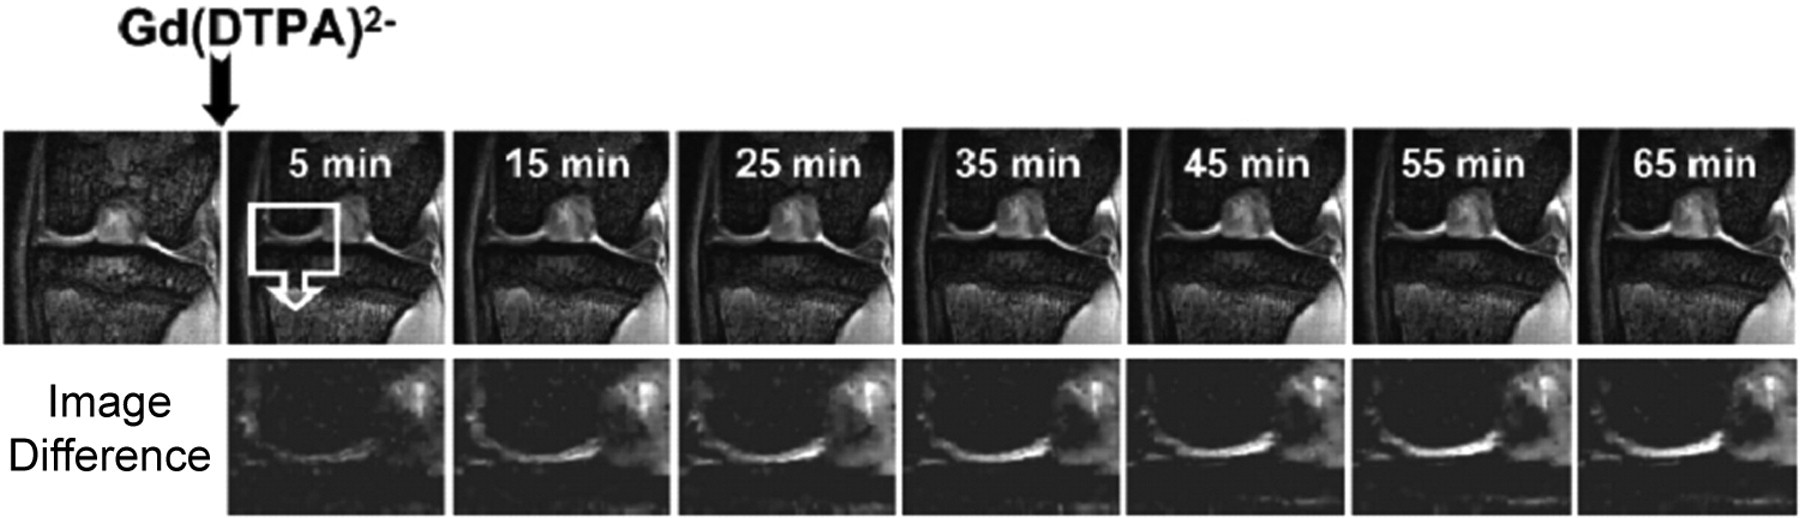
Delayed gadolinium-enhanced MR imaging is an in vivo method capable of detecting PG loss in OA tissue (Bashir et al. 1996, 1997). In principle, it allows measurement of cartilage FCD. The assumption is that the negatively charged Gd(DTPA)2− penetrates the interstitial fluid of cartilage to reach an equilibrium concentration that is governed by the Gd(DTPA)2− concentration gradient and electrostatic interactions. The distribution of Gd(DTPA)2− in degraded cartilage is reflected by a decrease in the T1 relaxation time, especially where tissue PGs are depleted. Kinetics of Gd(DTPA)2− uptake can also be observed (Figure 1). The rate of Gd(DTPA)2− uptake could be used as a potential biomarker for PG depletion (Laurent et al. 2003).
Both delayed Gd(DTPA)2− enhanced dynamic imaging and MT MR imaging are time-consuming techniques, therefore, 2D coronal view approach is commonly used, covering the weight-bearing region of the cartilage. With delayed Gd(DTPA)2− enhanced dynamic imaging, there is relatively little heterogeneity across the joint, the mean value within the measured region is meaningful.
Some novel MR techniques, such as diffusion-weighted imaging and sodium imaging have been investigated for the evaluation of cartilage properties (Burstein et al. 1993, Borthakur et al. 2000). Further studies are still to be carried out to validate their value for in vivo OA animal model application.
Imaging artefacts
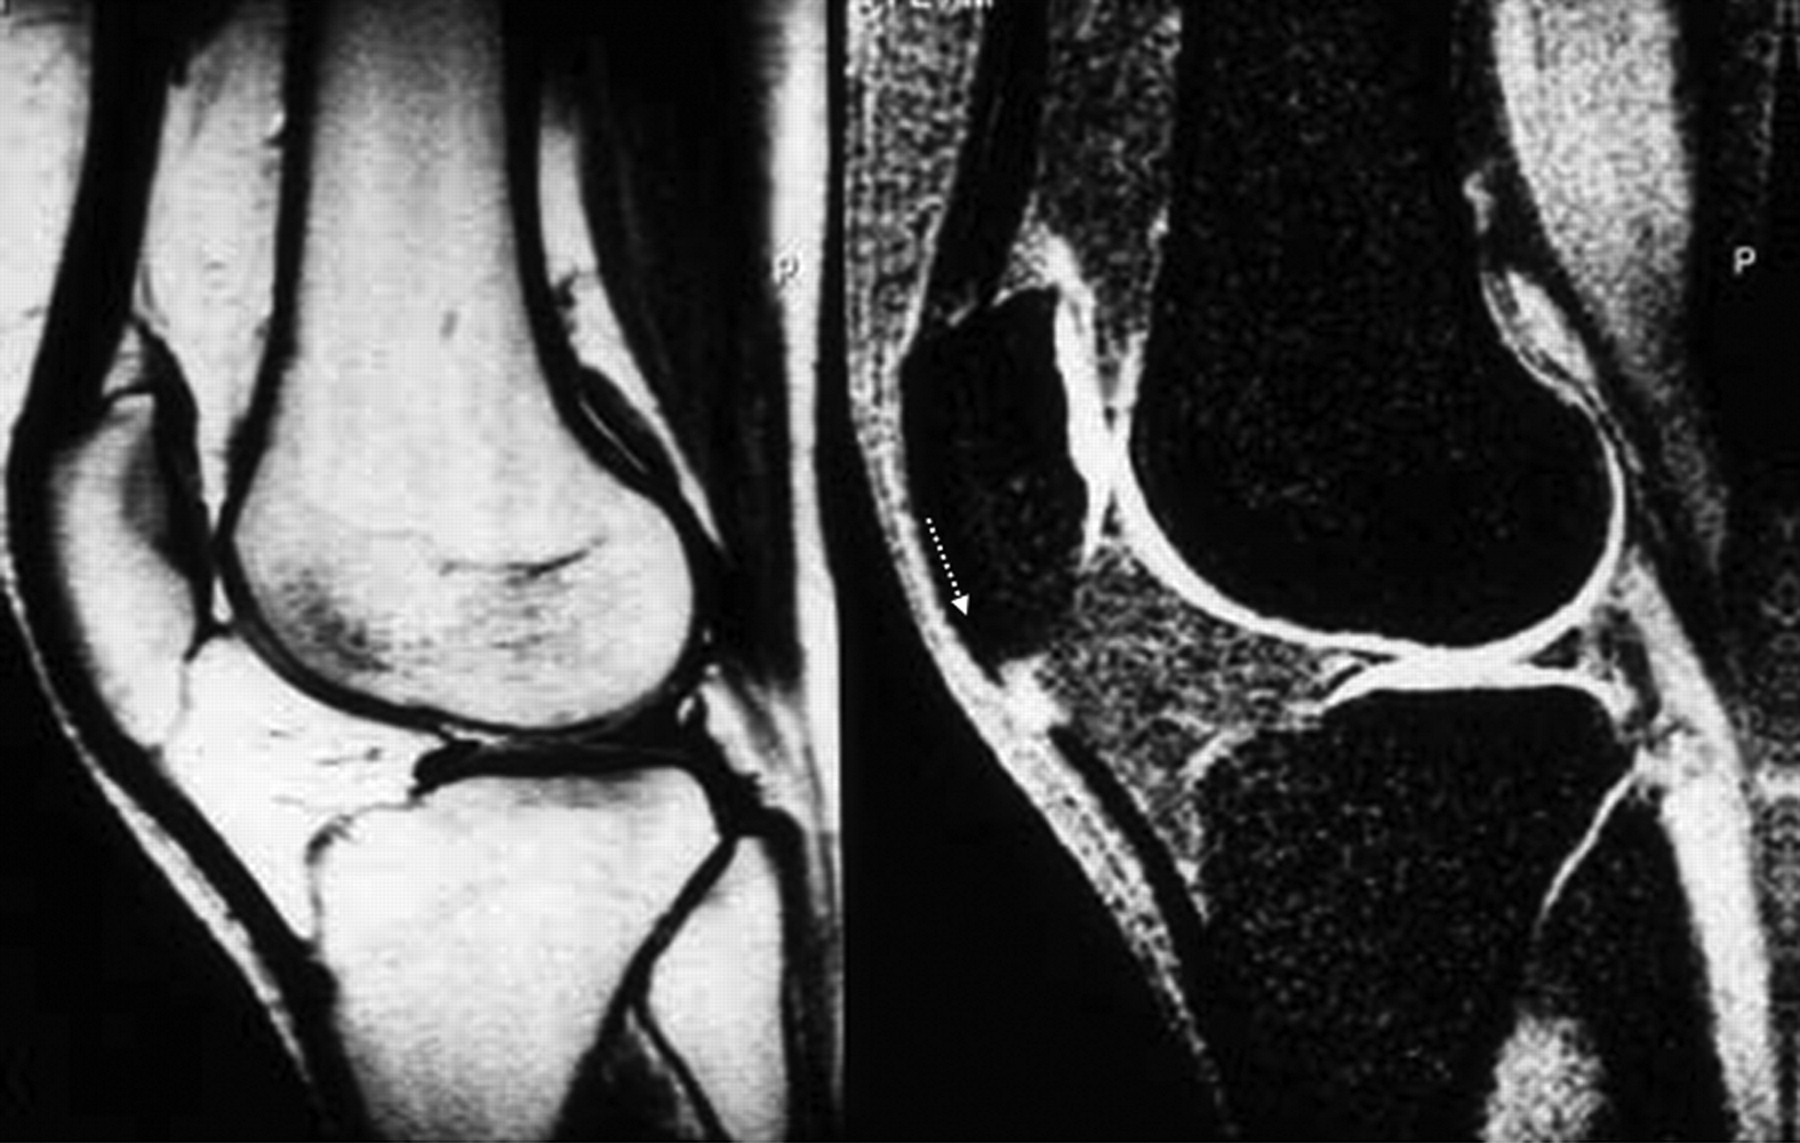
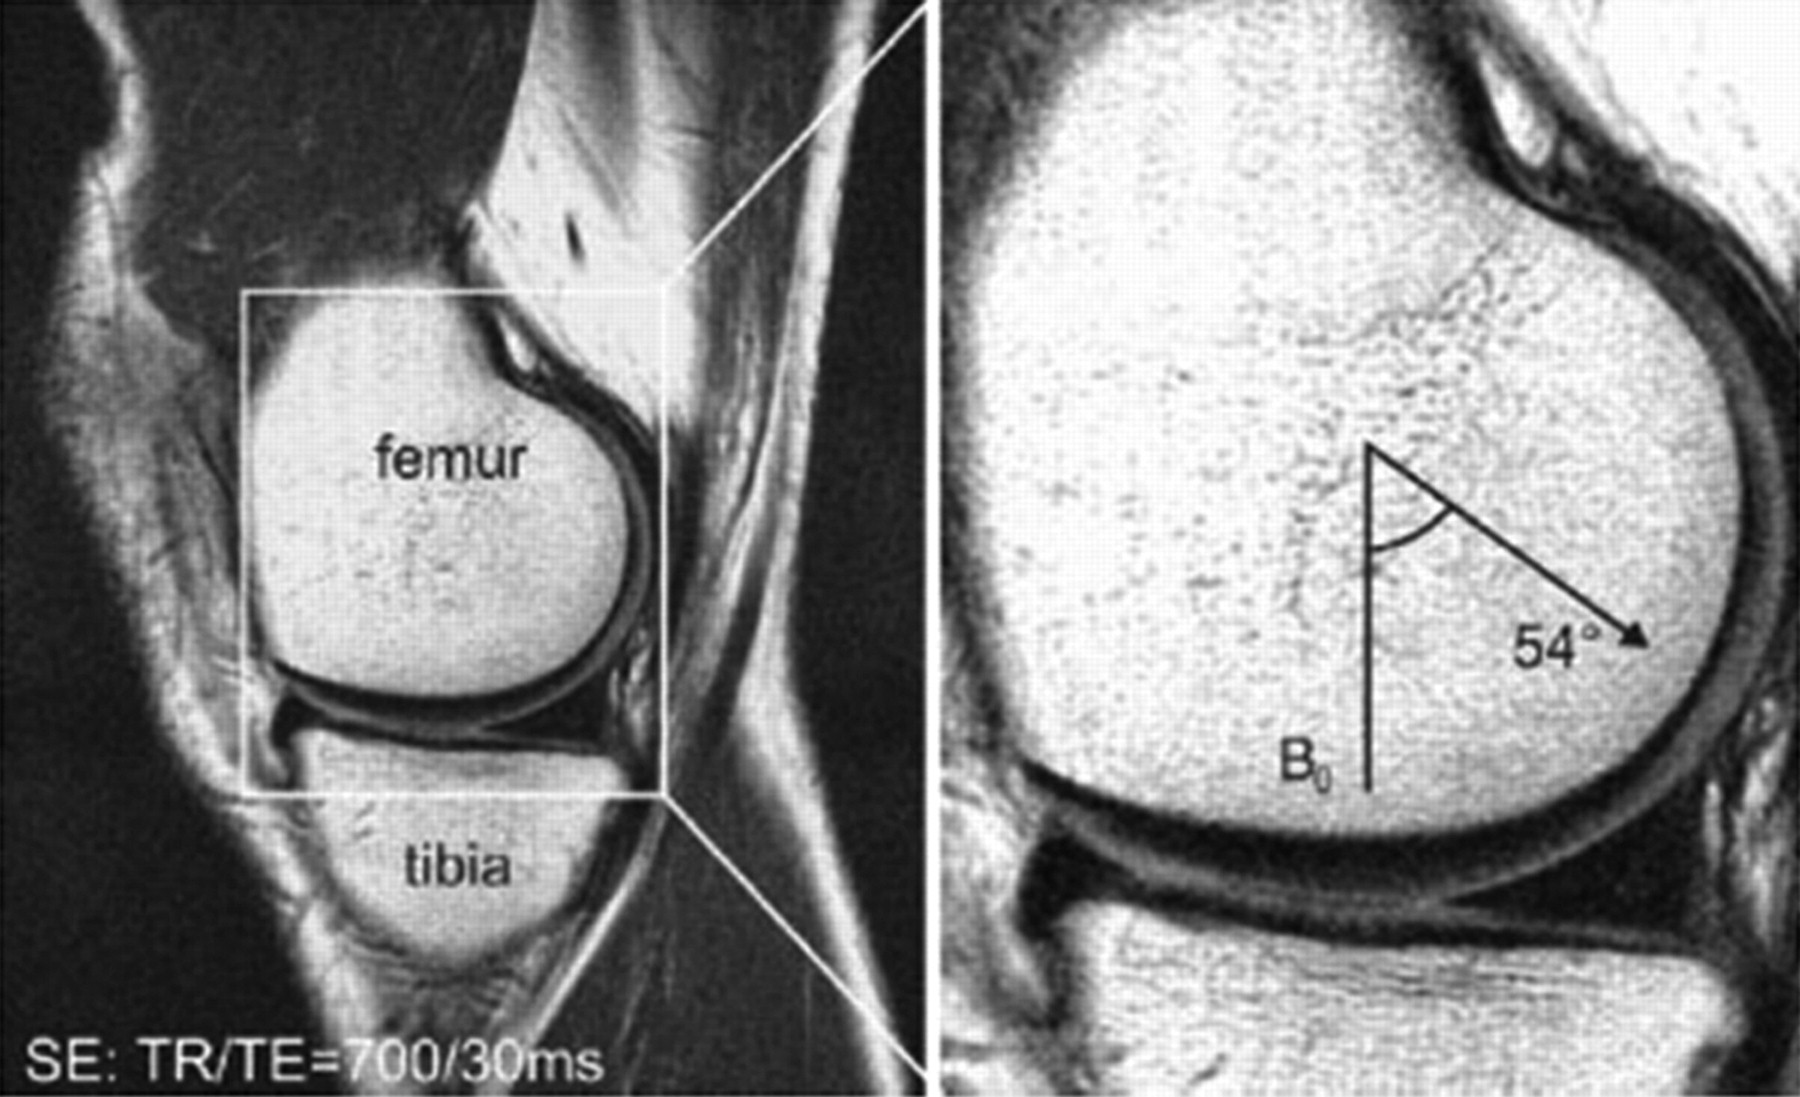
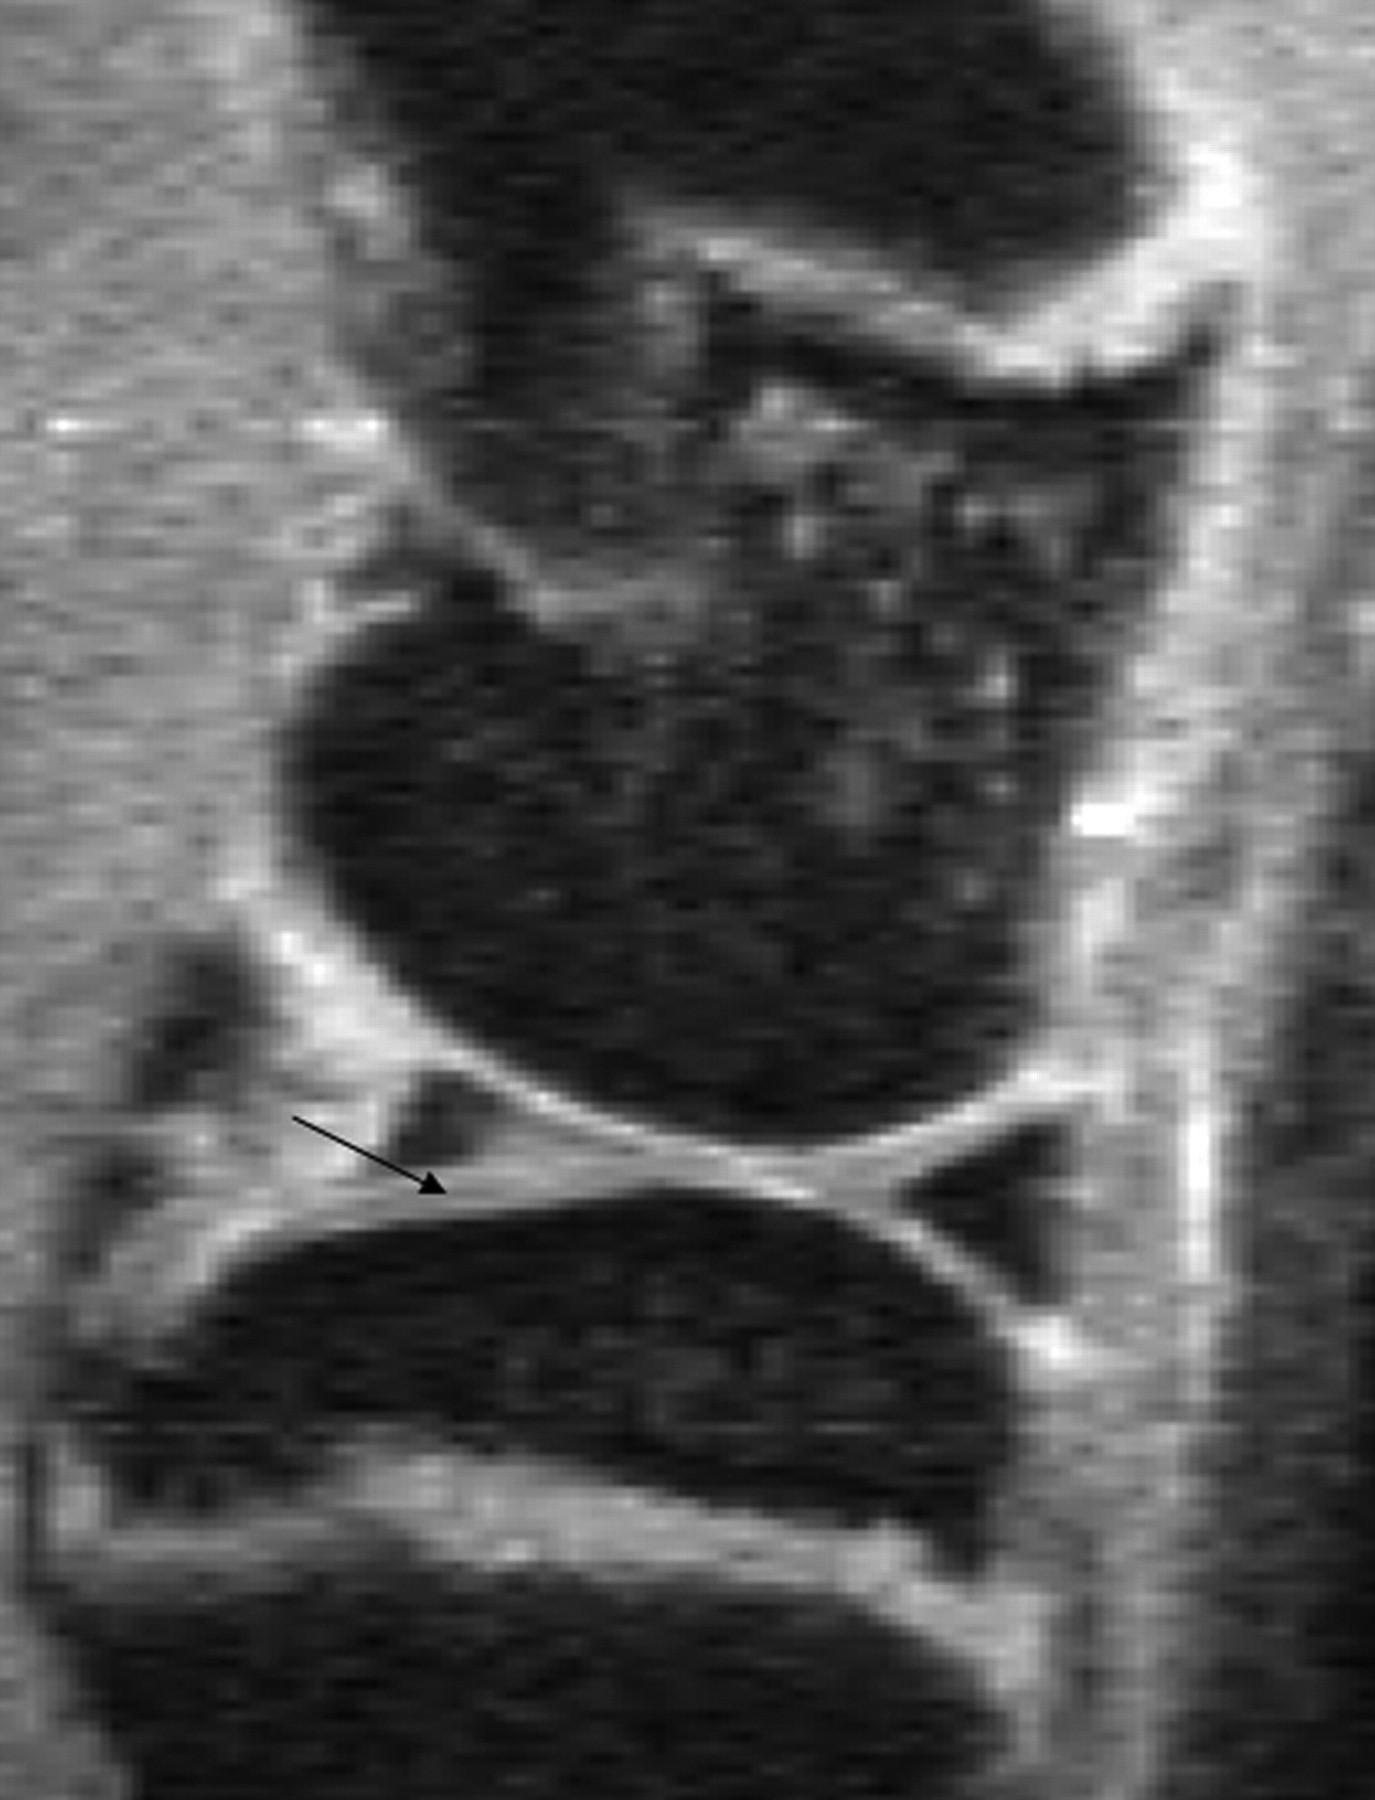
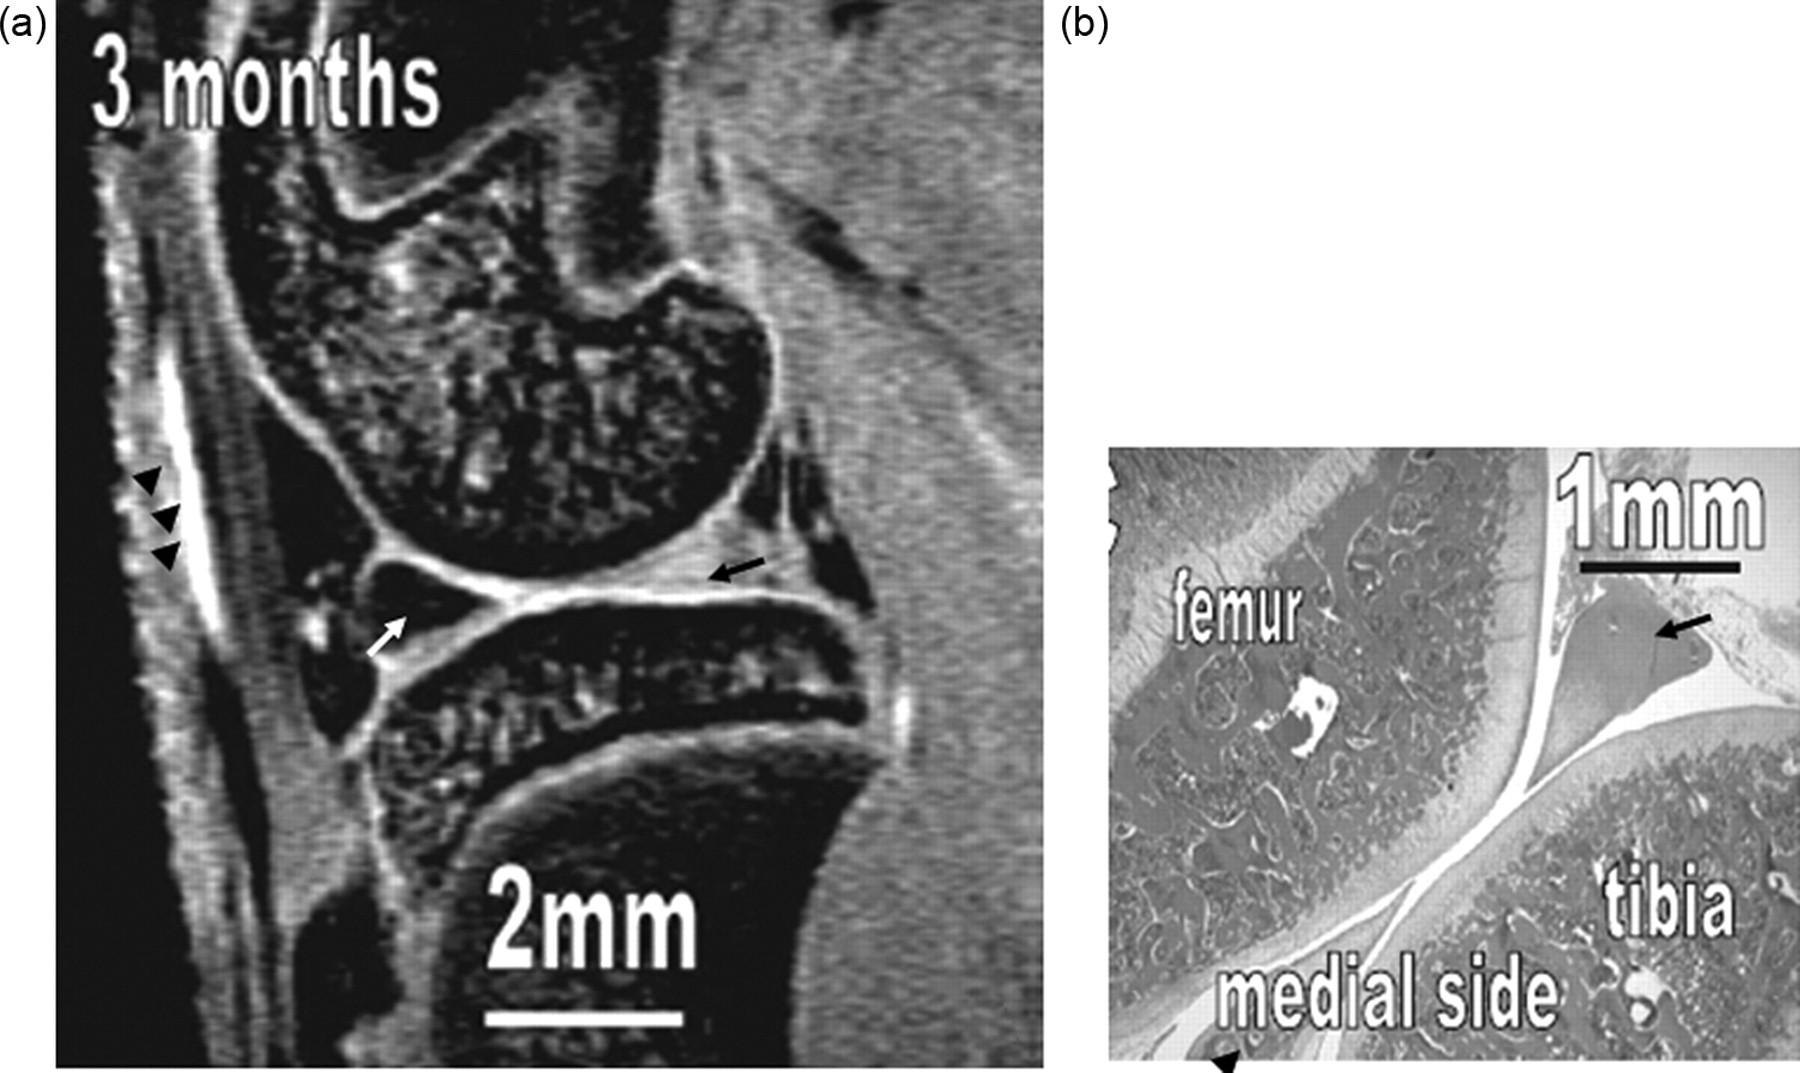
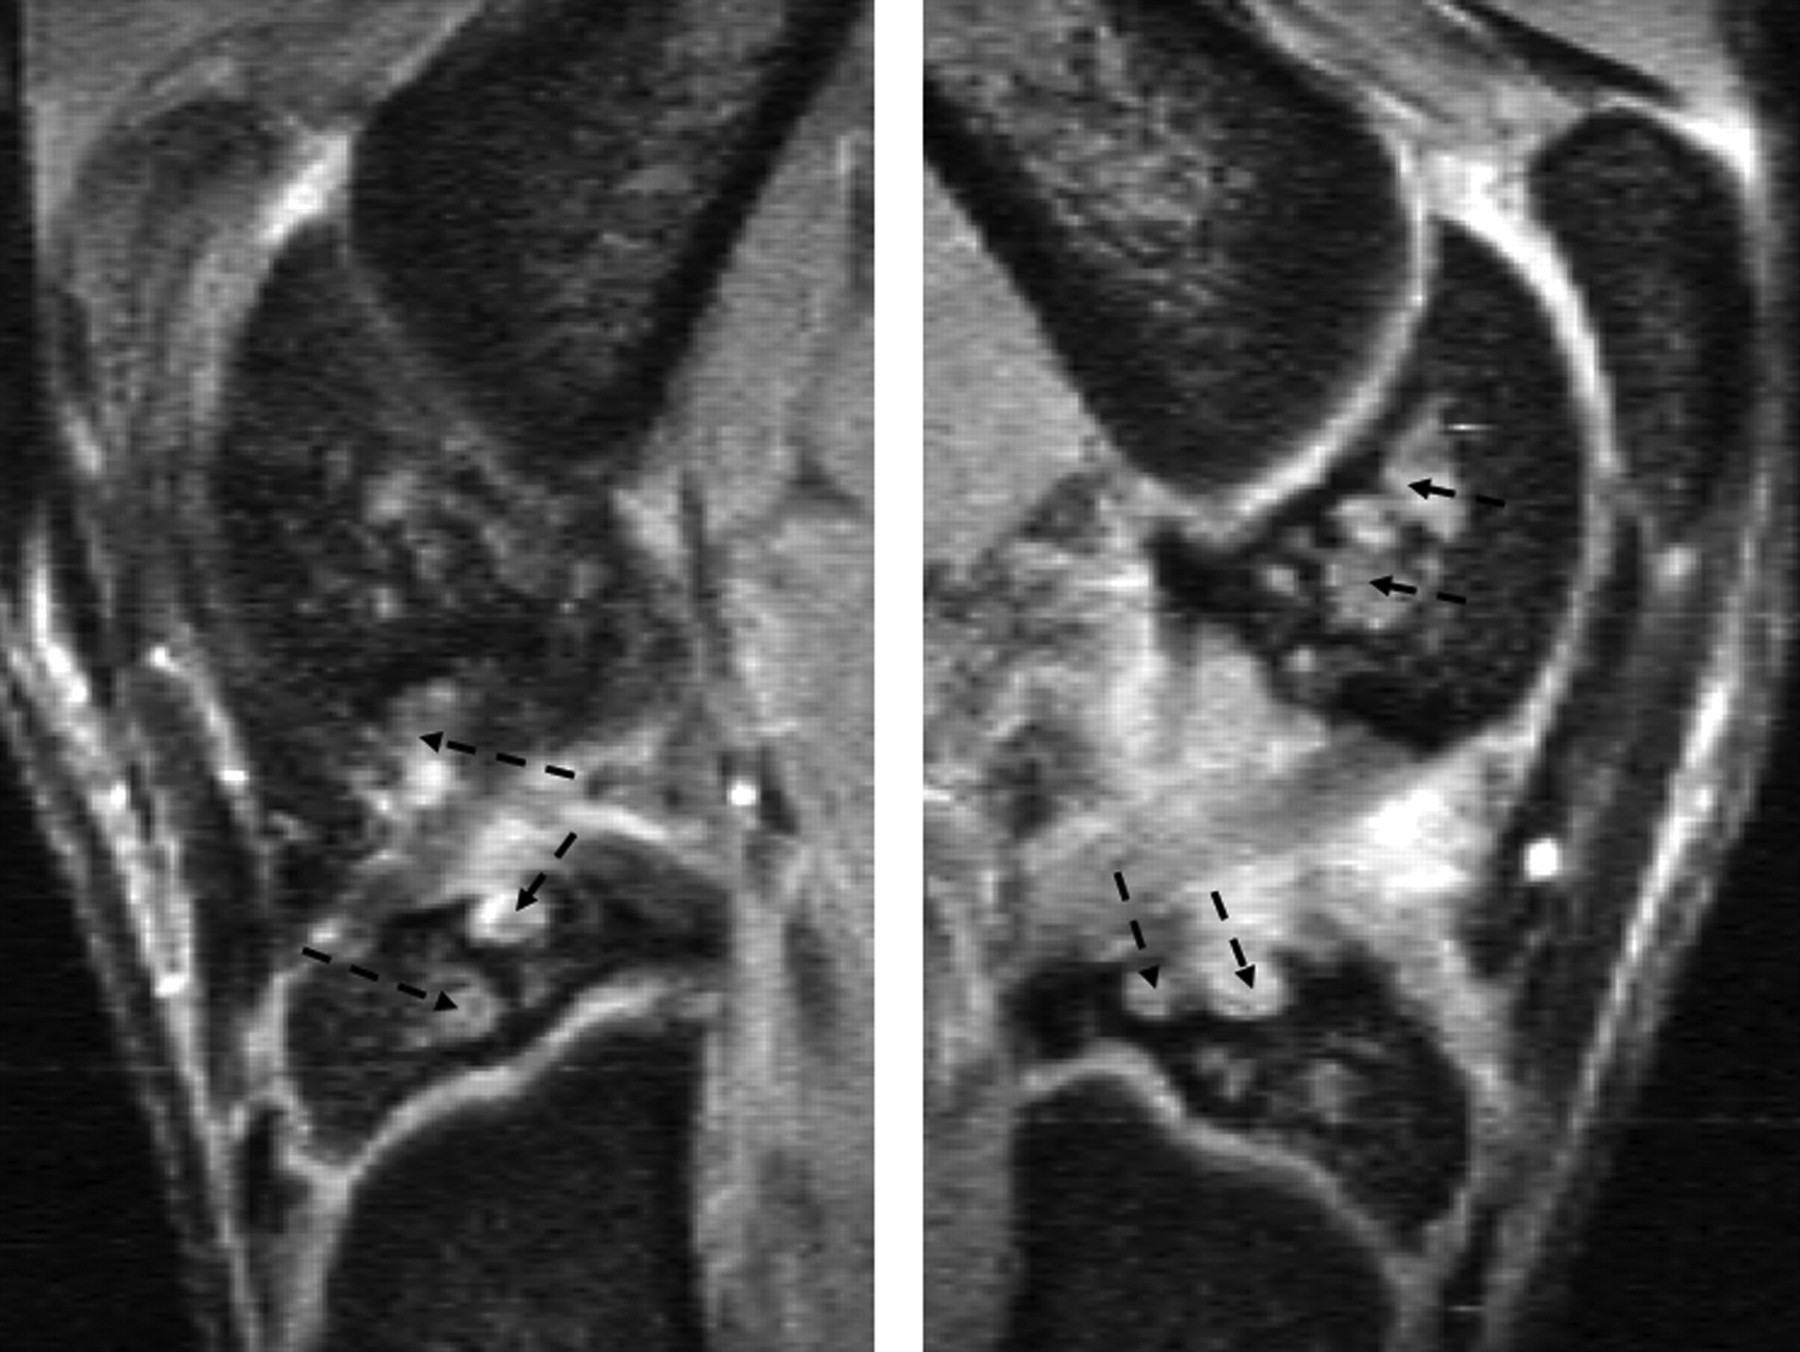
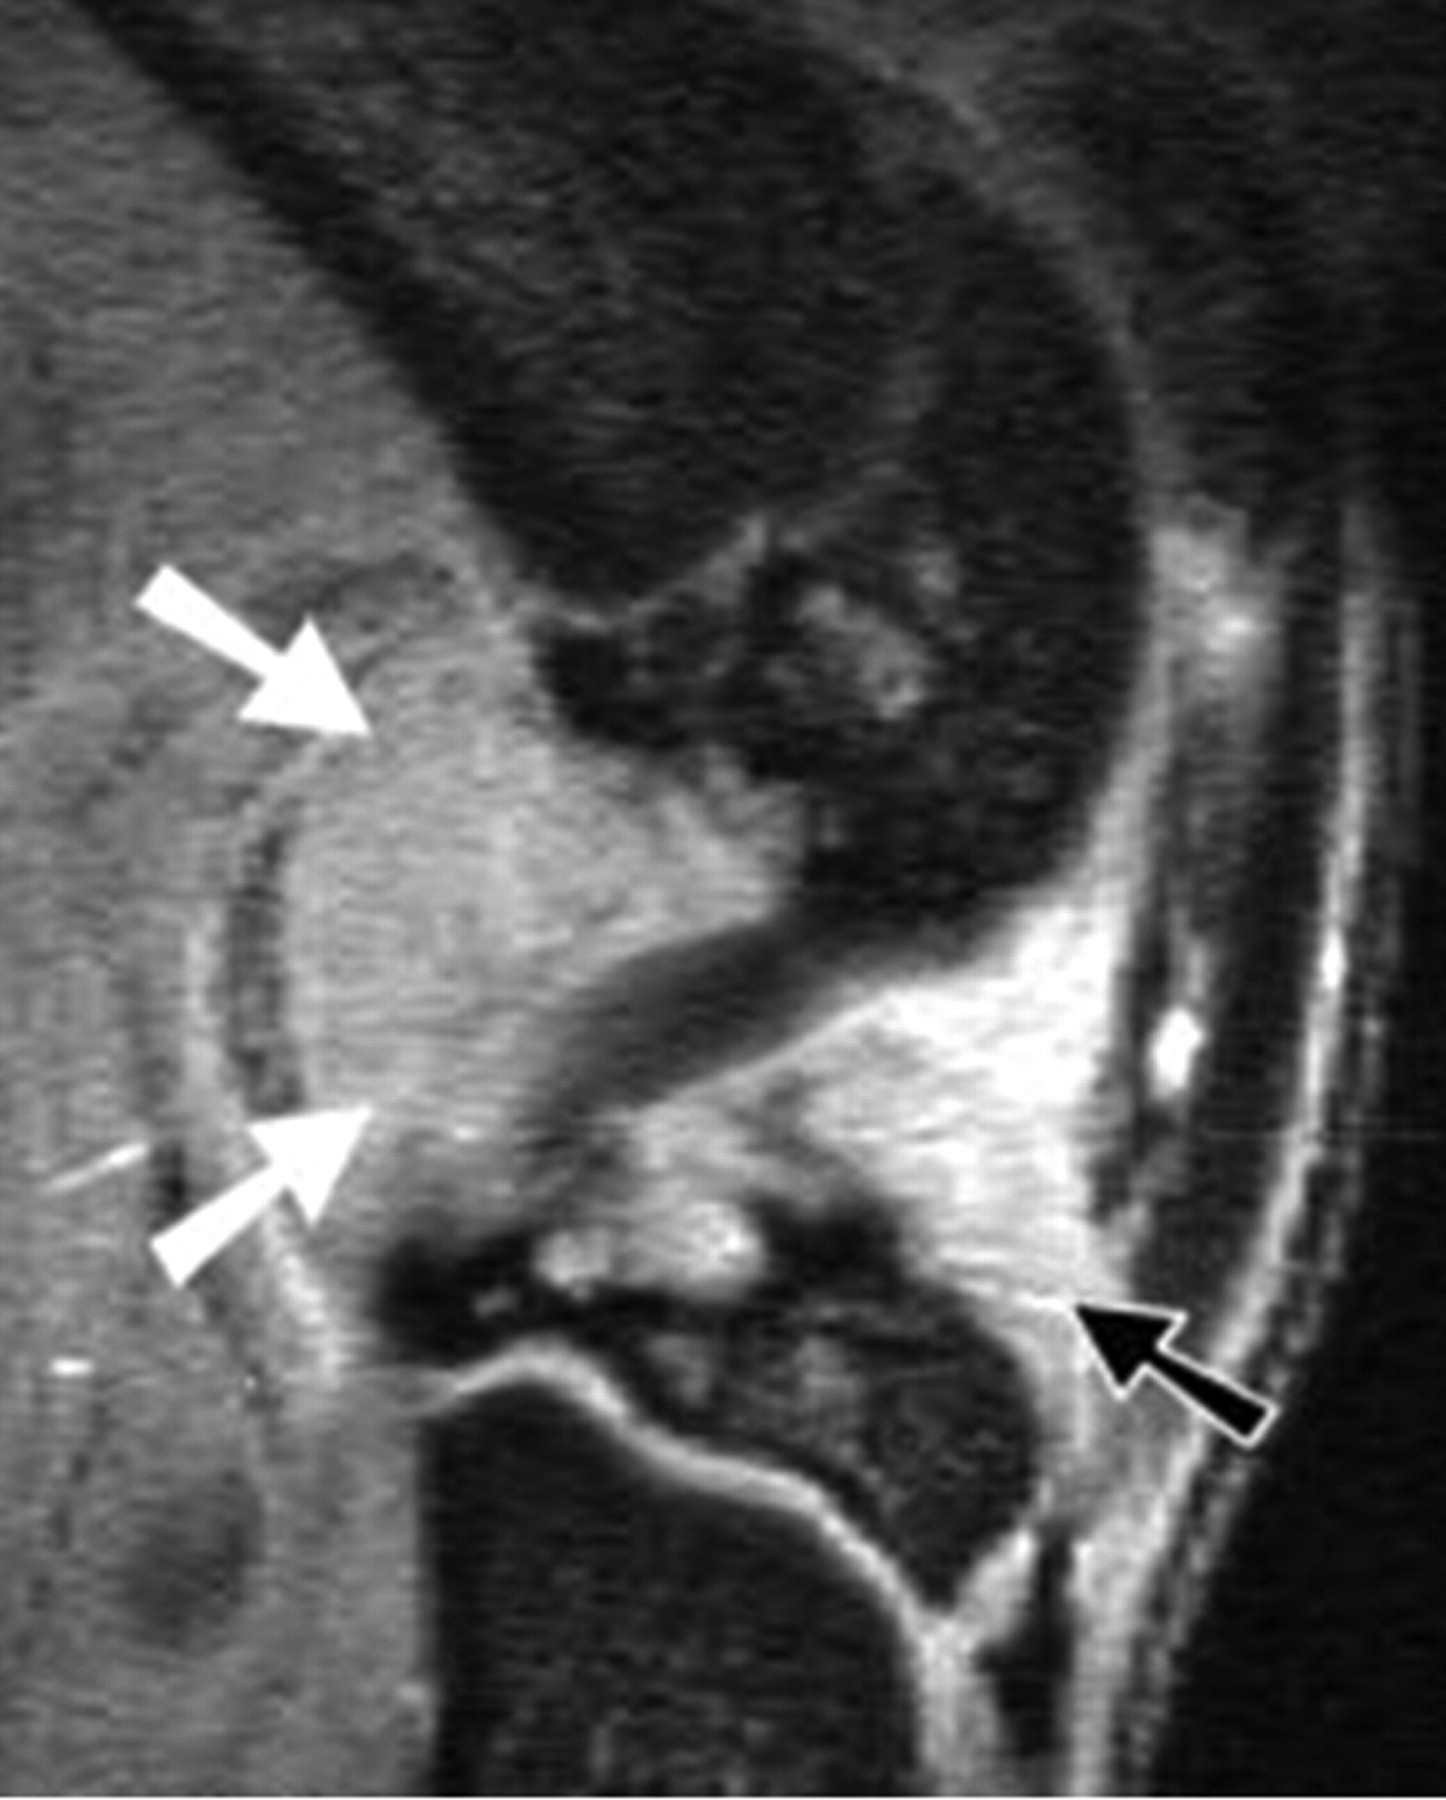
Artefacts can affect the quality of images, and may also simulate pathological conditions and produce pitfalls in interpretation. Common artefacts include motion artefact, magic angle phenomenon, truncation artefacts, chemical shift artefacts and susceptibility effects. Motion artefact in knee joint imaging is most likely due to problems of anaesthesia being too light and so that the animal moves during image data acquisition, and it can be easily recognized. Magic angle phenomenon affects tissues with well-ordered collagen fibres in one direction, such as tendon or articular hyaline cartilage. The induced hyperintense signal intensity is dependent on the orientation of the tissue to the main magnetic field B0, with maximum signal intensity observed at the ‘magic angle’ of approximately 540 to B0 (Figures 2 and 3). This explains the paradoxically high signal intensity of the tendons on some T1- and proton-density-weighted images, and this increased intensity can be confused with pathology. A laminated appearance of the articular cartilage is commonly seen on MR imaging. This laminar appearance within the articular cartilage on FS 3D GE images is predominantly attributable to truncation artefact due to under-sampling of the high spatial frequencies rather than to histological zonal anatomy (Figure 4) (Erickson et al. 1996, Frank et al. 1997, Waldschmidt et al. 1997). The current author has reported this laminated appearance in growth plate cartilage in rats (Figure 5, Wang et al. 2006b). Although histological zones of the rat growth plate can be correlated to the MR imaging laminated appearance, it is believed that this appearance is caused by truncation artefact. Chemical shift artefacts are due to the protons in fat being mis-mapped relative to water protons (Figure 6). Susceptibility artefacts occur at the interfaces of structures with different magnetic susceptibilities (Figure 7, Tessier et al. 2003). In some surgically-induced OA animal models, the metal debris remaining in the tissue after surgery can cause significant artefacts and distort the images. For detailed discussion of MR artefacts in musculoskeletal imaging, see Peh et al. 2001.
Interpretation of knee joint MR images
The structural determinants of joint dysfunction and pain in OA are not well understood, but are believed to involve multiple interactive pathways. Injury to one joint component leads to damage of other components, and thereafter collectively to the clinical manifestations of OA. For human knee OA MR imaging evaluation, some semi-quantitative scoring schemes, such as whole-organ magnetic resonance imaging score (WORMS) (Peterfy et al. 2004) and knee osteoarthritis scoring system (KOSS) (Kornaat et al. 2005), have been recently proposed. These schemes take into account a variety of features that are currently believed to be relevant to the functional integrity of the knee and/or potentially involved in the pathophysiology of OA, such as articular cartilage integrity, subarticular bone marrow abnormality, subarticular cysts, subarticular bone attrition, marginal osteophytes. It should be possible to develop similar scoring schemes for animal OA models.
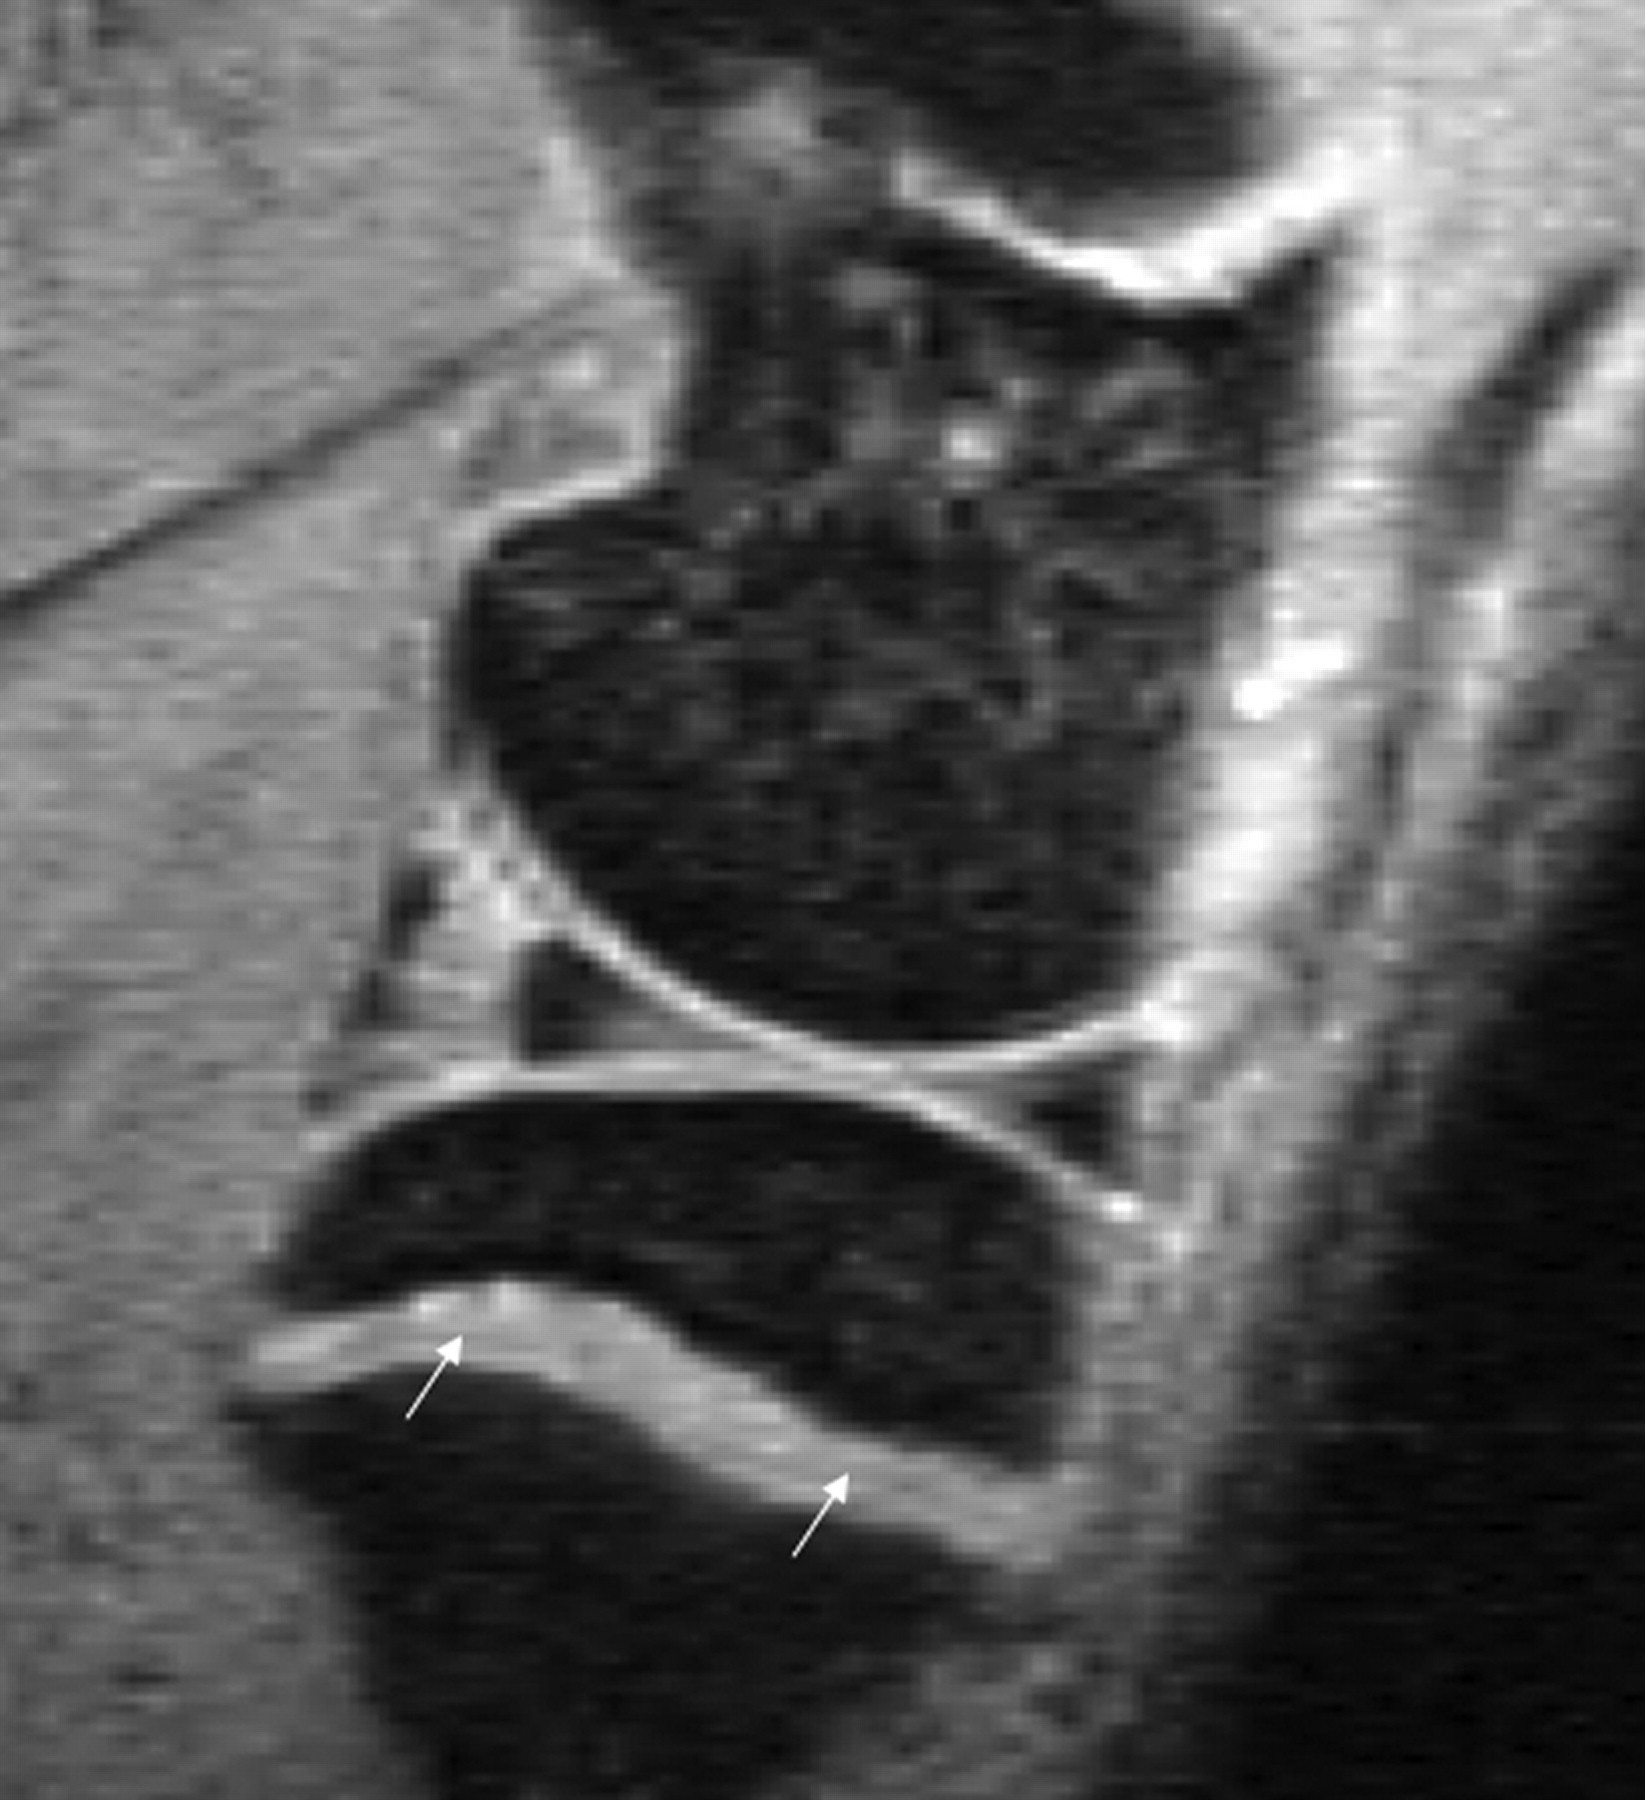
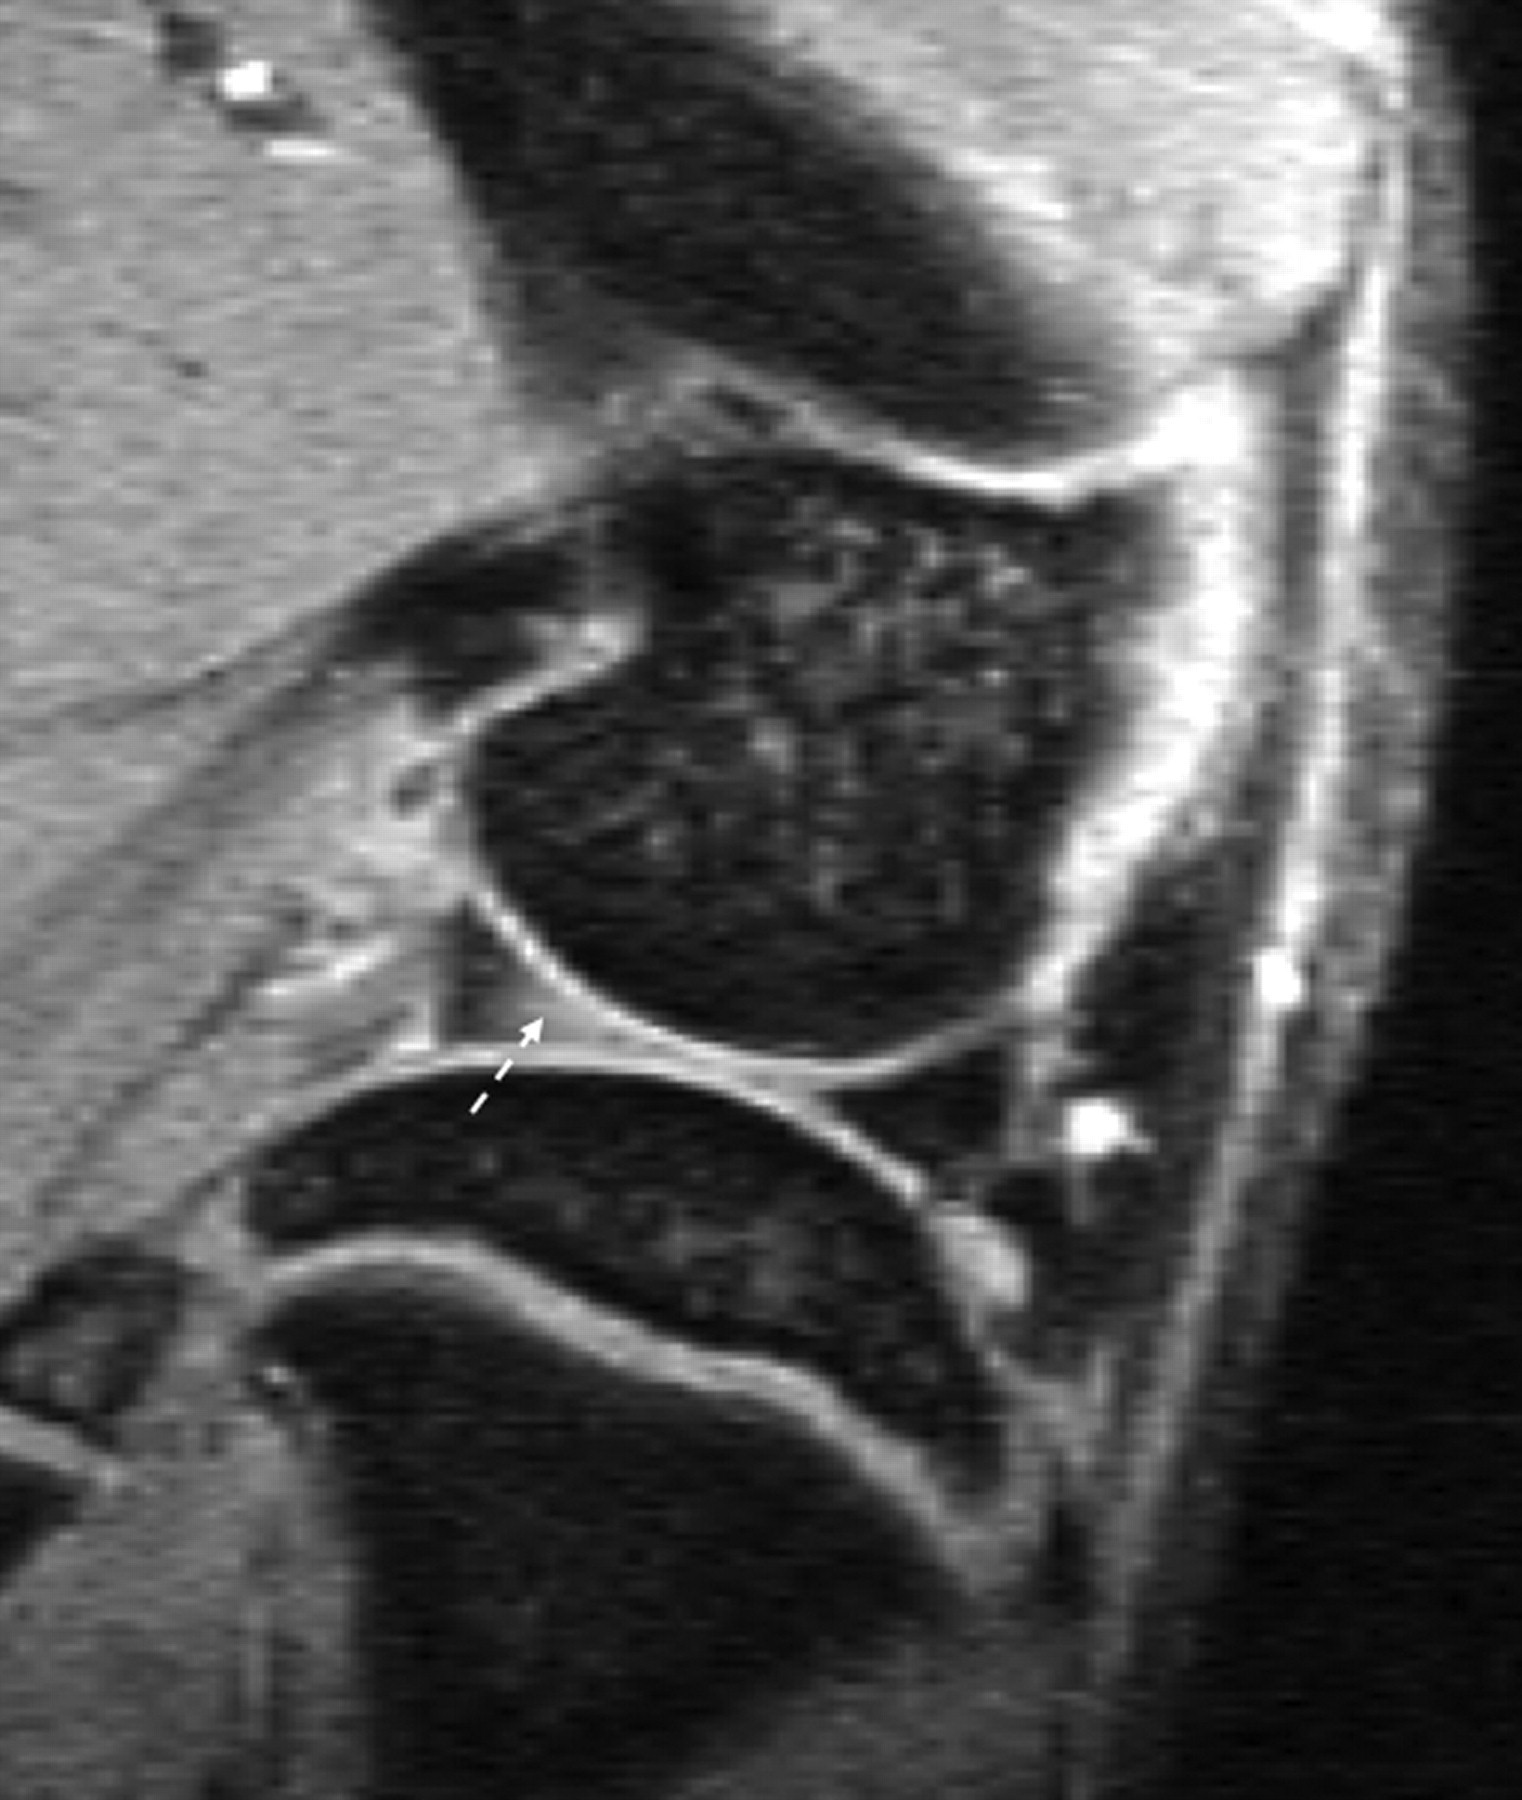
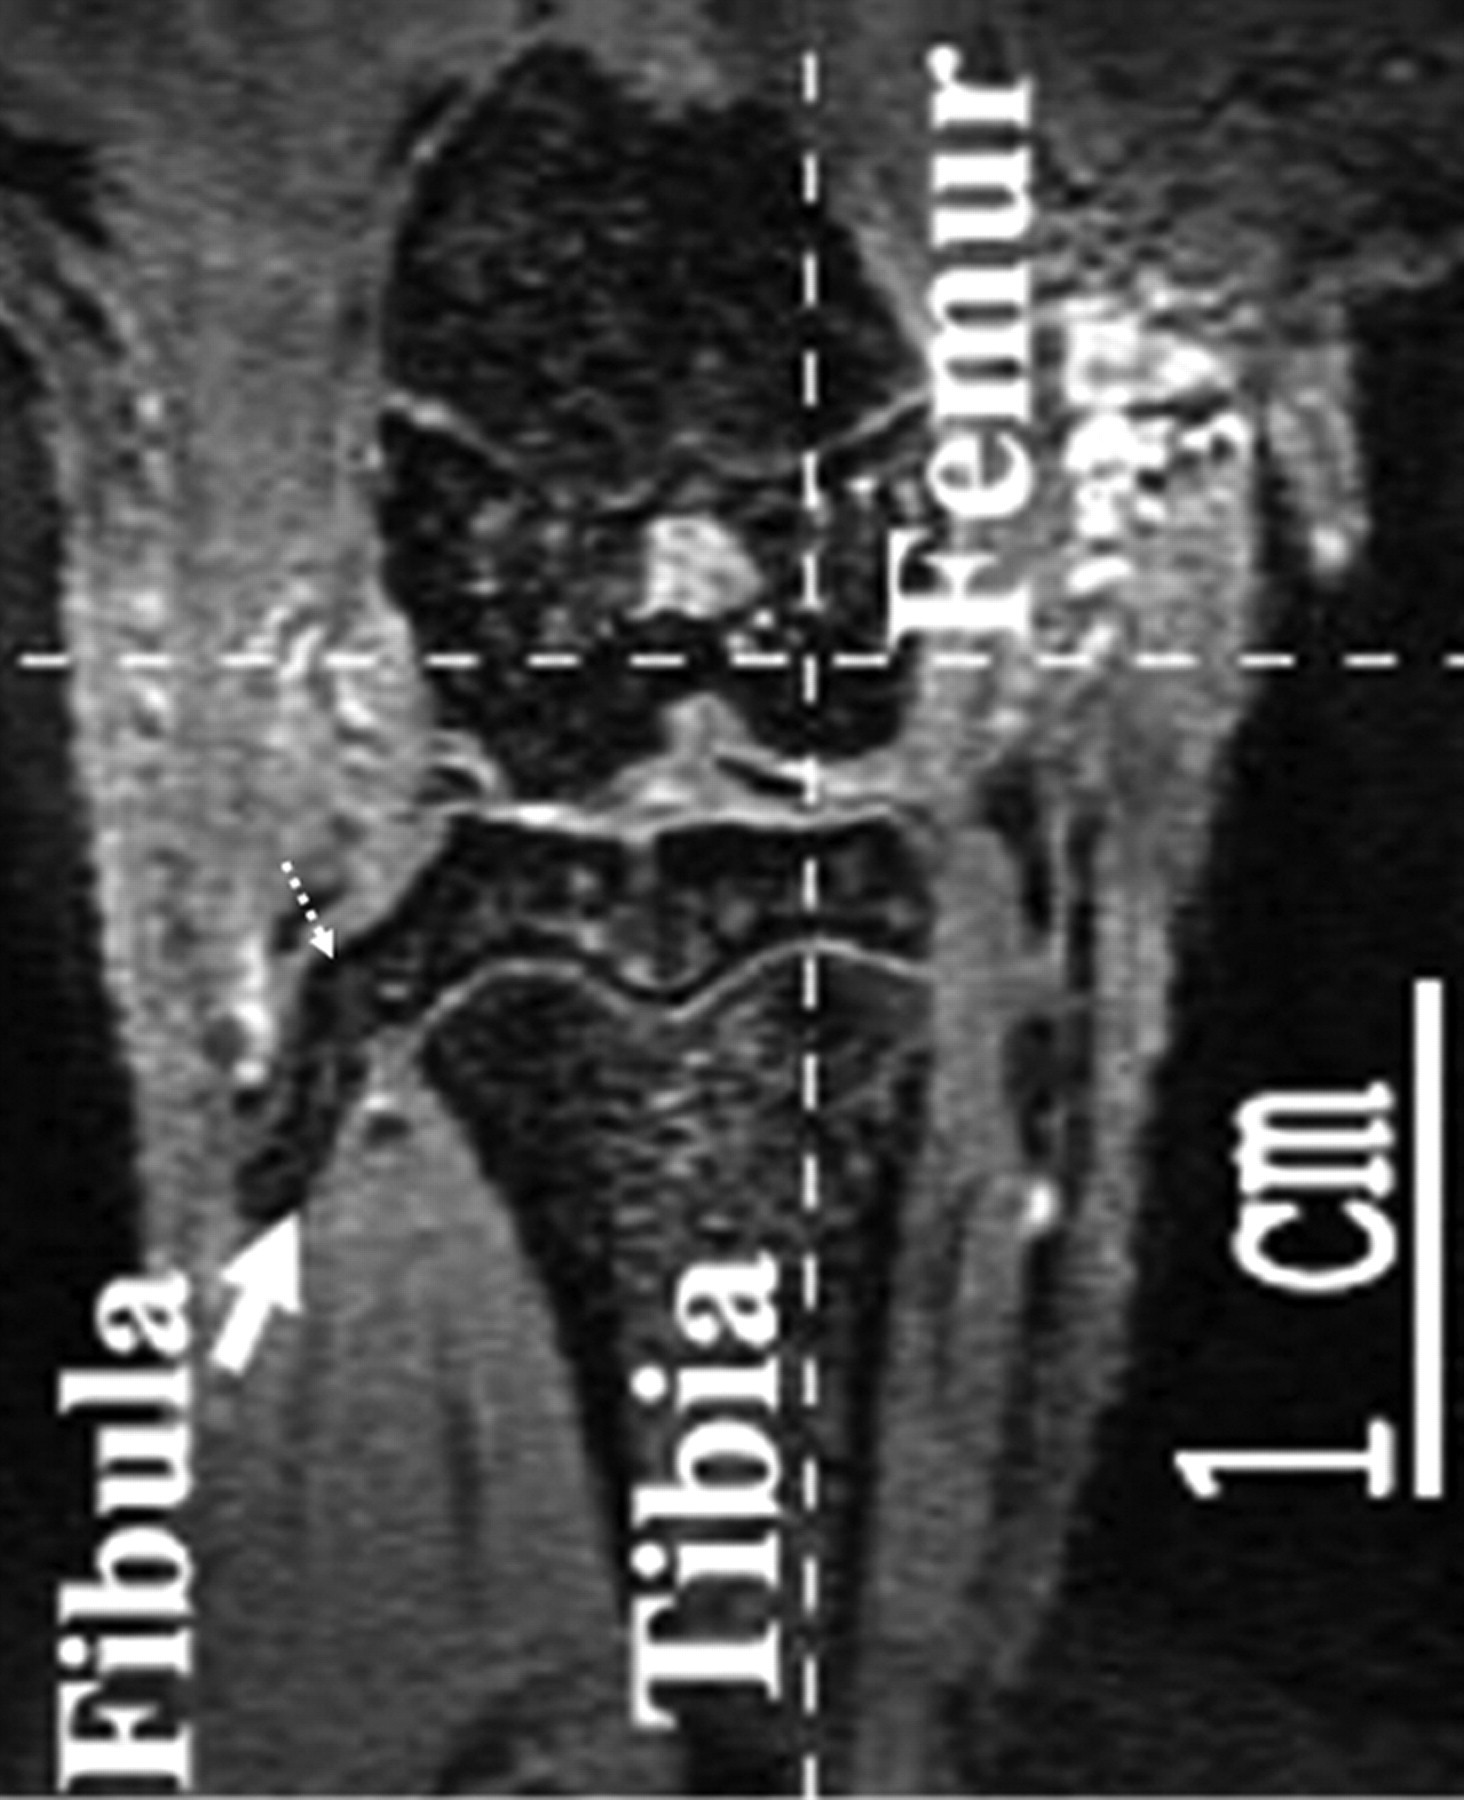
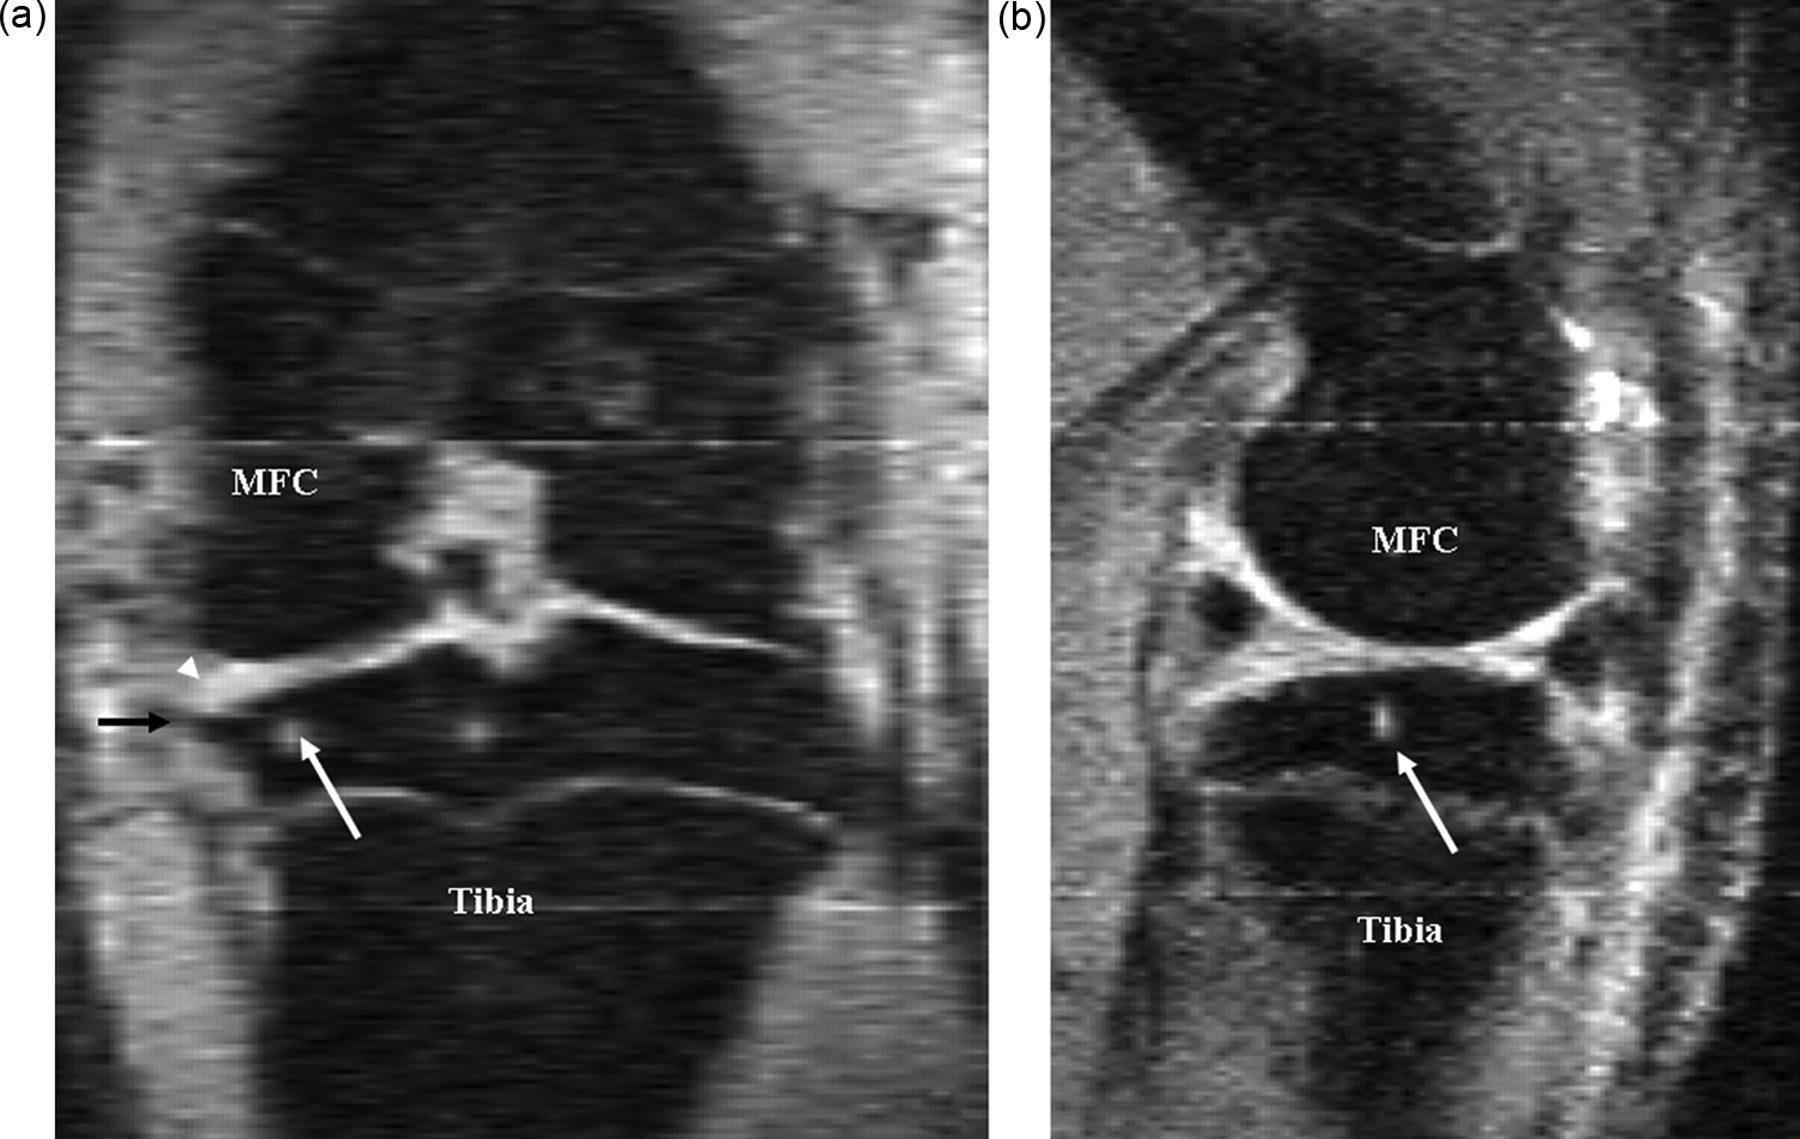
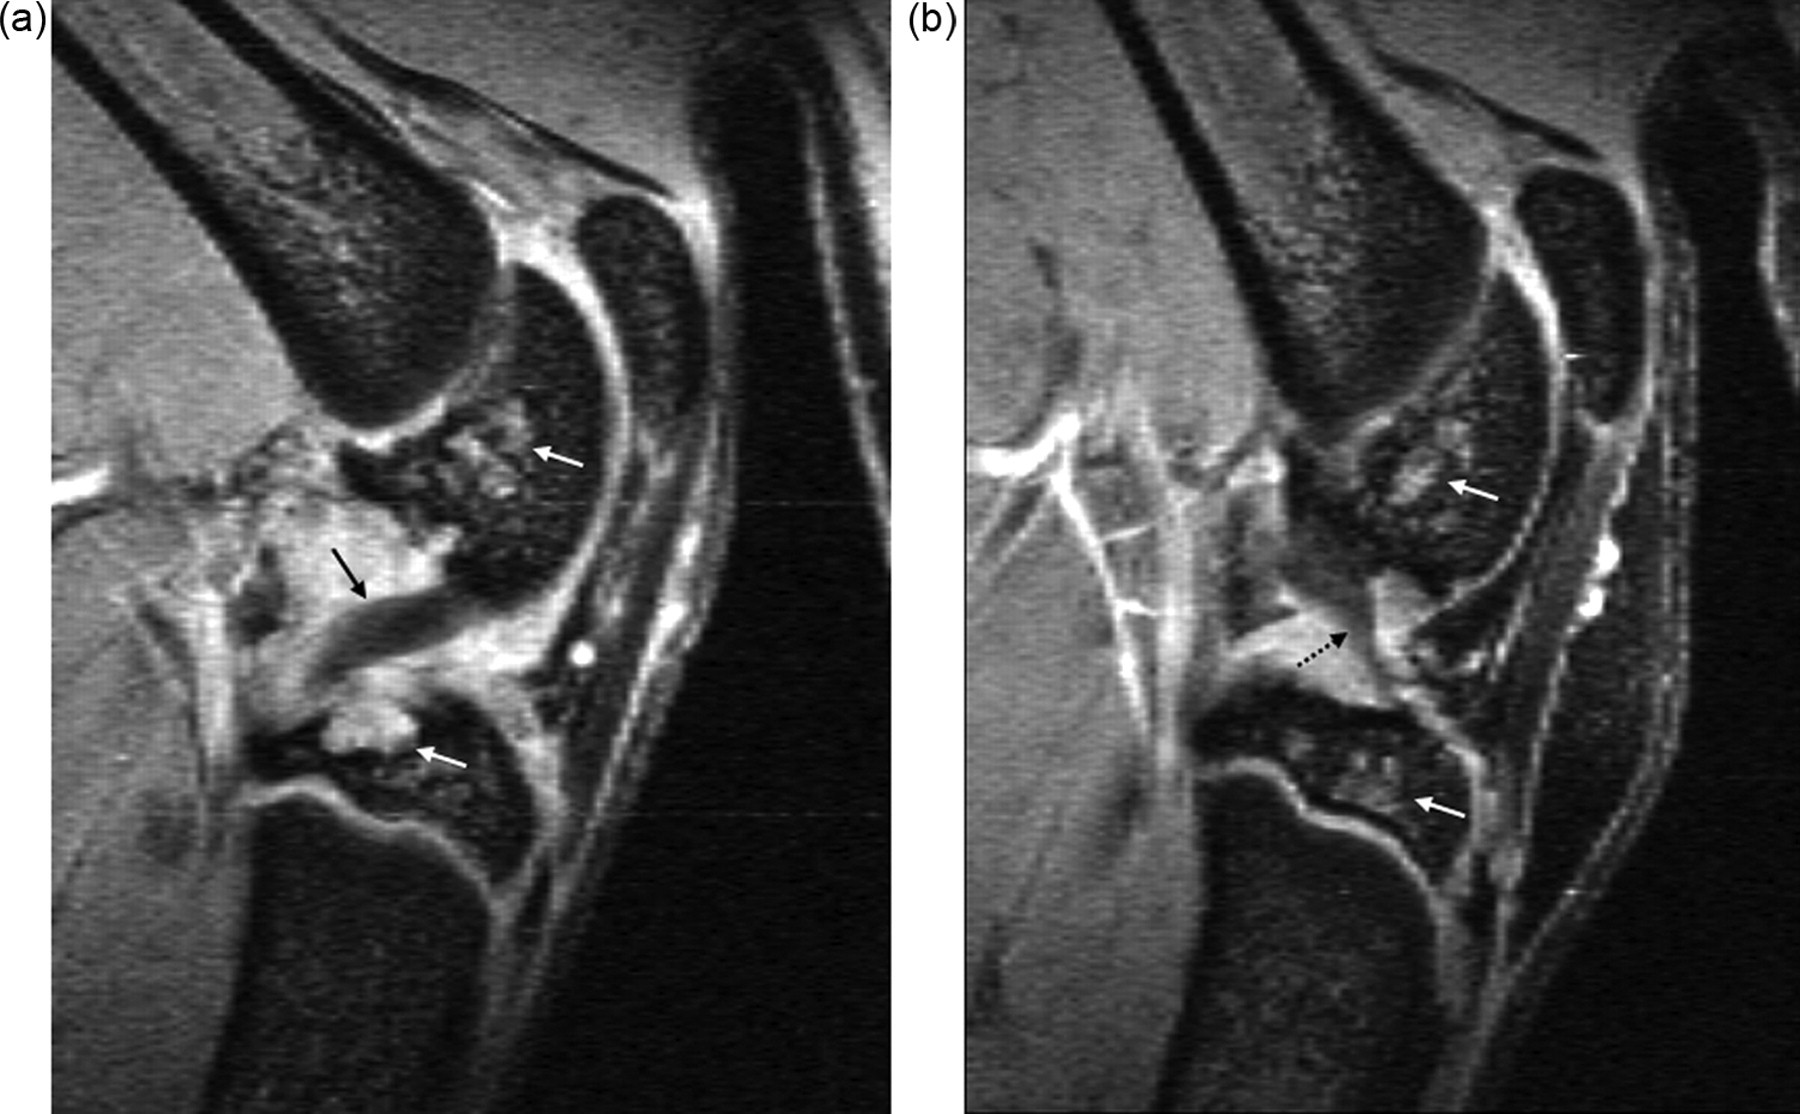
For accurate interpretation of MR images of a laboratory animal knee, it is important to understand the cross-sectional anatomy of the knee of the animal species in question, and also the relation between MR signal on various sequences and the underlying tissue histology and pathology. Although much can be learnt from human joint MR experiences, directly applying knowledge of human joint MR to interpret animal joint images can be problematic. For example, human knee menisci appear as a dark signal on conventional MR sequences, and increased signal within menisci indicates degeneration or tear. However, with small animals, such as guineapigs and rats, parts of a normal meniscus can appear as an intermediate to bright signal (Figures 7 and 8), a dark signal within meniscus may indicate ossification (Figure 7) (Tessier et al. 2003). Another example is that in the epiphysis of both femur and tibia, there are normal notches that could be interpreted as destruction or cysts (Figure 9). An additional example is that the lateral part of the tibia epiphysis in guineapig forms a bony prominence to connect with the fibula, and it might be mistaken as an osteophyte in some sections (Figure 10). By looking at the figures and descriptions, the current author believes that the image mis-interpretation exists in some published studies. Carefully reading baseline normal MR images is always a good way to understand MR anatomy of the animal species. Getting professional help from MR imaging radiologists or veterinary histopathologists can also be useful.
The following paragraphs describe various MR imaging features of knee OA.
Cartilage thickness and volume changes
Articular cartilage degeneration and loss are broadly accepted as being central to the pathophysiology of OA. Cartilage injury and degeneration are reported to be related to pain. Because of the avascular nature and small chondrocyte population in adults, the capacity of injured or degenerated cartilage to synthesize and secrete its extracellular matrix is poor. The healing response to cartilage injury and degeneration also decreases with age.
Cartilage thickness of OA is a dynamic process, involving an initial swelling phase, and later attrition and loss, defect phases. These phases have been demonstrated in experimental animal models by sequential MR imaging (Gahunia et al. 1995, Watson et al. 1996a, Tessier et al. 2003). Although cartilage represents a thin layer of material relative to the size of the voxels that are typically used for MR imaging, cartilage thickness and volume have been quantified at multiple points in animals as small as guineapigs and rabbits. Using a sagittal 2D multislice GE sequence, Calvo et al. (2001) found that cartilage thickness at the weight-bearing area of the medial femur of medial meniscectomized rabbits demonstrated a significant increase by four weeks, and this increment was progressive up to eight weeks post-surgery. A significant increment in tibial cartilage thickness was detected at week 6, and it was also located at the central region of the medial tibial plateau. Using a 3D GE sequence, Tessier et al. (2003) measured the medial tibial cartilage volume in a guineapig spontaneous OA model, and detected a 36% loss of volume between 9 and 12 months. For both cartilage thickness and volume measurement, the sagittal plane is preferred because the medial femoral condyle and the medial tibial plateau are more nearly flat in a medial–lateral direction than in a cranial–caudal one, so that partial volume errors are minimized. With small animals like rats, due to the small size of their knee joint, quantification of cartilage thickness is challenging, but has recently proved to be feasible. With a 7 Tesla MR scanner, Faure et al. (2003) reported that MR imaging could be used to detect arthritis and joint changes at a very early stage in living rats with rheumatoid arthritis. With a GE sequence, they noticed a reduction in the thickness of the knee joint cartilage with a loss of >20% by day 11. This was in contradiction to the histopathological findings where the cartilage appeared to be intact. However, both water and lipids are eliminated during the histological procedure, the reduction of the cartilage thickness on MR imaging is believed to be due to dehydration. This apparent ‘MR’ reduction in cartilage has also been found in the literature in other animal models (O'Byrne et al. 1993). The correlation between cartilage measurements made on MR imaging with those performed on anatomical sections remains unknown. However, for some applications consistent under or overestimation of the cartilage thickness would not be a serious problem because it would still allow longitudinal changes in the same joint to be quantified.
Semi-quantitatively, cartilage lesions are commonly graded as <50% depth, >50% depth and full thickness cartilage lesions based on the subjective evaluations by one or more experienced readers.
Cartilage regeneration can also be evaluated with MR imaging. In one study, three years after transection of the anterior cruciate ligament in the dog knee, at which time all experimented animals exhibited knee instability, MR imaging demonstrated that the cartilage at the surgery side was thicker than that in the contralateral knee. This increase in thickness is consistent with histology data that showed increase in cartilage bulk and in PG synthesis and concentration. The findings suggested that increased matrix synthesis after anterior cruciate ligament transection leads to functional cartilage repair sustained even in the presence of persistent alteration of joint mechanics (Braunstein et al. 1990). With a rat meniscus transection OA model 44 days post-surgery, MR imaging was able to demonstrate qualitatively the decrease of cartilage thickness and loss of cartilage in some areas, and focal neo-cartilage proliferation at the joint margin (Wang et al. 2006c).
It should be noted that thickness of hyaline cartilage can vary at different locations of the joint according to loading characteristics and matrix components (Rasanen & Messner 1996). For example, the cartilage of the rabbit knee joint is both thicker and stiffer at the central and posterior areas of the femoral condyle than the anterior area. These regional variations are related to the specific anatomical construction and behaviour of the animal, suggesting that the posterior femoral condyle might be loaded more than the anterior one because, under normal conditions, the rabbit stands and walks with the knee flexed. These anatomical points should be kept in mind during image interpretation.
Cartilage biophysical property changes
Measurement of MR relaxation time T2 and T1ρ has the potential to detect early cartilage degeneration. Degeneration changes have been shown to lead to increases in T2 in human articular cartilage (Dardzinski et al. 1997). Spandonis et al. (2004) measured the weight-bearing cartilage areas on the meniscectomized condyles in rats and they found a significant increase of cartilage T2 relaxation time. Mosher et al. (2000) examined the spatial variation of in vivo T2 in symptomatic and asymptomatic human articular cartilage and concluded that T2 relaxation times are substantially elevated in OA subjects compared with healthy subjects. Regatte et al. (2006) reported that there was a linear elevation of T1ρ as a function of different grades of OA, and a higher percent elevation in T1ρ relaxation times for a given degenerative change compared with T2, therefore, T1ρ is more sensitive than T2 in detecting cartilage degeneration.
However, though T2 and T1ρ are sensitive to changes in cartilage, they are not specific to any one inherent tissue parameter (Menezes et al. 2004). T2 value is influenced by various factors, such as background inhomogeneities, susceptibility variations, diffusion-induced signal losses, orientation dependence and differences in measurement protocols. The sensitivity of T2 to many factors makes its interpretation challenging. Similarly as described above for T2, the potentially competing effects of molecular structure and concentration might make interpretation of T1ρ difficult. Further studies are needed to further explore the clinical values of these parameters.
Several reports have demonstrated findings relating delayed Gd(DTPA)2− enhanced MR imaging to physiological and pathological processes of OA (Eckstein et al. 2006). Laurent et al. (2003) reported results where rabbits were assessed both for collagen integrity and PG content by using MT and delayed Gd(DTPA)2− enhanced imaging. They found a 22% decrease in the MT exchange rate along with a two-fold greater Gd(DTPA)2− induced decrease in T1 relaxation time in response to papain injection into the rabbit knee joint one day prior to the MR imaging session. This indicated an alteration of collagen integrity and PG depletion, respectively. The changes in the MT ratio were considered to be caused mainly by structural changes of the collagen matrix, rather than by changes in its concentration. In goat knees two weeks after the surgery of medial meniscal transection and cartilage incision, early signs of cartilage degeneration were detected in vivo by MT and delayed Gd(DTPA)2− enhanced MR imaging in the absence of obvious macroscopic changes on MR images (Laurent et al. 2006).
Subchondral bone abnormalities
There are suggestions that primary OA could initially be a bone disease rather than a cartilage disease. With a surgically-induced rat OA model, Hayami et al. (2006) showed the development of OA starts with an initial phase of subchondral bone loss followed by a second phase of subchondral bone increase. Increased subchondral bone resorption is associated with early development of cartilage lesions, which precedes significant cartilage thinning and subchondral bone sclerosis. With a spontaneous guineapig OA model, Anderson-MacKenzie et al. (2005) also found that prior to any gross OA pathology the animals undergo subchondral bone remodelling. These studies demonstrate the potential, additional role of bone structure in the pathophysiology of OA.
Bone structures are best shown with high-resolution CT. However, MR imaging can also provide valuable information of bone structures, and has the advantage of not involving radiation. New sequences such as ultra-short TE, which is designed to show calcified bone structures in bright signal, are a promising tool for studying joint bones (Robson et al. 2003). With common MR sequences without FS, normal bone cortex appears hypointensive; bone marrow appears hyperintense; and cancerous bone shows speckled pattern.
With osteosclerosis, MR image shows an increase in trabecular width, and an increase of thickness of the subchondral bone plates of the tibia and femur. With osteopenia, MR image shows trabecular thinning and increase in trabecular interval space. Quantitatively, it is possible to compute trabecular number, mean trabecular size, and volume fraction (percentage of trabecular bone versus total volume). Further bone changes include punched-out lesions in metaphysis and epiphysis; and at later stage flattening or depression of the articular surfaces, and bone cysts. Subarticular cysts are identified as foci of markedly increased signal in the subarticular bone with sharply defined, rounded margins and no evidence of internal marrow tissue or trabecular bone. It has often been suggested that subchondral pseudocysts arise from intrusion of synovial fluid under pressure through fractures of the subchondral bone plate. Appreciable fractures of the subchondral bone plate, often appearing to communicate with the body of a pseudocyst, can be seen and this is often associated, in the region of the fracture, with marked subchondral sclerosis and remodelling of the articular contour.
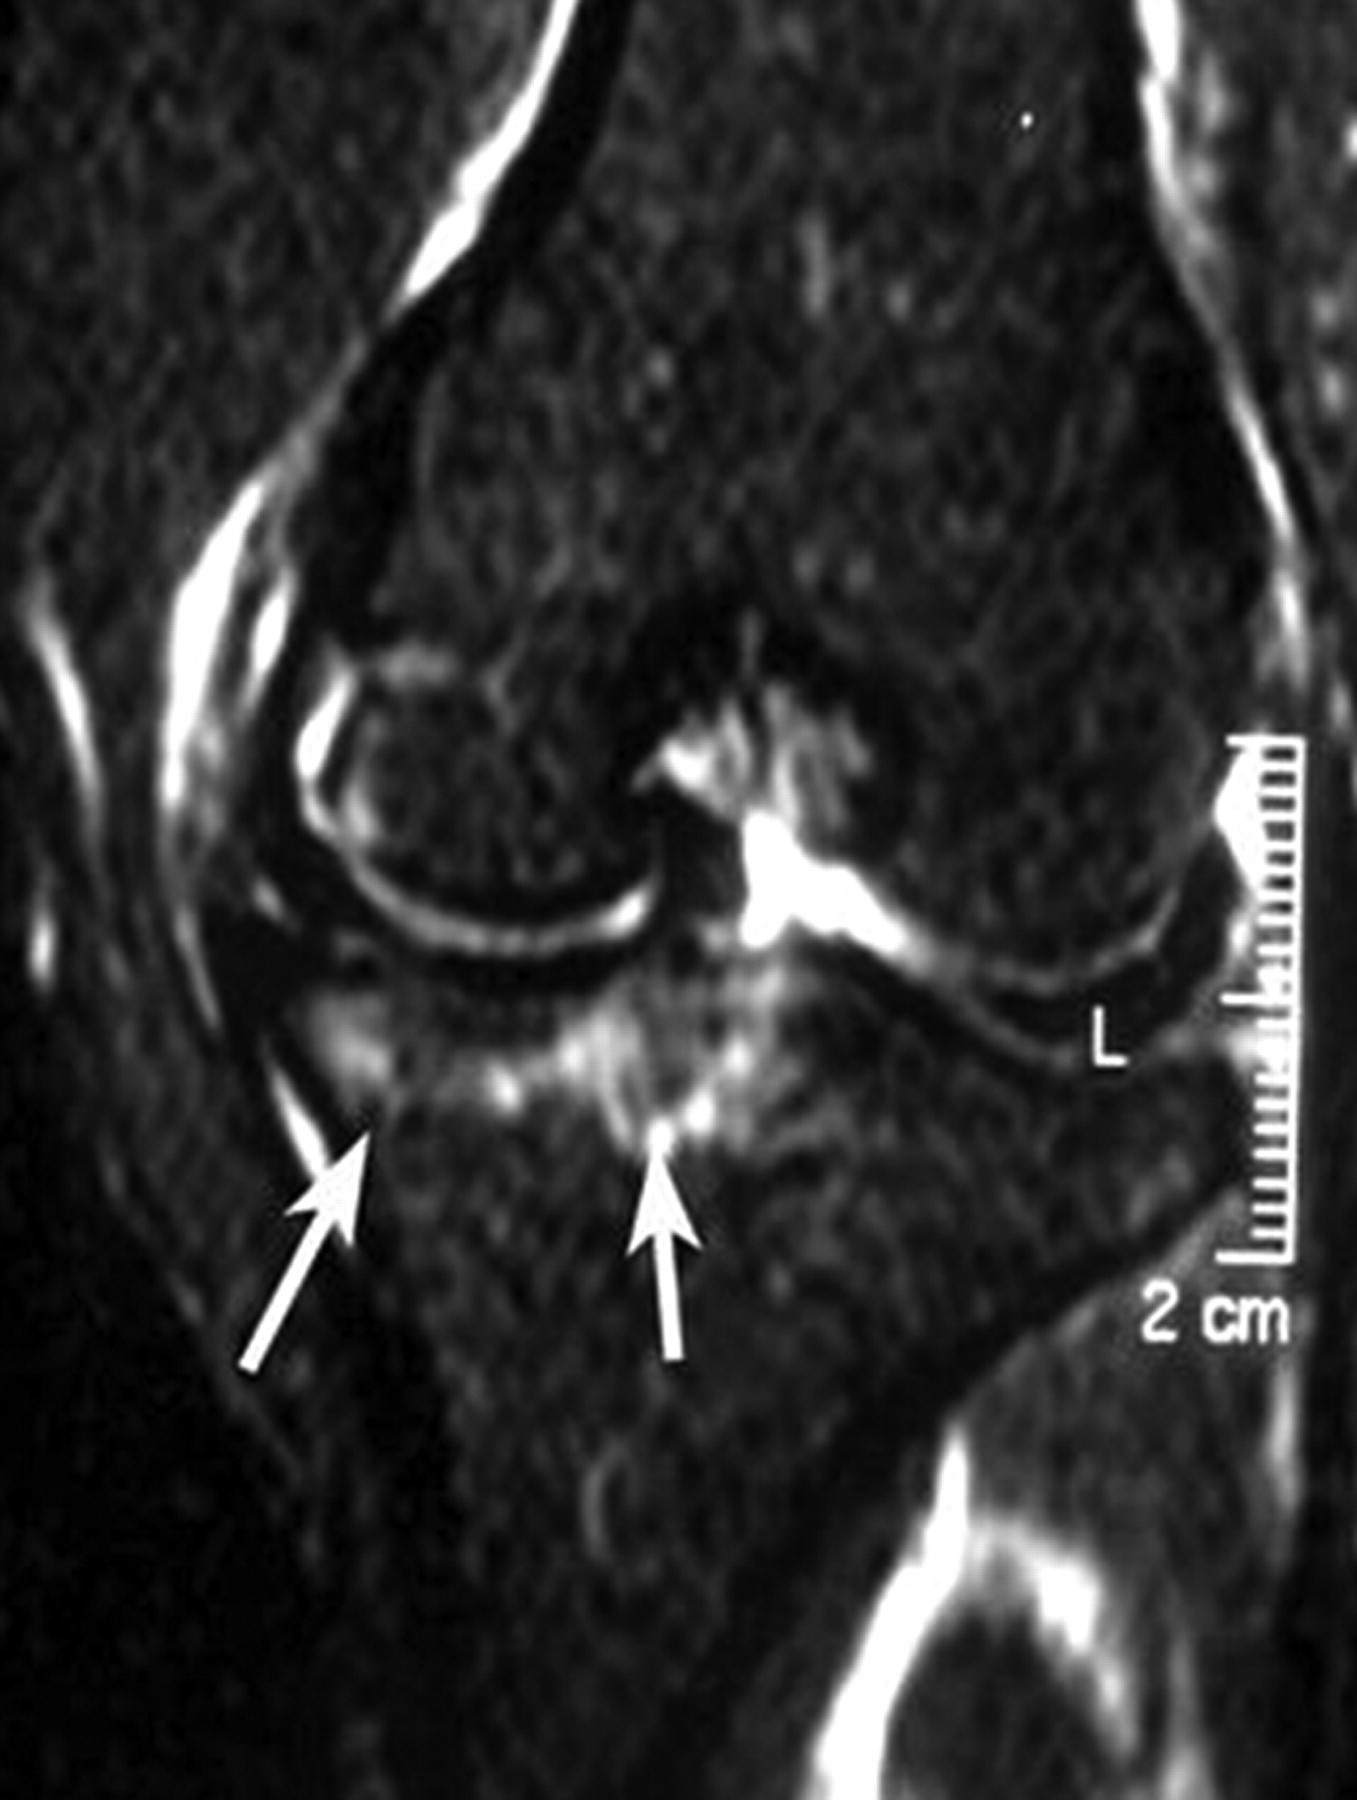
In a meniscus transection rat OA model 44 days post-surgery, it has been reported that damage to the tibia subchondral bone included local osteosclerosis and deformed tibia cortex surface. Osteophytes occurred on the medial joint margin of the tibia plateau. And high intensity areas consistent with cyst signal were seen within the epiphysis of tibia (Figure 11, Wang et al. 2006c).
When studying subchondral bone, it is desirable to have a ‘normal control’ population in order to separate the effects of normal maturation from pathological lesions.
Bone marrow abnormality
Subarticular bone marrow abnormality is defined as poorly marginated areas of increased signal intensity in the normally fatty epiphyseal marrow on FS images. Human data have shown that the presence of this finding in OA is strongly associated with pain, especially when cartilage loss is severe (Felson et al. 2001), and these changes are highly predictive of subsequent ipsilateral cartilage loss in the knee, and that their presence identifies knees at risk of progression (Felson et al. 2003). Bone marrow abnormality has been seen to change quite rapidly, sometimes in a matter of only months. Because of the resemblance of this feature to changes commonly seen in trauma and inflammation, it has often been referred to as ‘bone marrow oedema’. However, it has been reported that oedema per se was not actually a prevalent constituent of this MR feature (Zanetti et al. 2000). Whether this feature in OA reflects microtrauma, and whether interventions that decrease its extent also diminish pain and structural progression is not known.
So far the literature reports on bone marrow abnormalities have been mainly from human data, though this finding has also been reported in OA models of large animals such as the dog (Figure 12) (Libicher et al. 2005). In the current author's own experience, typical bone marrow abnormalitities are rarely seen in small animal OA models. The reason is still unknown to the author. One possibility is that because of susceptibility artefacts, homogenous fat suppression is actually rather difficult in small animal joint bones.
Osteophytes
Osteophyte is one of the main structural manifestations of OA. MR imaging can delineate osteophytes more reproducibly than radiography, and detect osteophytes in locations that would otherwise be obscured by projectional superimposition on conventional radiographs.
Serial MR imaging can be used to monitor the development of osteophytosis. In coronal images, the onset of osteophyte growth starts with a characteristic ‘lipping’ of the articular cartilage (Figure 11). For quantification, growth of the tibial osteophyte can be measured by observing the increase in length of the medial tibial plateau in coronal sections (Watson et al. 1996b).
Meniscal pathologies
Studies on human subjects have shown that meniscectomy leads to knee articular cartilage loss and is associated with long-term symptoms and functional limitation. One study by Kawahara et al. (2001) reported that abnormal movement of the meniscus on dynamic MR imaging correlated with the severity of cartilage damage in the knee. Peterfy et al. (2004) reported strongest association among cartilage pathologies, osteophyte and meniscal pathologies. In animal studies, meniscus transection or meniscectomy have been used to induce OA (Bendele et al. 1999).
MR imaging is the method of choice for evaluating meniscal pathology. MR imaging can clearly demonstrate the meniscus in small laboratory animals (Tessier et al. 2003, Wang et al. 2006a). In a rat OA model induced by intraarticular injection of mono-iodoacetate, it has been reported that meniscus morphological damage can be demonstrated (Wang et al. 2005). With a meniscus transection rat OA model where load perturbation was induced in the weight-bearing region of articular cartilage, it has been reported that medial meniscus transection was clearly visible on MR images post-surgery, the anterior half of the meniscus retracted anteriorly and the posterior half retracted posteriorly (Wang et al. 2006c).
Synovitis and joint effusions
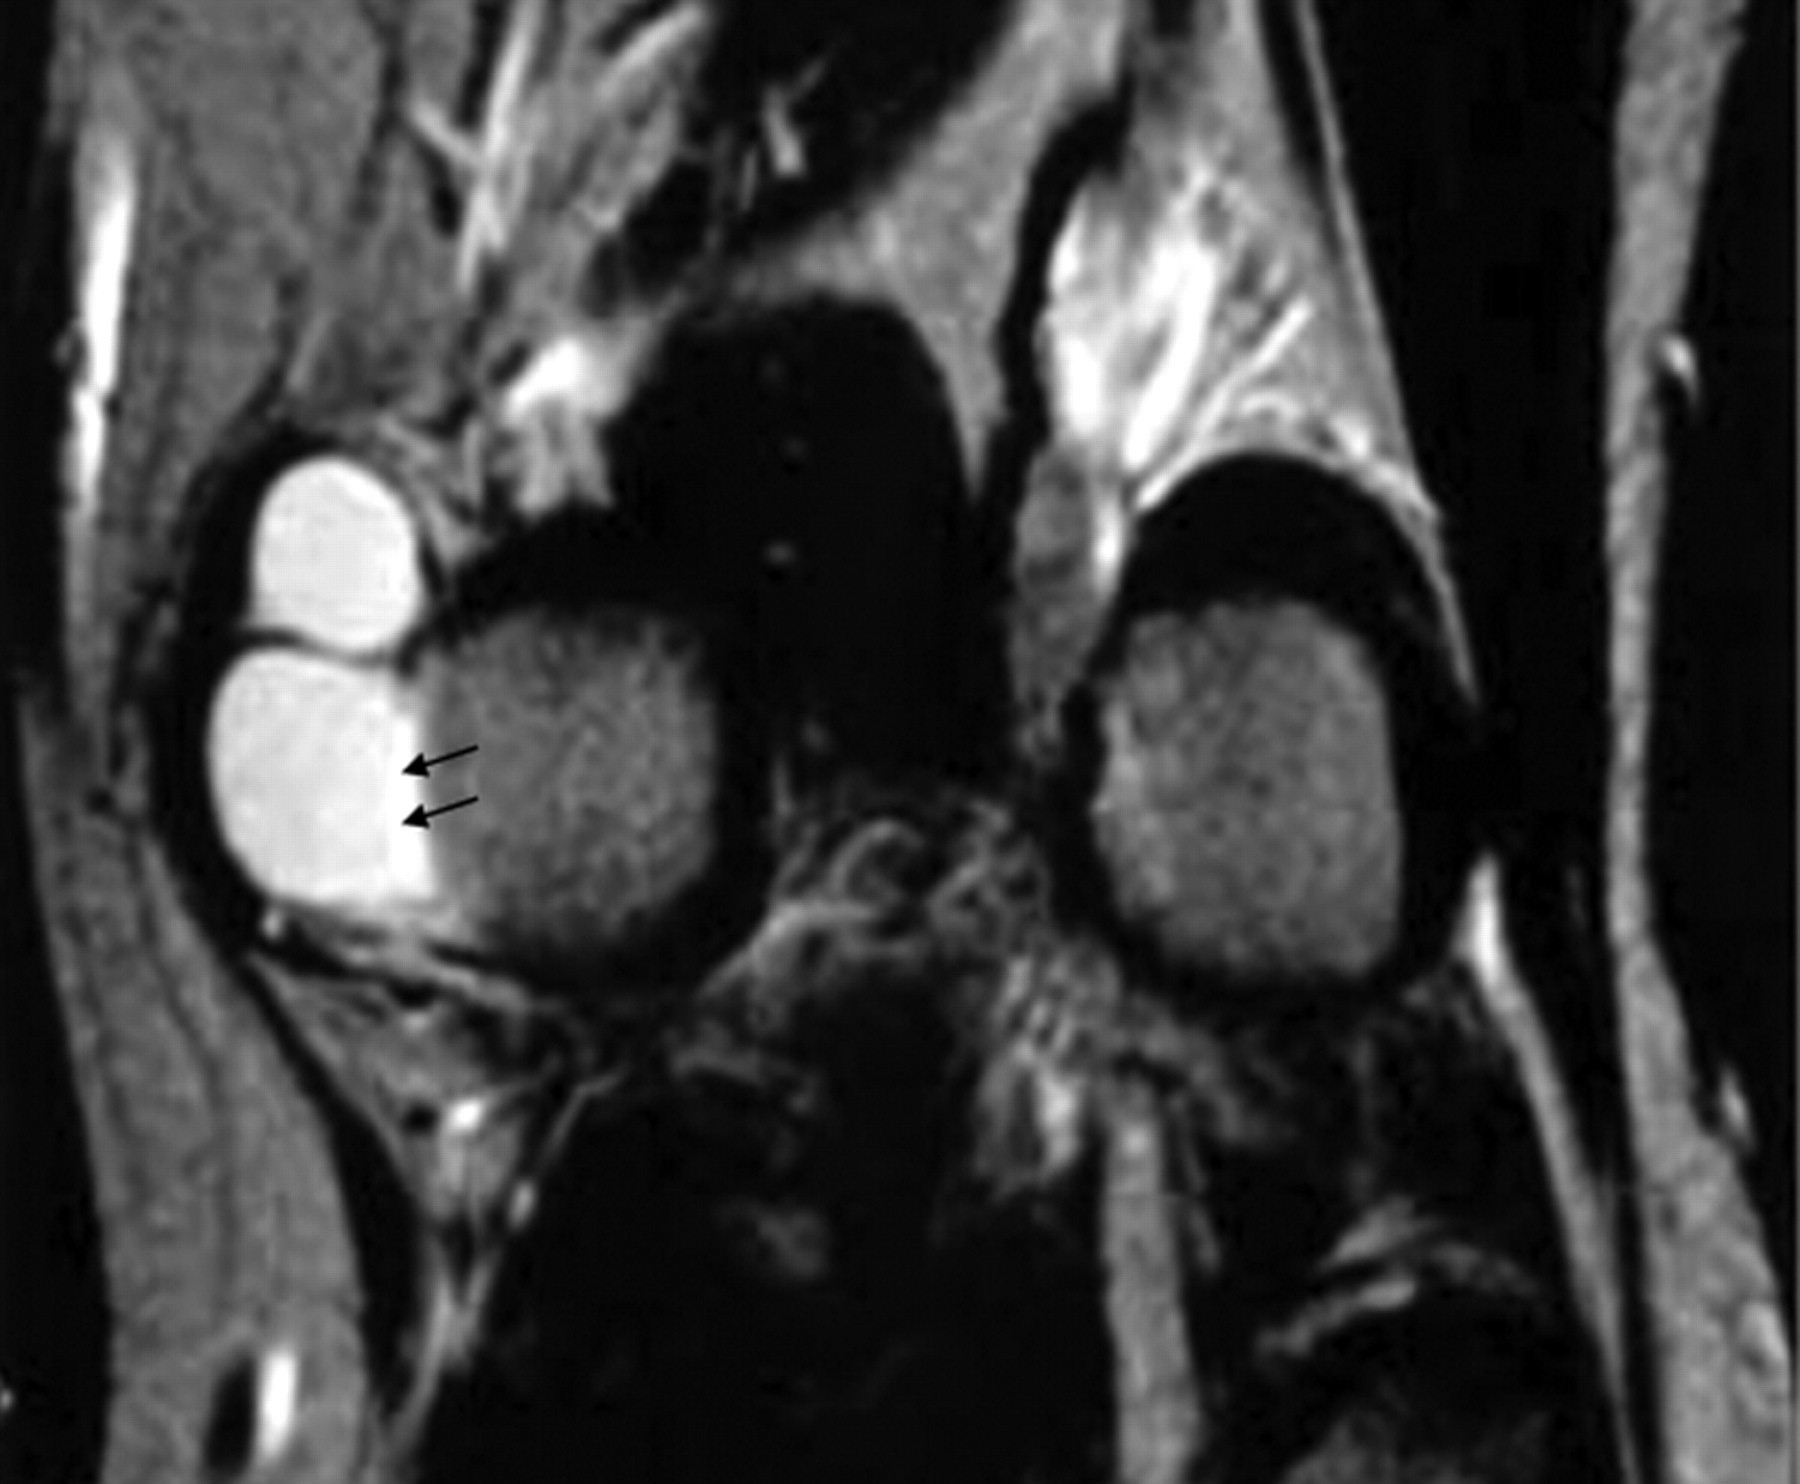
In a human data series, some degree of synovial thickening was found in a majority of osteoarthritic joints (Fernandez-Madrid et al. 1995). Whether this synovitis contributes directly to articular cartilage loss in OA, or simply arises in reaction to the breakdown of cartilage, remains unclear. However, synovitis may be important to the symptoms and disability of OA. With synovitis MR imaging can detect increased thickness of synovium membrane. After Gd-DTPA injection these inflamed synovium membranes show increased enhancement (Ostergaard et al. 1998). Fluid effusion appears as a high signal on proton density and T2-weighted MR images. When joint effusion is substantial, intraarticular joint space can increase (Figure 13).
Ligament insufficiency
Ligament insufficiency of cruciate ligament and/or collateral ligament is believed to be an important driver for meniscal tear, cartilage loss and OA. Surgical transection of these ligaments has been used to induce OA in animals. MR imaging has long been the method of choice for assessing the cruciate and collateral ligaments of the knee. These structures can be clearly demonstrated on rodent knee joint MR images (Figure 14) (Wang et al. 2006a).
Other findings
Other findings associated with OA such as patellar tendon or quadriceps tendon abnormalities, avascular necrosis, focal osteochondral fracture, surgery-induced changes and tissue scars can be assessed with MR imaging. Interarticular joint space narrowing or widening, and femur–tibia axis misalignment can also be demonstrated. In a medial meniscus transection rat OA model, interarticular space widening on the medial side and femur–tibia axis misalignment have been seen with MR imaging (Figure 11) (Wang et al. 2006c). When making these judgements, it is important to make sure that these changes are not caused by the mis-positioning of the joint during MR scanning.
Treatment monitoring
MR imaging has been used to study the efficacy of new treatment in a rheumatoid arthritis model (Bradbeer et al. 1996, Badger, et al. 2001). Recently, MR has also been used to study the chondro-protective effects of some new compounds. By measuring the volume of medial tibia cartilage in a guineapig spontaneous OA model, MR imaging demonstrated that doxycycline treatment halved the cartilage loss as compared with the vehicle treatment (Tessier et al. 2006).
In conclusion, MR imaging can detect a wide spectrum of both early and later joint changes caused by OA. Owing to its unique facility of being able to track the disease progress and regress after intervention non-invasively in the same animal, with further development in hardware, sequences and imaging processing techniques, MR imaging can play an increasingly important role in OA research.