
Abstract
Accumulating evidence indicates that tumour growth is angiogenesis-dependent. Non-invasive assessment of the relationship between tumour growth and associated angiogenesis is essential for diagnosis and for therapeutic interventions. We utilized a combination of high-resolution T2-weighted and dynamic contrast-enhanced magnetic resonance imaging to investigate the dynamics of angiogenesis during tumour growth in a mouse tumour model expressing Epstein-Barr virus-encoded latent membrane protein 1 isolated from a nasopharyngeal carcinoma in Taiwan. Serial imaging acquisitions were performed starting on the third day after subcutaneous implantation of tumours, through day 28. We observed a progressive increase in tumour volume until day 14, followed by rapid and exponential growth. The volume transfer constant, K trans, also increased significantly on day 14, and then gradually decreased, suggesting that the angiogenic switching occurs prior to significant tumour growth. At the initial stage, the K trans values were significantly higher in the tumour peripheral region than in the tumour core, but, during tumour growth, the K trans values in the region between the tumour periphery and core gradually increased, becoming larger than those of the periphery. These results demonstrate that the ability to perform repeated measurements assessing the correlation between tumour growth kinetics and tumour angiogenesis makes it possible to determine the critical time of angiogenic switching prior to rapid tumour growth, as well as suggesting the timing of therapy.
Angiogenesis is necessary for tumour growth, 1,2 and accumulating evidence suggests that the onset of angiogenesis can occur at any stage of tumour progression. 3 Since increased tumour volume is dependent on angiogenesis, the vascular supply of tumours has been targeted in clinical trials. However, the correlation between angiogenesis and tumour growth, and the temporal and spatial heterogeneity of the intratumour microenvironment, remain obscure. In vivo monitoring of the dynamics of angiogenesis throughout tumour growth in animal models may help to develop new antiangiogenic strategies.
Conventional studies of the relationship between tumour growth and angiogenesis primarily depend on measurements of one or two points of the multistep process. These findings can be greatly expanded through the use of non-invasive, in vivo imaging modalities, such as magnetic resonance imaging (MRI), which can be utilized repeatedly to provide morphologic, functional and molecular information. Anatomic MRI can non-invasively determine the temporal changes in tumour development and reveal the spatial heterogeneity within tumours at different stages of growth in human and animal models. 4,5 Dynamic contrast-enhanced MRI (DCE-MRI), in which MR images are serially acquired before, during and after the administration of an intravenous contrast agent (CA), has been shown to be effective for serially assessing tissue perfusion and angiogenic tumour vasculature. 6–8 The rate of enhancement, as reflected by the steepness of CA uptake and washout, is generally analysed by pharmacokinetic models. 9,10 In the most widely accepted of these models, the volume transfer constant (K trans) for the passage of CA from the vessel into the extravascular extracellular space is measured. 11 K trans is influenced by blood volume and flow and the permeability surface (PS) area product, thus providing extensive information regarding the angiogenic properties of tumours. 12
Epstein-Barr virus (EBV) is a ubiquitous human herpes virus. The expression of EBV-encoded oncogene latent membrane protein 1 (EBV-LMP1) has been associated with several human malignancies, including endemic nasopharyngeal carcinoma (NPC). 13–16 We recently developed a mouse tumour model, in which EBV-encoded LMP1 isolated from an NPC in Taiwan (EBV-N-LMP1) 17 is expressed in the immunocompetent host. To enhance our understanding of the relationship between tumour growth and angiogenesis, we non-invasively investigated this correlation in the EBV-N-LMP1 tumour model using T2-weighted MRI and DCE-MRI.
Materials and methods
Animals and housing conditions
All animal experiments were approved by the Academia Sinica Institute animal care and utilization committee. Severe combined immunodeficiency (SCID) mice (male, 4–5 weeks old) were obtained from the National Taiwan University Laboratory Animal Center (Taipei, Taiwan) and BALB/c Byj mice (male, 4–6 weeks old) were obtained from the National Laboratory Animal Breeding and Research Center (Taipei, Taiwan). All animals were housed in standard transparent polycarbonate cages (29.5 cm × 19 cm × 13 cm, Taiwan) with a wire mesh top in groups of five animals at the animal care facility of the Institute of Biomedical Sciences, Academia Sinica. The bedding lined with shavings (Lignocel, JRS, Rosenberg, Germany) was renewed once a week. Food pellets (5001, PMI, St Louis, MO, USA) and reverse osmosis (RO) water were provided ad libitum. The light/dark conditions were 12:12 h and the light period lasted from 08:00 h to 20:00 h. Relative humidity varied between 40% and 60%, and the environmental temperature was maintained between 19°C and 23°C. All tumour-bearing animals were sacrificed according to the UK Co-ordinating Committee on Cancer Research guidelines for the welfare of animals in experimental neoplasia.
Tumour mouse model
E2-plus, a BALB/c-3T3 cell line expressing LMP1 (clone 1510), was established and maintained in DMEM (Invitrogen GIBCO BRL, Grand Island, NY, USA) supplemented with 10% heat-inactivated fetal bovine serum (FBS) (Hyclone Laboratories, Logan, UT, USA), 2 mmol/L L-glutamine (GIBCO BRL), 10 U/mL of penicillin (Sigma-Aldrich, St Louis, MO, USA), 10 μg/mL of streptomycin and 0.5–0.6 mg/mL of geneticin (G418, Sigma-Aldrich) at 37°C in 5% CO2. E2-plus cells (106) were subcutaneously injected into male SCID mice. When the tumours attained a volume of 1 cm3, mice were euthanized in a CO2 chamber and the tumours were surgically removed, cut into small pieces of about 9 mm3 per piece and transplanted into the left flanks of normal male BALB/c mice. Tumour grafting among normal BALB/c mice was routinely performed every 4–6 weeks to maintain the tumours in vivo.
Magnetic resonance imaging
MRI experiments were performed on a horizontal 7.0 T Pharma Scan 70/16 spectrometer equipped with an active shielding gradient (30 G/cm in 150 μs) operating on a paravision (version 3.0.1) software platform (Bruker, Ettlingen, Germany). Imaging was performed starting on days 3, 5, 7, 9, 11, 14, 17, 21 and 28 after tumour implantation. Mice were anaesthetized with an initial dose of 5% isoflurane and 5 L/min O2 for 3 min and placed in a custom-designed body-holder and fixed in the supine position, and anaesthesia was maintained throughout using 0.5–1.5% isoflurane and 1 L/min O2. For CA administration during DCE-MRI, a polyethylene tube (PE 10, Becton Dickinson) connected to a 30 G needle at one end and to a 0.5 mL syringe with CA at the other end was carefully inserted below the eye-ball of each mouse. Hot air was used to maintain body temperature around 37°C. A 38 mm birdcage coil was used for radiofrequency excitation and signal reception, and no triggering was used for data acquisition.
To locate the position of each tumour and to acquire data sufficient for measuring the entire tumour volume, sagittal T1-weighted spin-echo images were obtained, with a repetition time (TR) of 500 ms, echo time (TE) of 10.4 ms, field of view (FOV) of 3 cm, number of repetitions (NEX) of 2, slice thickness of 1 mm, interslice distance of 1.5 mm and matrix size of 256 × 128. To generate T2 maps and determine tumour volume, multislice multiecho (MSME) axial images were acquired using standard spin-echo sequences with a TR of 5000 ms, TEs of 10.4, 20.8, 31.2, 41.6, 52 and 62.4, FOV of 3 cm, NEX of 2, matrix size of 256 × 256 and slice thickness of 0.5 mm, with no interslice gaps. Precontrast T1-maps were acquired by inversion-recovery-fast imaging with steady state precession sequence (IR-true-FISP) with a TR of 4 ms, TE of 1.8 ms, FOV of 3 cm, slice thickness of 1.5 mm, NEX of 1, flip angle of 60°, matrix size of 128 × 128 and 18 inversion times, ranging from 62 to 2510 ms. DCE-MRI was performed using a T1-weighted spin-echo sequence with a TR of 400 ms, TE of 10.4 ms, FOV of 3 cm, slice thickness of 1.5 mm, NEX of 1 and matrix size of 256 × 64. A series of 40 axial images were acquired, i.e. before, during and after the intravenous injection of the CA gadopentic acid (Gd-DTPA, 0.2 mmol/kg, Berlex, USA).
Data analysis
Quantification of tumour volume and determination of tumour volumetric doubling time
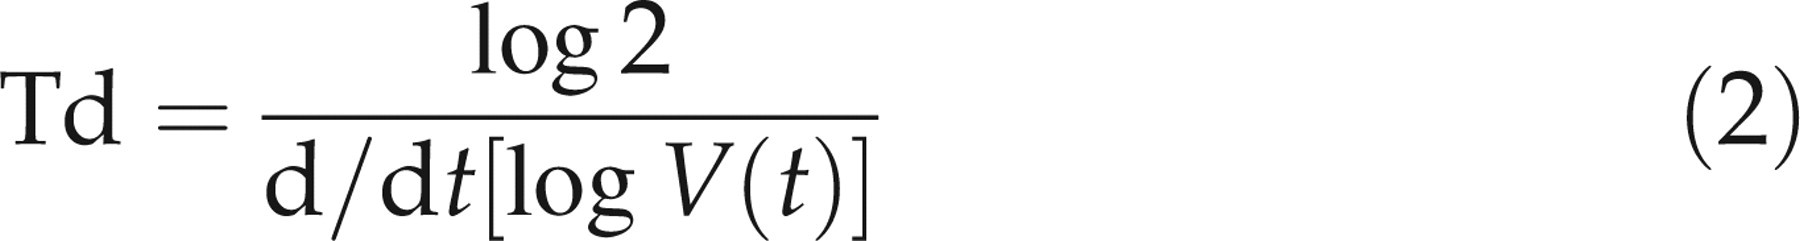
The total volume of tumour was obtained from the multislice axial T2-weighted images. On each tumour slice, the region of interest (ROI) was manually outlined, and the total tumour volume was calculated as the sum of all ROIs from each individual slice. All images were processed using the manual trace tool and edge editing function provided by the software ANALYZE (Biomedical Imaging Resource, Rochester, MN, USA). The resulting volumes were plotted against time from implantation to obtain the growth curves. The tumour growth rate was quantified as volumetric doubling time (Td), based on the classic model of tumour growth
18

Measurement of the volume transfer constant, K trans, between the plasma and the extravascular extracellular space
The kinetic analysis of dynamic Gd-DTPA signal enhancement was based on the compartment model of Tofts and Kermode.
11
In this analysis, the rate of CA uptake, dC
t(t)/dt, can be determined by the product of the permeability (P) and surface area (S), the tracer concentration in arterial blood plasma (C
p), the tracer concentration in tissue (C
t) and the leakage space per unit volume of tissue (ν
e), according to the following equation

All data were processed using a commercially available image analysis package (MRVision, MRVision Co, Menlo Park, CA, USA) designed specifically to handle MRI data. The processing software for quantitative analysis of the dynamic curve was written in Matlab (MathWorks, Natick, MA, USA). Colour maps of K trans and T2 were produced using Amira (TGS, San Diego, CA, USA). The ROIs were manually selected from K trans maps to obtain spatially averaged K trans values.
Statistical analysis
Data are presented as mean values ± standard deviation. Paired Student's t-test was used to compare the K trans and T2 values at different time points or locations. P < 0.05 was considered statistically significant.
Results
Growth characteristics and Td
T2-weighted images were used to determine the volumes of individual tumours, starting on the third day after implantation, and continuing through day 28 (Figure 1a). Although the individual tumours showed extensive variability in size, the exponential growth pattern of the volume-time curve was similar for all mice (Figure 1b). Tumours began by growing slowly, but after day 11, all tumours showed an exponential increase in size, becoming maximal on day 28. The Tds, obtained from the slope of the log of total volume versus days after tumour implantation (Equation 2), ranged from 3.42 days to 5.17 days, with an average of 4.19 ± 0.73 days. The growth ratios of tumours (Figure 2), progressively elevated from day 3 to day 11, significantly increased on day 14 and day 28. The results indicate that the time from day 11 to day 14 was a critical time window for tumour growth.
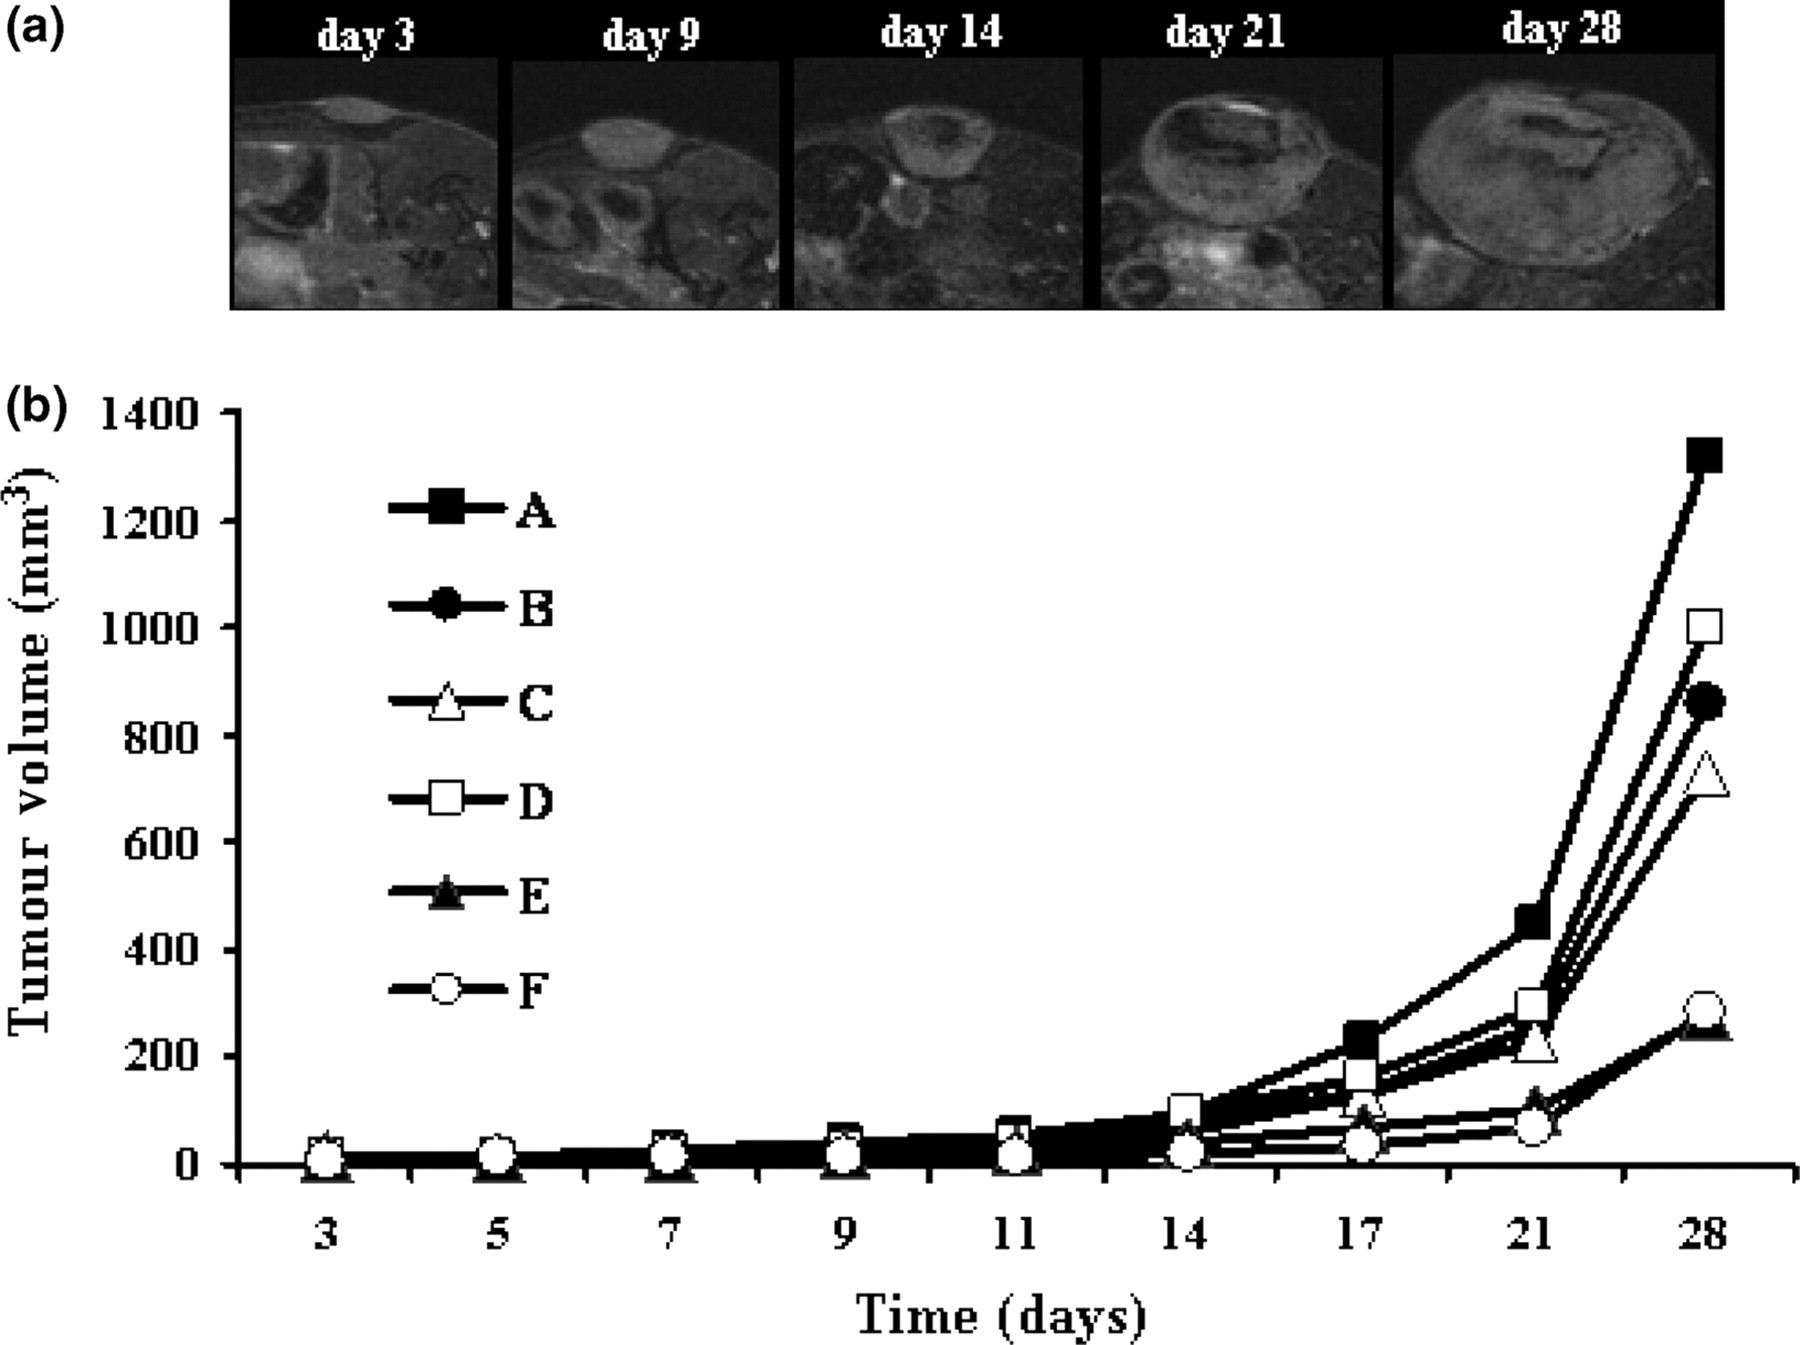
Tumour growth. (a) A series of axial T2-weighted representative images on days 3, 9, 14 and 28 after tumour implantation. All images were from approximately the same region of the tumour. (b) Tumour growth curves of six mice. Tumour volumes measured from T2-weighted images were plotted as a function of time after implantation. Tumour growth started slowly, but rapidly increased after day 11
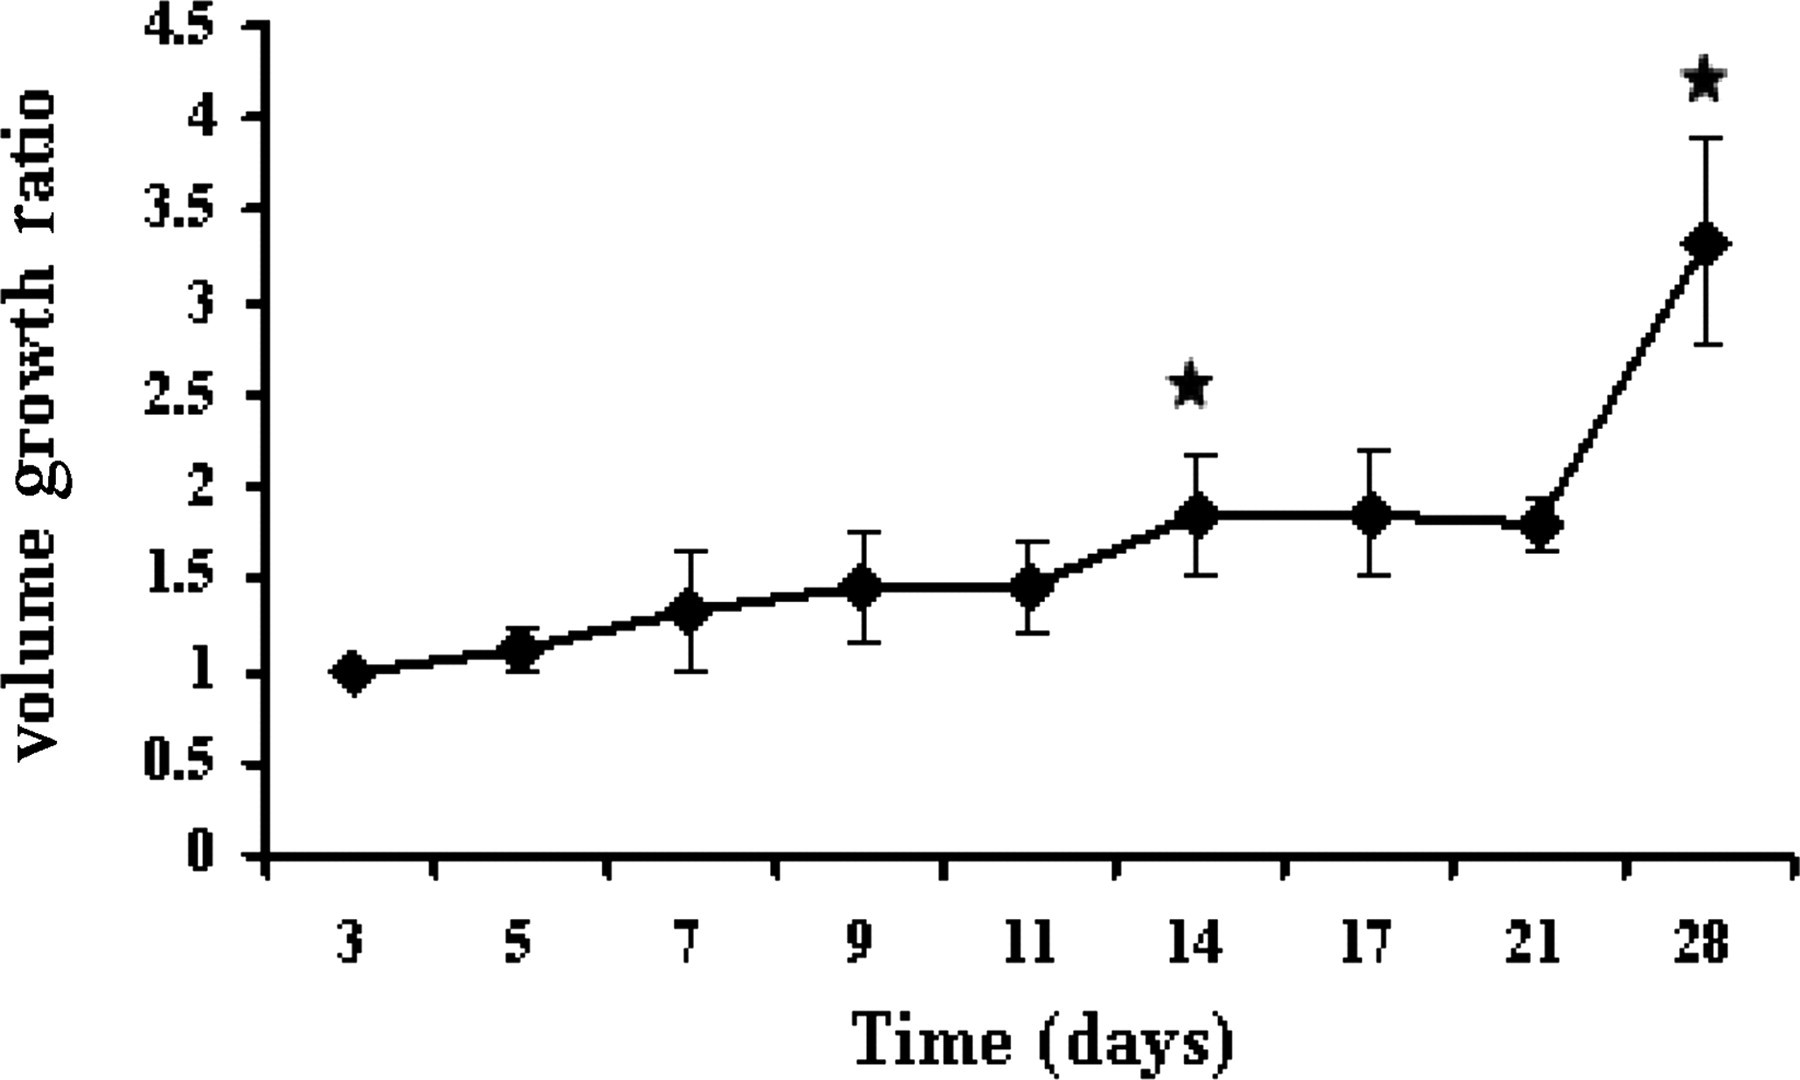
Ratio of tumour volume increase over time. The average ratio of increase in tumour volume in each data acquiring point from the previous data point was plotted as a function of time. We observed a statistically significant increase in growth rate (P = 0.02) between day 11 and day 14 and between day 21 and day 28 (P = 0.001), compared with the growth rate on the initial days
Correlation of K trans value with tumour growth rate
For measurements of spatially averaged K trans values over time, three ROIs from the tumour periphery to the tumour core were selected from the K trans maps (Figure 3a). Since tumour volumes were altered with respect to time, the sizes of the ROIs were kept proportional to the tumour diameters in the slices selected from day 3 to day 28, and the time-dependent changes in mean K trans values at different ROIs were determined (Figure 3b). The tumour periphery (ROI-1) reached its maximum on day 14 (0.70 ± 0.25) and decreased thereafter. ROI-2 showed lower K trans values than ROI-1 and had the same temporal pattern, with maximum values on day 14 (0.45 ± 0.27). The tumour core (ROI-3) displayed the lowest K trans values, which reached their maximum on day 14 (0.19 ± 0.13), but in contrast to K trans values for ROI-1 and ROI-2, values for ROI-3 did not decrease after day 14. There were essentially no significant changes in K trans values from day 3 to day 11, but the mean K trans values for all three ROIs on day 14 were significantly higher than the K trans values on day 3 (P = 0.001, P = 0.02 and P = 0.01 for ROI-1, ROI-2 and ROI-3, respectively), suggesting that day 14 was critical for tumour growth, in that at this time the permeable vasculature of the tumours increased significantly. ROI-1 showed a statistically significant decrease in K trans values (P = 0.003) between day 14 and day 28, but ROI-2 and ROI-3 did not (P = 0.07 and P = 0.36, respectively).
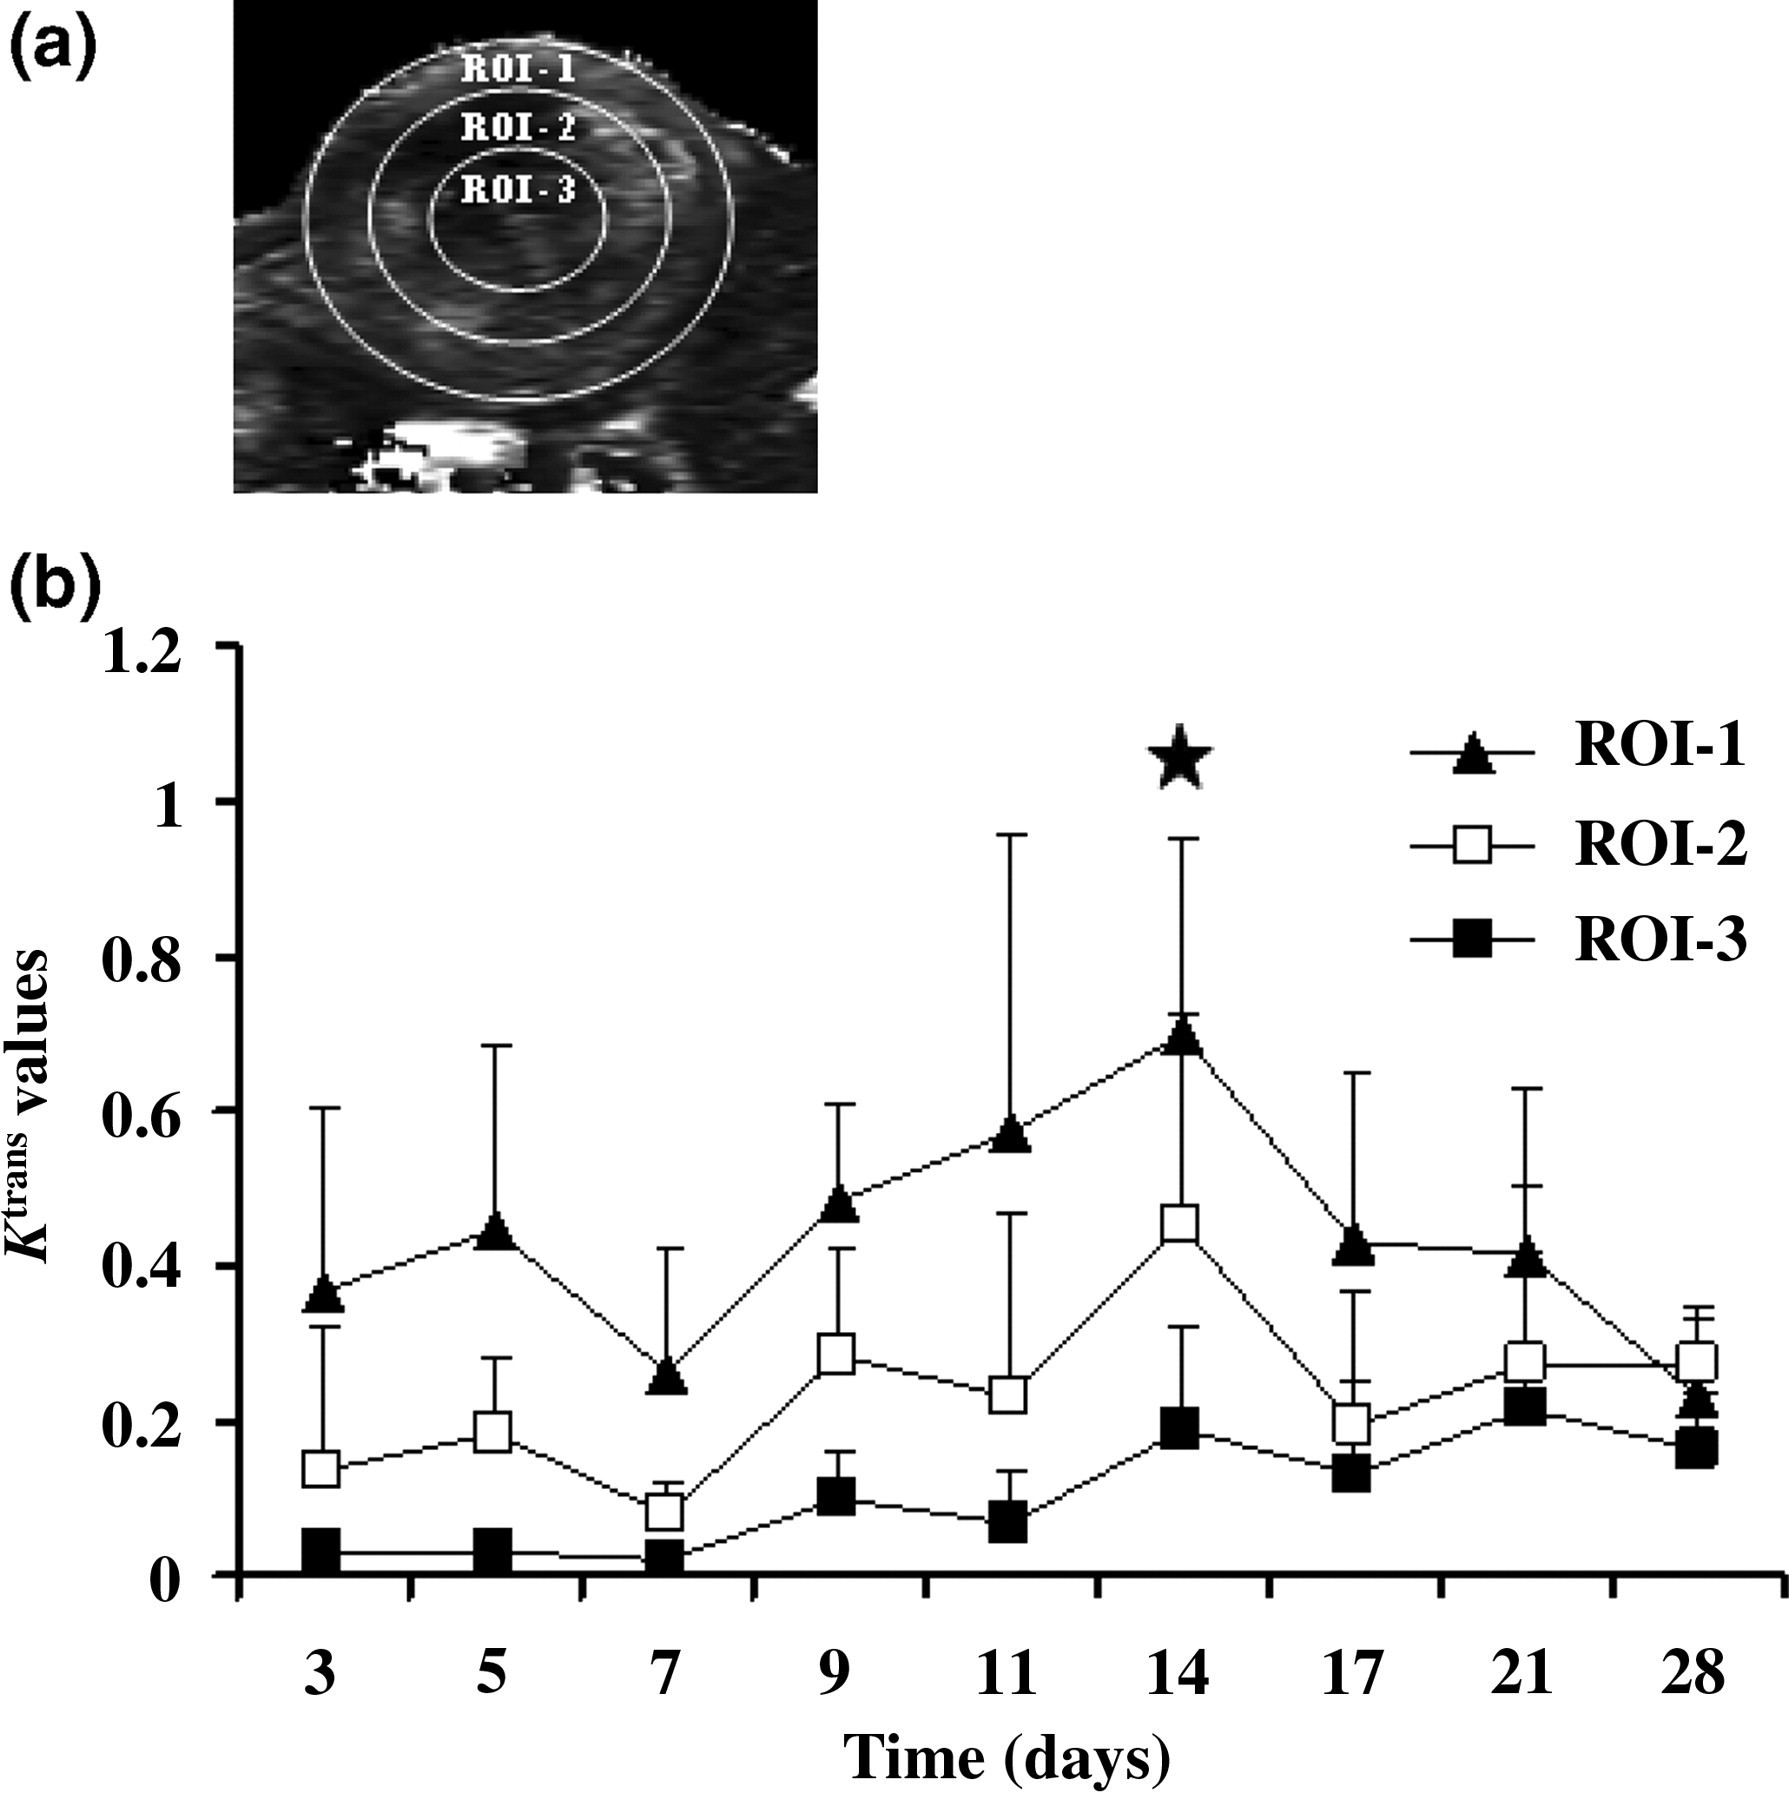
Temporal evolution of K trans values. (a) Representative locations of regions of interest (ROIs). ROI-1 was at the tumour periphery, ROI-3 was at the tumour core and ROI-2 was in the region between ROI-1 and ROI-3. The ROI sizes were maintained proportional to the tumour diameter from day 3 to day 28. (b) Temporal evolution of K trans values from day 3 to day 28. All three ROIs showed statistically significant increases in K trans values between day 3 and day 14 (P = 0.001 for ROI-1, P = 0.02 for ROI-2 and P = 0.01 for ROI-3). ROI-1 showed a significant decrease in K trans value between day 14 and day 28 (P = 0.003), whereas ROI-2 (P = 0.07) and ROI-3 (P = 0.36) did not
Spatial distribution of K trans values
To assess the heterogeneity of vascular permeability over time, we evaluated spatial-dependent profiles of K trans values from the tumour core to both ends of the tumour boundary on days 5, 14 and 28 (Figures 4a–c). On day 5, the K trans values showed a gradual increase relative to distance from the core, peaking at the tumour periphery and indicating that more angiogenic activity occurred around the peripheral region during the initial stage of tumour growth (Figure 4d). On day 14, gradual increases in K trans values towards the core region were observed, suggesting the development of neo-vessels from the periphery to the core region during this period (Figure 4e). On day 28, the K trans values were relatively low and stable, indicating that the newly developed blood vessels had matured and stabilized; however, the mean K trans values near the core region were higher on day 28 than on days 5 and 14 (Figure 4f).
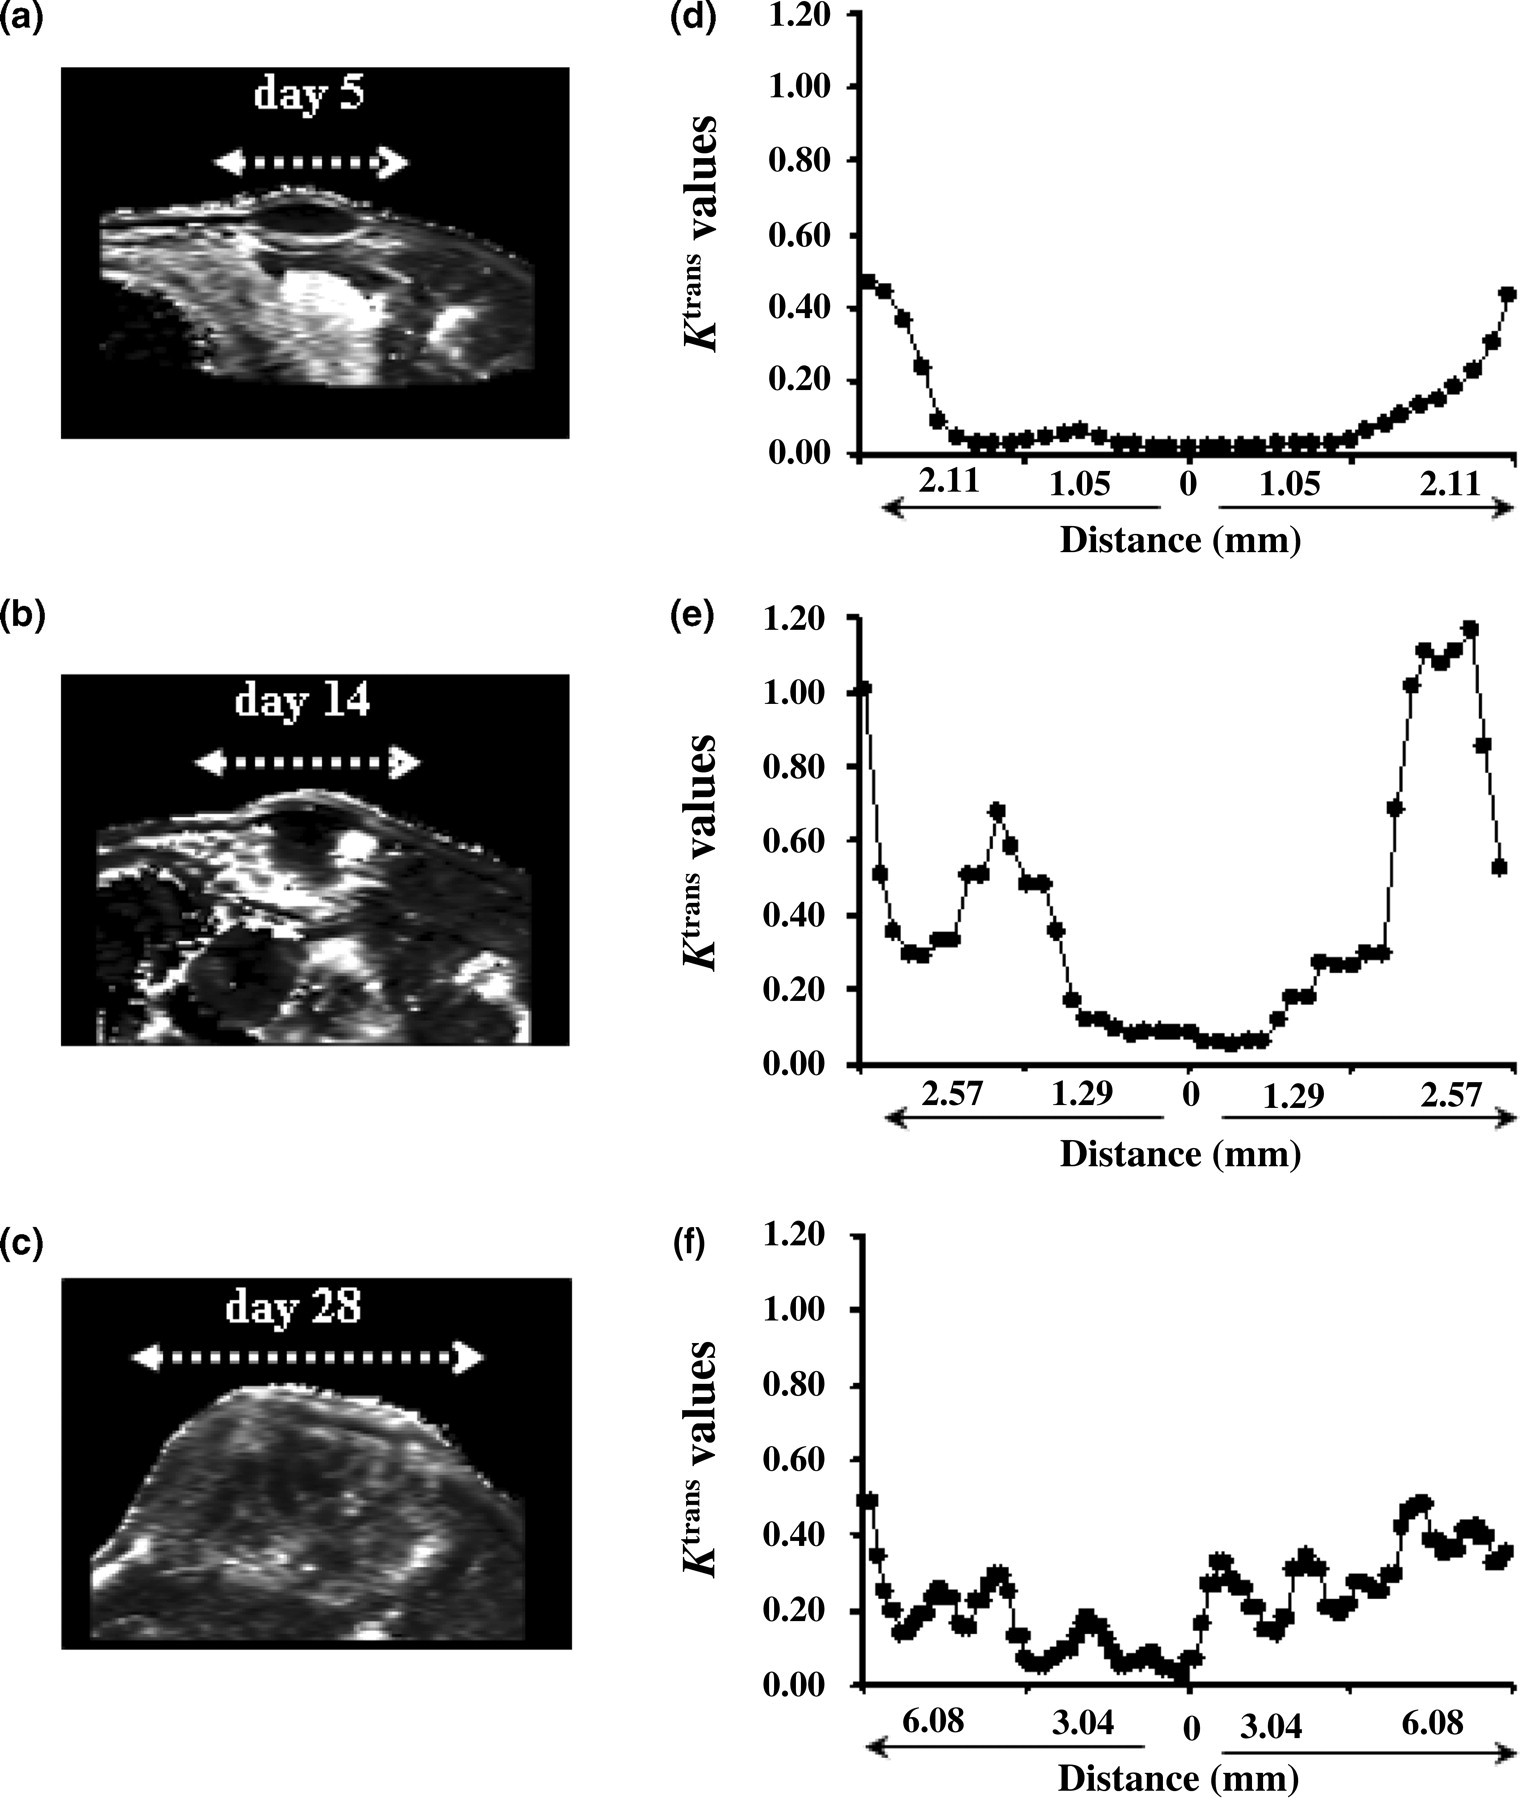
Analysis of the spatial distribution of the K trans profile. (a)–(c) Representative K trans maps from days 5, 14 and 28 defining the plane selected for evaluating spatial dependence. (d)–(f) Distribution profile of K trans from the tumour core to the periphery on days 5 (d), 14 (e) and 28 (f). Changes in K trans values from the tumour core to the periphery are depicted as a function of distance
Discussion
Non-invasive evaluation of angiogenesis during tumour growth may provide important insights in designing antiangiogenic strategies. To our knowledge, this MRI study is the first temporal and spatial demonstration of this dynamic process over the entire period of growth of experimental tumours.
Temporal assessment of angiogenesis using DCE-MRI relies on repeated intravenous administration of the CA, which is a challenge in animal model studies because of the lack of routes for repeated administration. In this study, we repeatedly administered the CA by rigorous standardization of the administration route below the sclera of the eye, and we found this approach successful for DCE-MRI over time.
Considerable evidence demonstrates that tumour angiogenesis is heterogeneous within tumours. The spatially averaged K trans values of three ROIs and the K trans values as a function of space from K trans maps over time were used to determine the detailed spatial and temporal changes in vascular permeability. At the initial stage, over the first 11 days after tumour implantation, tumour growth was slow. During this time, however, the K trans values showed hyper-intensities on the outer rim, but not in the central core, indicating that the tumour periphery, but not the central core region, was well vascularized. This result supports the notion that, within a few days after implantation, tumour cells actively search for blood vessels for nutrients and oxygen, resulting in changes to the local environment and causing dilation and increased perfusion of surrounding host blood vessels or increasing vascular permeability, which has been associated with the angiogenic process. 19–21 These findings suggest that tumour vascularization at the peripheral region during this stage is a rapid event, but it does not necessarily induce tumour growth.
On day 14, we observed a significant increase in K trans values for all three ROIs, followed by an exponential growth of tumour volume. There were also significant increases in volume growth ratio on days 14 and 28, thus providing direct in vivo evidence that tumour growth is dependent on angiogenesis. Angiogenic activity aggressively preceded the significant increase in tumour volume, consistent with the findings that angiogenic switching, the transition period from the prevascular to the vascular phase of tumourigenesis, is required for significant growth of tumour size. 22–26
Tumour growth generally follows mechanisms like local proliferation of endothelial cells, sprouting from pre-existing vessels and vascular co-option, 27–29 thus achieving adequate perfusion for oxygen and nutrients. The leaky and hemorrhagic nature of the tumour vasculature is partly due to the overproduction of vascular endothelial growth factor (VEGF), which increases vascular permeability. 3 The significant increases in K trans values observed in the areas between the tumour periphery and core on day 14 indicate that new capillaries sprouting from existing host vessels migrate to the inside of these tumours. This also suggests that, when tumours reach a certain size, the angiogenic activity starts to penetrate from the periphery to the core region, as rapid cell proliferation in the tumour periphery may induce hypoxia inducible factor-1 mediated VEGF expression in actively dividing regions.
Although neo-vessels developed continuously throughout the tumour growth period, there was a gradual decrease in K trans values after day 14, whereas tumour volume continued to increase, with volume growth ratios maximal on day 28. This may be due to vascular maturity, which stabilizes the vascular supply, thus reducing the likelihood of hypoxia and hypoxia-induced VEGF expression. 30–32 Interestingly, we found that relatively higher K trans values were maintained in areas near the tumour core, suggesting that in this region, the active angiogenic process is not complete at the later stages of tumour growth, whereas vascular maturation has occurred at the tumour periphery. However, we did not observe any microvessel perfusion into the central core region throughout the entire period of tumour growth.
Diffusion-weighted MRI was recently shown to be effective as an early surrogate marker of therapeutic efficacy, as reduction in tumour size was preceded by increased apparent diffusion coefficient. 33 Although tumour size may not be a good indicator of response to treatment, it remains critical for predicting the time window for angiogenic switching, which triggers rapid tumour growth.
In conclusion, we have reported here serial measurements of angiogenesis associated with tumour growth rate for individual mice, with each mouse serving as its own control. Our results demonstrate the importance of spatial and temporal information on the vascular characteristics of tumours, thus enabling a better understanding of the dynamic mechanism of tumour growth and enhancing our ability to assess the effects of antiangiogenic agents on tumour vasculature. The ability to determine the critical time of angiogenic switching may greatly facilitate the evaluation of therapeutic strategies and determine the time at which to start therapy.
Footnotes
ACKNOWLEDGEMENTS
The authors acknowledge technical support from the Functional and Micro-Magnetic Resonance Imaging Center supported by the National Research Program for Genomic Medicine, National Science Council, Taiwan, Republic of China. (NSC93-3112-B-001-006-Y). This study was supported in part by the National Science Council, Taiwan, Republic of China (NSC 93-2314-B-182-016).