
Abstract
Summary
Objective
To investigate whether the h index (a bibliometric tool which is increasingly used to assess and appraise an individual's research performance) could be improved to better measure the academic performance and citation profile for individual healthcare researchers.
Design
Cohort study.
Setting
Faculty of Medicine, Imperial College London, UK.
Participants
Publication lists from 1 January 2000 until 31 December 2009 for 501 academic healthcare researchers from the Faculty of Medicine.
Main outcome measures
The h index for each researcher was calculated over a nine-year period. The citation count for each researcher was differentiated into high (h2 upper), core (h2 centre) and low (h2 lower) visibility areas. Segmented regression model (sRM) was used to statistically estimate number of high visibility publications (sRM value). Validity of the h index and other proposed adjuncts were analysed against academic rank and conventional bibliometric indicators.
Results
Construct validity was demonstrated for h index, h2 upper, h2 centre, h2 lower and sRM value (all P < 0.05). Convergent validity of the h index and sRM value was shown by significant correlations with total number of publications (r =0.89 and 0.86 respectively, P<0.05) and total number of citations (r = 0.96 and 0.65, respectively, P<0.05). Significant differences in h index and sRM value existed between non-physician and physician researchers (P < 0.05).
Conclusions
This study supports the construct validity of the h index as a measure of healthcare researcher academic rank. It also identifies the assessment value of our developed indices of h2 upper, h2 centre, h2 lower and sRM. These can be applied in combination with the h index to provide additional objective evidence to appraise the performance and impact of an academic healthcare researcher.
Introduction
Academic healthcare institutions employ various systems to quantify research performance. This may enhance research quality and innovation so that the latest discoveries can be translated into medical advances.1,2 The simplest measure of research performance is the number of publications a researcher produces; however, this bibliometric fails to recognize the quality of a researcher's performance. 2 The number of citations received by a researcher's publications may determine the scientific impact of his or her research; however, this may be distorted by self-citations and negatively associated citations.3,4
DECLARATIONS
All authors have completed the Unified Competing Interest form at www.icmje.org/coi_disclosure.pdf (available on request from the corresponding author) and declare that all authors have no relationships with any company that might have an interest in the submitted work in the previous three years; their spouses, partners, or children have no financial relationships that may be relevant to the submitted work; and all authors have no non-financial interests that may be relevant to the submitted work
None declared
None declared
None declared
VMP was involved in design, acquisition of data, analysis of data, interpretation of data and drafted article; HA in design, acquisition of data, analysis of data and critical revision; LB in design and analysis of data; RM in design and analysis of data; JM in acquisition of data and drafted article; PS in critical revision; AD in concept and critical revision; and TA was involved in concept, interpretation of data and critical revision
The h index is an alternative bibliometric designed to measure the importance, significance and broad impact of a scientist's cumulative research contributions. 5 A researcher has index h if h of his or her publications (Np) have at least h citations each and the other (Np—h) publications have ≤h citations each. 5 For example, an academic with an h index of 20 must have 20 publications with at least 20 citations each. Evaluating research performance using the h index is rapidly increasing. The strongest indication of its acceptability is that its calculation has been integrated into the contemporary citation databases of Web of Science and Scopus.6-8
The h index is frequently criticized for the problems of self-citations, field dependency and multiple authorship, which are common to the majority of current bibliometrics. 9 If researchers are evaluated only on the basis of the h index, they may be unfairly treated mainly due to three reasons. Firstly, the h index does not fully consider highly cited papers, so that the impact of a researcher with a low h index and a few very highly cited papers will be undervalued. Secondly, the h index does not fully consider productivity of a researcher, so that publications with citations less than the h index are not included. Thirdly, the h index draws a sharp distinction between publications which have higher impact (publications with citations equal to the h index or more) and publications with less importance (for example, the h index assumes that in a researcher with an h index of 20 a publication with 19 citations is not important). In addition to the h index a more reasonable criterion is necessary which separate papers with visible impact from publications with less or no impact. 9
Recently, a small set of indicators were developed in order to solve these three limitations. The first two limitations are addressed by specifying the percentage of citations which fall into the high, core and low visibility areas of a researcher's publications. The third limitation is addressed by a special form of regression which determines the threshold of publications with visible impact from publications with less or no impact. 9
At present the assessment and appraisal of academic healthcare researchers relies on a peer review process to judge an individual's research performance, clinical commitment and educational contribution. These domains are further analysed to identify an individual's impact and external visibility.10,11 The h index has been considered as an objective tool that can assess research performance through citation analysis, although it has not been formally validated in healthcare researchers. 2
In this study we aimed to: (1) quantify the high, core and low visibility publications of individual researchers within the Faculty of Medicine at Imperial College London; (2) statistically estimate the number of high visibility publications of each researcher within our group by using a segmented regression model (sRM); (3) demonstrate the construct validity of the h index and our proposed adjuncts by comparing them with a qualitative peer-reviewed process of academic promotion in healthcare research; and (4) determine the convergent validity of the h index and our proposed adjuncts by correlating them with conventional bibliometric indicators.
Methods
Sample population
The Faculty of Medicine Imperial College London was established in 1997, and is one of Europe's largest medical institutions in terms of its staff and student population and its research income. 12 It incorporates eight campuses in North and West London, and is divided into six divisions: Clinical Sciences, Kennedy Institute of Rheumatology, Medicine, National Heart and Lung Institute, School of Public Health, and Surgery and Cancer. 12 We generated a list of all Faculty of Medicine Imperial College academics in employment on the 31 December 2009 from the intranet database. We included academics that were ranked in the hierarchical system in the following grades: lecturer, senior lecturer, reader and professor. Academics can be promoted from lecturer to senior lecturer to reader and then to professor. Each promotion has to be approved by an academic promotions committee which takes into account contributions to the following: education, research, leadership, management, professional and clinical practice. 12 We excluded academics that were research fellows, associates, officers and assistants. We extracted the first name, surname, academic rank, physician status (whether the academic was a physician or not) and department for each of the academics included in the study.
Generating an academic's publication list
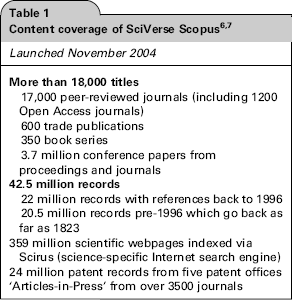
We used SciVerse Scopus to evaluate research output because it offers sophisticated tools to search, analyse and visualize research, as well as export to citation management software (Table 1). 7
The Scopus Author Identifier uses an algorithm that creates a publication set for an author based on their affiliation, address, subject area and source title, dates of publication, citations and co-authors. We used the surname and initials to search for the publication set authored by each academic. When more than one publication set was identified for the academic's name, we viewed the titles and abstracts of each publication set to determine which sets should be combined. After we selected all the relevant publication sets, we used the ‘Show documents’ button to generate a list of the academic's publications, with their corresponding citation counts. We selected publications from this list that were published between 1 January 2000 until 31 December 2009, and we exported the list to Microsoft Excel. We sorted the publication list in order of descending citations, and calculated the total number of publications, total number of citations and h index.
Calculating h2 upper, h2 centre and h2 lower
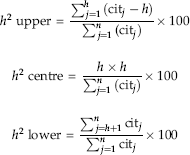
We differentiated the geometrical area of the citation count into the high visibility area (h2 upper), the core visibility area (h2 centre) and the low visibility area (h2 lower). Figure 1a shows a schematic curve of number of citations versus publications ranked in order of decreasing citations. The h index refers to the area h x h (h2 centre), which does not take into consideration the areas starting at h citations (h2 upper) or starting at h publications (h2 lower). We calculated h2 upper, h2 centre and h2 lower as a percentage of total citation counts using the following equations:
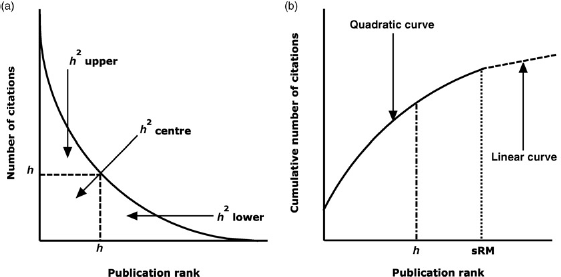
(a) Schematic curve of number of citations versus publication rank showing h2 upper, h2 centre and h2 lower, and (b) schematic curve of cumulative number of citations versus publication rank showing sRM value 9
The equations demonstrate that h2 upper was calculated by subtracting h x h from the sum of citations of publications with citation counts greater than an academic's h index value. The sum of h2 upper and h2 centre as a percentage of total citation counts was subtracted from 100 to calculate h2 lower.
Calculating sRM value
We defined the statistical estimate of the number of high visibility publications as the sRM value. Figure lb shows a schematic curve of cumulative citations versus publications ranked in order of decreasing citations. The quadratic curve in the first part depicts those publications with high citations that contribute most to the total citation count of a researcher (‘core’ publications with high visibility). The linear curve in the second part illustrates those publications which have little contribution to the total citation count (publications with low visibility). The h index underestimates the point of intersection of the two curves (Figure 2), so we used segmented regression to statistically model this point to obtain the sRM value. The following model for the cumulative citation counts yj was assumed, whereby xj is the rank of the publication j and z0 was the point of intersection of the two curves: if x j < z0

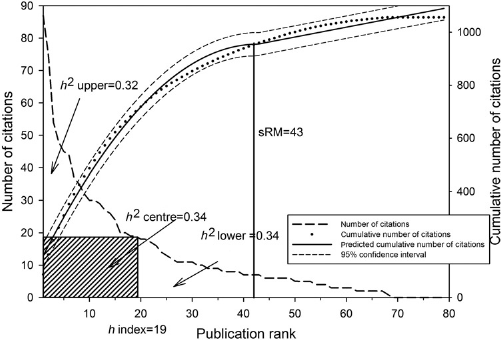
Calculation of h2 upper, h2 centre, h2 lower and sRM value for one of the professors of clinical medicine (R2sRM = .99)
otherwise,

The x values for j ranged from 1 to k. The z0 value was an unknown parameter that was defined as the maximum of the quadratic function:

The size of the residual variance (σ2e), or the proportion of explained variance to total variance (R2), can quantify the model fit. The sRM value was calculated for an academic if their publication set met the following criteria: (i) the citation count could be clearly distinguished into two parts, (ii) the algorithm converged, (iii) R2 was greater than 0.90, (iv) the point of intersection of the curves lay within the range of publications and (v) there were at least 15-20 publications in the set.
Statistical analysis
We statistically analysed for construct validity, as well as convergent validity: The bibliometric indicators were construct valid, if they showed significantly mean differences according to the hierarchy of academic rank (lecturer, senior lecturer, reader and professor). The bibliometric indicators were convergent valid, if they showed at least low to moderate correlations among the set of indicators, as well as low to moderate correlations with the h index. Bibliometric data as a rule and the calculated bibliometric indicators are not normally distributed, so we used Box-Cox power transformation to normalize the data. 13 Bibliometric data often have extreme values or outliers (e.g. highly cited publications) which might distort the variance. To adjust for extreme values we weighted the data: extreme values were assigned a smaller weight than the other values (M-estimator). Weights were estimated using Robust regression.14,15 We used two-factorial multivariate analysis of variance (MANOVA) on unweighted power transformed data followed by a two-factorial univariate analysis of variance (ANOVA) based on weighted power transformed data to analyse the differences between bibliometric indicators and academic rank or physician status. 16 We also applied post hoc Scheffe's test to explore significant differences between the groups. As the numbers of observations in each group were unequal, we employed Type III sums of squares. We adjusted for the year of first publication of an academic within the time frame of this study by using covariance adjustment. We also used Pearson correlation coefficient to calculate correlations on the power transformed data. We used SAS 9.2 for all analyses. (SAS Institute Inc., SAS 9.2 Enhanced Logging Facilities, Cary, NC, USA: SAS Institute Inc., 2008).
Results
The bibliometric data for 501 academics in the Faculty of Medicine were analysed. The cohort was unbalanced because the academic ranks were heterogeneous in terms of the number of academics and physician status (χ2(3)=48.1, P < 0.05, Cramer's V = 0.31); professors and senior lecturers were more likely to be physicians than lecturers and readers (Table 2). Out of the 501 academics, 398 (79.4%) had at least one publication in the year 2001. The criteria for the calculation of sRM value were fulfilled in 438 academics. The h2 upper values were not power transformed because they were approximately normally distributed.
Composition of the academics in the Faculty of Medicine
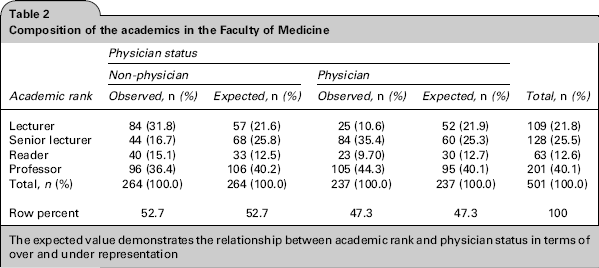
The expected value demonstrates the relationship between academic rank and physician status in terms of over and under representation
In the MANOVA, construct validity was demonstrated for total number of publications, total number of citations, h index, h2 upper, h2 centre, h2 lower and sRM value, because there were statistically significant differences between the different academic ranks (Wilks’ Lambda = 0.62, F(18, 1377.9) = 14.11, P < 0.05; Table 3). There were statistically significant differences between all the bibliometrics and the groups with different physician status (physician or non-physician) (Wilks’ Lambda = 0.90, F(6487) = 8.55, P < 0.05) and a statistically significant interaction effect between academic rank and physician status (Wilks’ Lambda = 0.94, F(18,1377.9) = 1.68, P < 0.05).
This table demonstrates the significant increase or decrease (
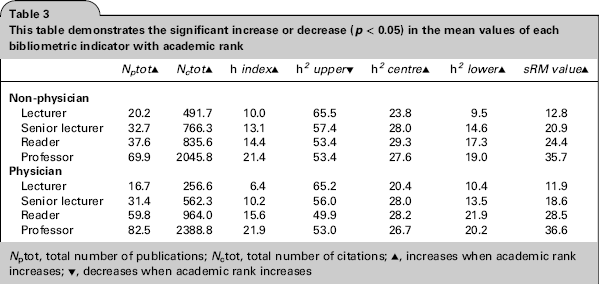
Nptot, total number of publications; Nctot, total number of citations; ▴, increases when academic rank increases; ▾, decreases when academic rank increases
In the ANOVA, construct validity was demonstrated for total number of publications, total number of citations, h index, h2 upper, h2 centre, h2 lower and sRM value, because there were statistically significant differences between the different academic ranks (P < 0.05; Table 4; Figure 3). Groups with different physician status showed statistically significant differences regarding total number of citations, h index, h2 upper and sRM value (P < 0.05). Academic rank and physician status showed a statistically significant interaction effect with respect to total number of publications and h index (P < 0.05). Professors (physician or non-physician) had more publications than the other academic ranks (P < 0.05). Physician professors and physician readers had more publications than their non-physician counterparts (P < 0.05). The more recent the year of first publication of an academic the lower were his or her total number of citations (regression coefficient = -0.12, P < 0.05) and h2 upper (regression coefficient = -0.011, P < 0.05). Lecturers had the smallest h index and total number of citations, but they showed the highest h2 upper (about 65%) of all groups.
Results of seven two-factor analyses of variance (academic rank, physician status, interaction) with covariate-adjustment (year of publication)
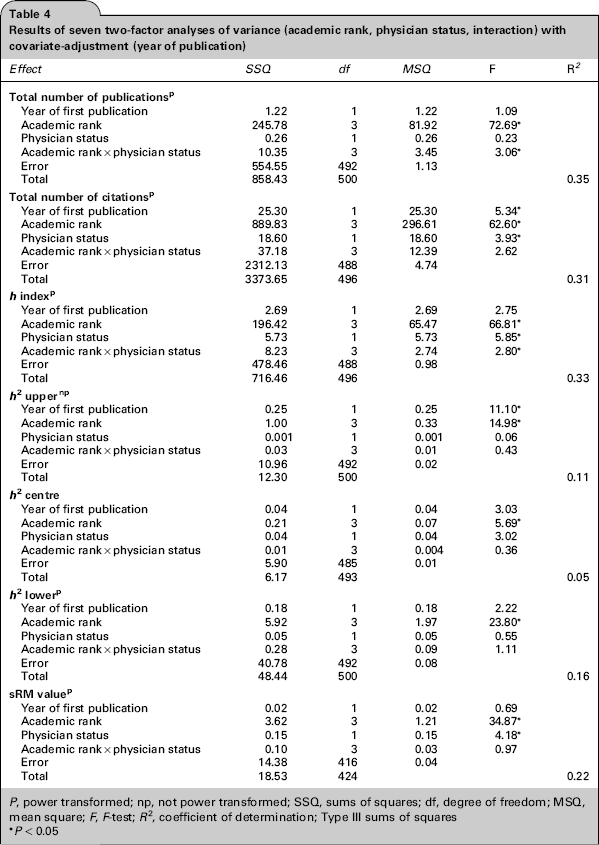
P, power transformed; np, not power transformed; SSQ, sums of squares; df, degree of freedom; MSQ, mean square; F, F-test; R2, coefficient of determination; Type
P<0.05
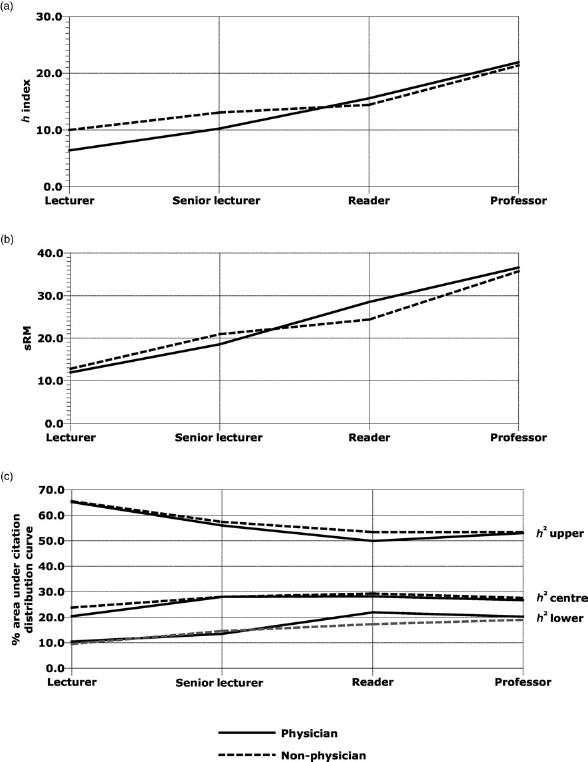
Differences between academic rank, physician status and (a) h index, (b) sRM value, (c) h2 upper, h2 centre and h2 lower
Convergent validity of the h index and sRM value was demonstrated by significant correlations with total number of publications (r = 0.89 and 0.86 respectively, P < 0.05) and total number of citations (r = 0.96 and, respectively, P < 0.05; Table 5).
Matrix of inter-correlations (Pearson) between different bibliometrics (power transformed variables, N= 438)
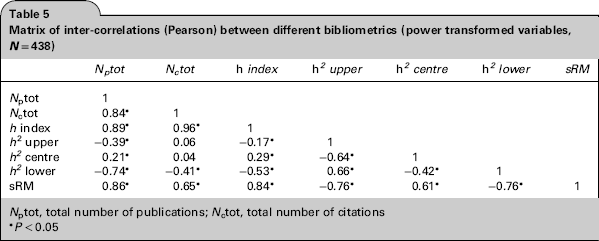
Nptot, total number of publications; Nctot, total number of citations
P<0.05
Discussion
We have demonstrated how to calculate h2 upper, h2 centre, h2 lower and sRM value in order to enhance bibliometric assessment and appraisal of research performance of an academic healthcare researcher. The sRM value is the first indicator which is based on statistical and not numerical concepts. Our study supports construct and convergent validity of the h index and sRM value.
Criticisms of the h index have led to the development of numerous variants of the h index.9,17 However, many of these variants are highly correlated with the h index and offer limited value in research performance assessment.9,17,18
Our study presents h2 upper, h2 centre, h2 lower and the sRM value, which complements and provides additional information to the h index. For example, in our study the lecturers had few publications and had a low h index, but their small publication set was well cited. A multi-dimensional bibliometric approach to research performance assessment may identify patterns of productivity, such as prolific researchers (high h2 centre and upper, low h2 lower), mass producers (high h2 lower, low h2 centre and upper) and perfectionists (high h2 upper, low h2 centre and lower).9,19 This can provide practical information that can be conveyed in various forms such as graphical images (Figure 4) to support academics and supervisors in planning and managing careers, as well as assisting in the decisions for academic promotion and funding. 20
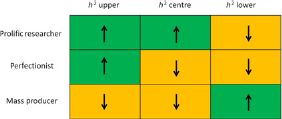
Representative grid categorizing researchers as prolific, perfectionist or mass producers according to h2 upper, h2 centre and h2 lower characteristics
Previous studies have shown construct validity of the h index in healthcare specialties such as anaesthesia, neurosurgery, radiology and urology.21-25 Our study is the largest construct validation study of the h index in academic healthcare researchers within one of the largest Faculties of Medicine in Europe. It also takes into account the length of academic career and physician status. Academic physicians (clinician scientists) will spend approximately half of their time in clinical care, and many physicians believe that bibliometric analyses favour basic scientific research over clinical research.26-28 Our study confirms that differences do exist between physician and non-physician academic healthcare researchers. This should be considered when measuring the research performance of academic physicians with bibliometrics such as the h index.
Our study has limitations associated with the disadvantages of the h index, which does not consider degree of co-authorship, gratuitous authorship, age of the researcher, context of citations, self-citations and scientific discipline.9,17,22 We did not consider the impact of document type on research performance. We did not account for the bias that may exist of researchers preferring to cite work from their own country. We have extracted bibliometric data for academics from a single centre specializing in medicine, so the findings of this study may not be generalizable to other academic institutions or specialties. The h index does give an indication of the absolute number of citations (h x h), but this information is deficient in the sRM value. We collected data over a defined timeframe, so our results cannot be used as an absolute benchmark for comparing academic healthcare researchers (Figure 4). The sRM value is not easily calculable because it relies on segmented regression modelling using statistical software.
There are differences in the publication sources for Web of Science, Scopus and Google Scholar, which produce quantitatively and qualitatively different citation counts for healthcare reasearchers. 29 We only used Scopus to extract the bibliometric data of the academic healthcare researchers, and it is unknown whether physician bias exists for any of the citation databases. Miscalculation of bibliometric data is more likely if an author has a common name, if they have published using a combination of names, if they have worked in a variety of institutions or if they have extensive research interests. 22
Future research may include studies that explore the relationship between our measures of high visibility (h2 upper and sRM) and the impact and external visibility of an individual's research. This may objectively measure the benefit of an individual's research to the wider economy and society. It may also offer impartial evidence for selection and promotion committees to guide and support healthcare researchers in achieving enhanced academic goals.
Conclusions
Our study supports construct validity of the h index as a measure of academic rank for healthcare researchers. However, the h index describes only a small proportion of information about the academic output of a researcher. As a result, it may not accurately reflect an individual's research performance. The use of h2 upper, h2 centre, h2 lower and sRM value in combination with the h index may provide additional objective evidence to assess and appraise the impact of an academic healthcare researcher. This may identify patterns of academic activity that can support research quality and productivity of innovative researchers. It can also offer guidance for less creative researchers to optimize their academic profiles. The ultimate aim of applying these h index values is to guide and support the academic output and impact of healthcare researchers to support translational medicine for the improvement of patient care.
Footnotes
Acknowledgements
None declared