
Abstract
Summary
Objectives
The Community Care (Delayed Discharges, etc.) Act, 2003 was aimed at reducing the number of patients whose discharge from hospital was delayed, incorporating financial incentives based on a model from Sweden. The Act permitted NHS hospital trusts to charge local authority Social Service Departments for delays they were deemed responsible for and was accompanied by grants aimed at supporting improvements in the transfer of care. This study aims to assess how far the subsequent reduction in delays has been due to the operation of the Act, and to evaluate the extent that the legislation increased efficiency across health and social care.
Design
Analysis and interpretation of a range of official routine health statistics plus unpublished performance data.
Setting
Data on patients delayed in hospital in England from 2001–2002 to 2006–2007 and trends in hospital activity.
Main outcome measures
Trend analysis of health statistics and performance data relating to delayed discharges and other relevant indicators.
Results
Althought there has been an overall reduction in delayed discharges, this trend predates the implementation of the Act. Overall, bed- days lost to delayed discharges accounted for only a small proportion of all bed-days – 1.6% in 2006–2007, and over the period studied the causes of the majority of delays were attributed to the NHS (68%).
Conclusions
These findings indicate lttle evidence to support the policy of charging social services to improve public sector efficiency. The focus on reducing delays should be set in the context of the wider health economy. There are a number of pressures to reduce the time patients spend in hospital including fewer beds and increasing numbers of admissions, plus a rise in emergency readmission rates is noted. There are few good data available to monitor the impact of earlier discharge, such as on the quality and availability of post-discharge care.
Introduction
The Community Care (Delayed Discharge, etc.) Act, 2003 was introduced to reduce delays in discharge from acute hospital beds, particularly delays caused by the failure of Local Authority Social Services Departments (SSDs) to provide post-discharge arrangements in a timely manner. 1
Though not compulsory, the Act allowed hospital trusts to charge SSDs £100 per day (£120 in the South East) for delays they were deemed responsible for. The Act was accompanied by the introduction of a Delayed Discharge Grant currently worth £100 million a year nationally shared across all SSDs, as well as a range of other grants to help trusts (together with local health partners) tackle the causes of delays.
The focus on discharging patients earlier from hospital is part of a broader trend towards reducing lengths of stay both in England and internationally. In the US in the early 1980s the federal government revised the way Medicare paid hospitals for treating elderly patients by changing from a retrospective fee-for-service system to a prospective payment system (PPS). This meant that hospitals were paid a fixed amount for a patient with a particular diagnosis irrespective of length of stay or type of care. The RAND studies evaluated the impact of the reforms on the quality of hospital care. One finding was that more patients were discharged in an unstable condition, for whom there was an increased likelihood of post-discharge mortality. 2 (The RAND Corporation is a US-based non-profit institution that works to help improve policy and decision-making through research and analysis.)
Initiatives to relieve pressure on hospital beds in the UK and elsewhere include Early Supported Discharge Schemes, the ‘hospital at home’ concept which originated in France in the early 1960s, a focus on admission prevention, and intermediate care services to provide ongoing support away from an acute hospital bed.
In Sweden in 1992 the Ädel reforms were introduced to facilitate quicker discharge from hospital of elderly patients. The rationales behind the reforms were: administrative, to transfer care of the elderly from councils to municipalities; to de-medicalize care by transfer to a more individualized setting; to reduce the cost of care; and to increase hospital productivity. The reforms obliged local authorities to pay for the cost of care of patients whose hospital treatment was completed but who had not been discharged because, for example, they had not offered a nursing home place.
The Ädel reforms were cited in the 2002 Wanless Report which provided an independent review of the long-term resource requirements for the NHS. The Report noted the success of the reforms in reducing hospital bed-blocking, and recommended that the Government ‘should examine the merits of employing financial incentives such as those used in Sweden to help reduce the problems of bed blocking’. 3
Despite important differences between Sweden and England, notably that in Sweden, under the reforms responsibility for health and social care for older people outside of hospital was transferred to local municipal government, 4 the Community Care Act was passed, modelled on the approach to charging in the Swedish model.
Since its introduction, the scheme has been hailed as a success. Both the number of patients delayed and the number of bed-days lost todelayed discharges have fallen, and the Department of Health is considering extending the initiative to non-acute and mental health service beds. 5
But to what extent has the reduction in delays in discharge been due to the operation of the Act, and has the Act increased efficiency across health and social care?
We carried out research to help answer these questions using available official routine data and previously unpublished Department of Health performance data. We measured trends in delays before and after the Act, describing the agencies responsible, and the recorded reasons for delay. 6 This work updates and expands our findings from a study funded by the Economic and Social Research Council to evaluate financial incentives and discharge policies in public services, early results which were published in a previous paper. 6 In this article we extend the work to evaluate a range of other relevant indicators using data from the Department of Health, Hospital Episode Statistics and the Information Centre. We review trends in delayed discharge in relation to the number of available NHS beds, trends in hospital activity, length of stay and numbers of emergency readmissions.
Trends in numbers of patients experiencing delayed discharges 2001–2002 to 2006–2007
Data on delayed discharges from the NHS are available from two sources. The first is derived from reporting by Primary Care Trust commissioners in their Local Delivery Plan Returns (now Vital Signs Monitoring Returns) which counts the number and proportion of patients occupying an acute hospital bed with delayed discharge. These data are collected from a one-day census conducted every quarter ( Patients of all ages (n, %) occupying an acute hospital bed despite having been discharged, England, by quarter (2001–2002 to Quarter 1, 2007–2008). Source: Department of Health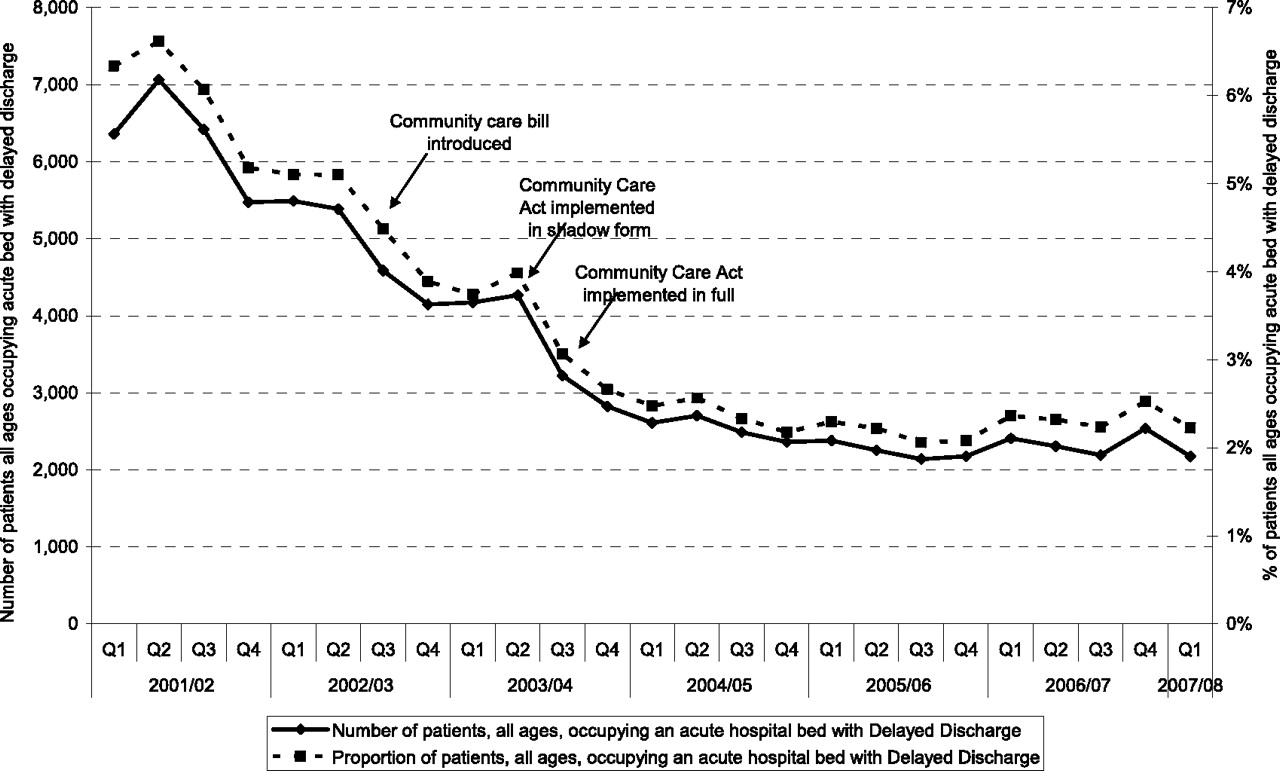
We analysed data from the quarterly census to show trends in the numbers of patients experiencing delays in discharge since April 2001 – when the data for patients of all ages first became available. As Figure 1 shows, the steep reduction in the number of patients with a delayed transfer predates the Community Care Act, suggesting that the decline cannot be attributed solely to the legislation. However, the intense policy focus on delayed discharges and the financial incentives introduced concurrently through the Delayed Discharge Grant, probably contributed to this trend.
Trends and causes of delay in patient discharge days by sector (NHS and SSD) 2003–2004 to 2006–2007
We accessed SitReps performance data by invoking the Freedom of Information Act and obtained quarterly data from 29 September 2003 through to 1 April 2007. Although SitReps data collection started in the winter of 1999–2000, it initially recorded just the number of patients whose discharge was delayed. In 2003, the data recorded on the return was expanded to capture the total number of delayed bed-days on a weekly basis, and to record whether delays were attributable to the NHS, a local authority SSD, or to both the NHS and a SSD. This would enable the calculation of financial liability for delayed discharge bed-days as required by the Act. The SitReps form also recorded the reason for delay according to nine categories.
Data from SitReps returns therefore provide the means of identifying the number of bed-days lost to delayed discharges as well as the proportion of delays attributable to SSDs. However, to our knowledge, no studies have been conducted to determine the reliability and validity of SitReps data.
We analysed trends in delayed discharge bed-days by sector and quarter. Overall, delayed discharge bed-days accounted for a very small proportion of total bed-days, just 1.6% in 2006–2007, with those attributable to SSDs accounting for just 0.4%. These percentages were calculated by dividing the total number of delayed discharge bed-days per year by the total bed-days in the same year (50.1 million bed-days in 2006–2007. 7
Delayed discharge bed-days (n) per quarter by sector, England (29 September 2003 to 1 April 2007). Source: SitReps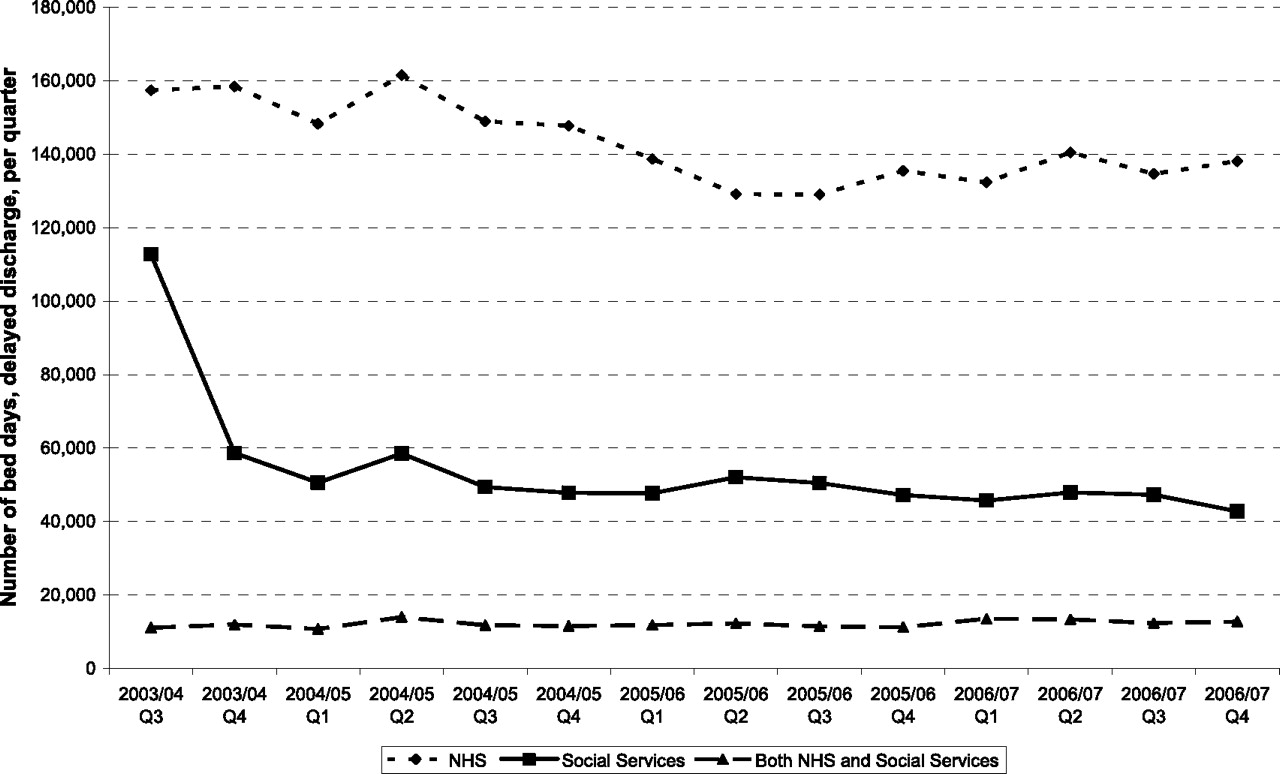
We found that the majority of delays attributed to both NHS and SSDs were due to the failure to provide a required service or a dispute with patients and families over eligibility for public funding. There were also a significant number of delays attributed to the NHS which were due to patient and family-related reasons, as well as disputes about who is responsible for post-discharge care.
Other associated trends
We looked at data on hospital beds, Average daily number of available beds by sector, England, 1987–1988 to 2006–2007. Source: Department of Health, Hospital Activity Statistics, form KH03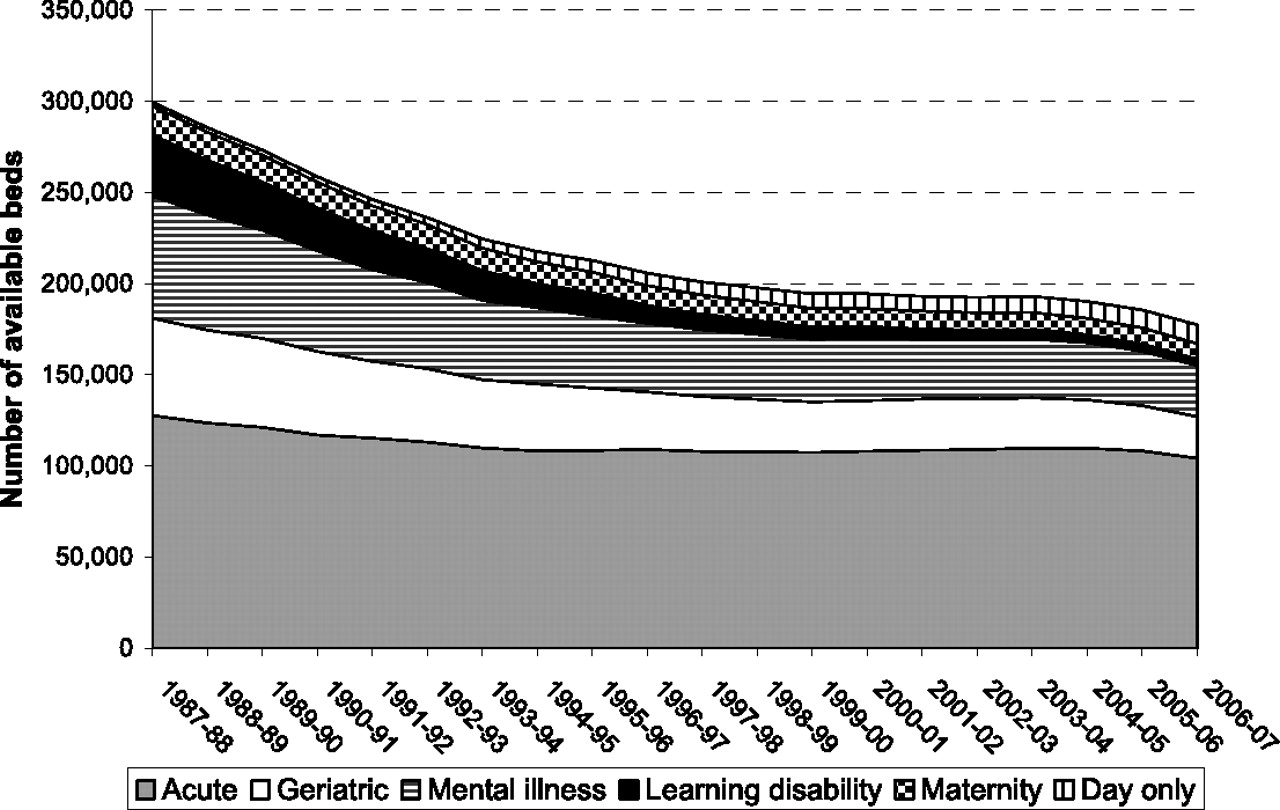
Numbers of available NHS beds by category 1987–1988 to 2006–2007
Using data from 1987–1988 onwards we analysed trends in the number of available NHS hospital beds by category. Figure 3 shows that the long-term trend of reductions in the numbers of available NHS beds has continued despite pledges to reverse this trend in the NHS Plan of 2000. 8 In 2006–2007 there were 16,867 fewer beds compared to 1999–2000 (including day-only beds). Of these reductions, around half (8104) were in general and acute beds. Intermediate beds are not included in these figures as they are not collected in the same way and definitions can be problematic. 9
Hospital admissions, length of stay and readmissions
From analysis of trends from 1998–1999 to 2006–2007 we found that the annual number of hospital admissions is rising, while the number of occupied bed-days are reaching a plateau. Mean length of stay continues to reduce as shown in Number of hospital admissions, occupied bed-days, and mean length of stay, England, 1998–1999 to 2006–2007. Source: Hospital Episode Satistics, The Health and Social Care Information Centre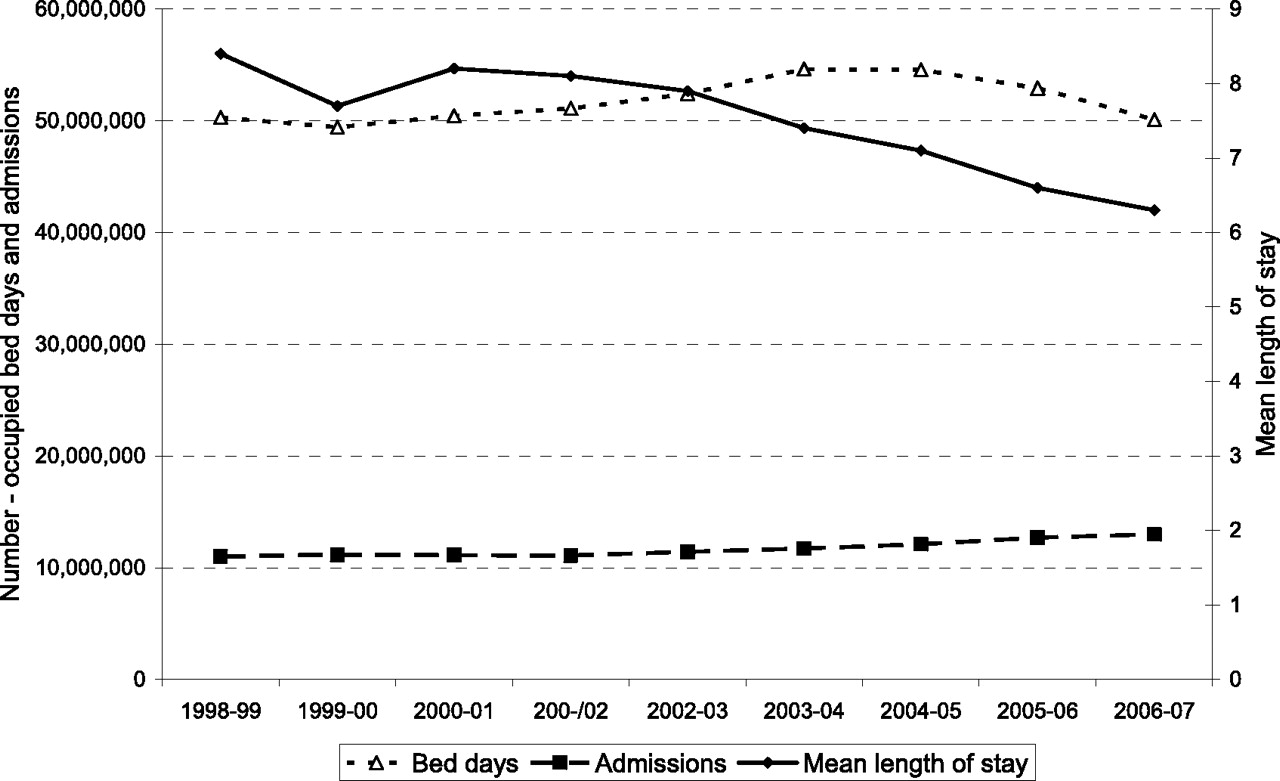
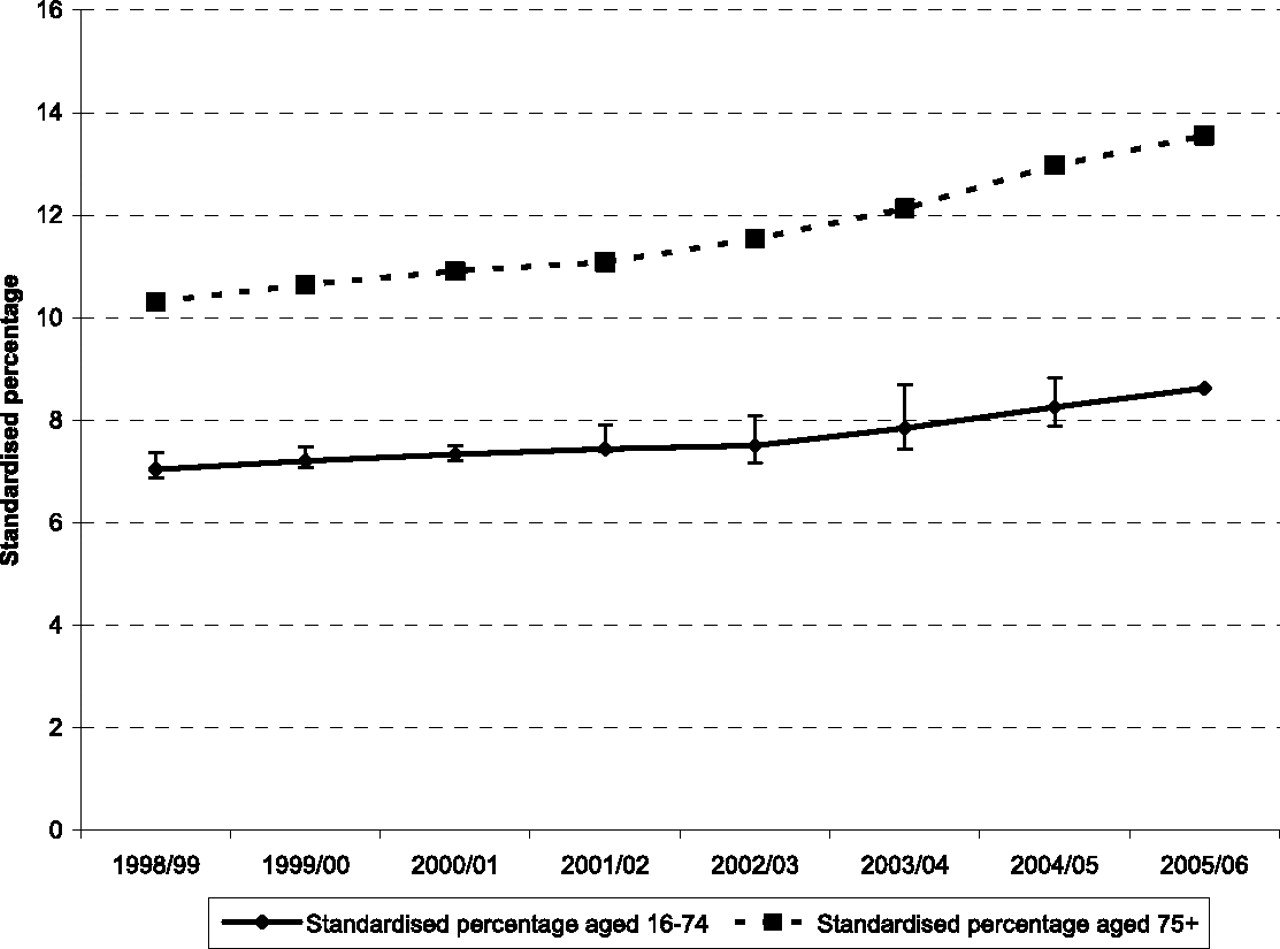
We plotted trends in emergency readmission rates as illustrated in Emergency readmission to hospital within 28 days of discharge: adults aged 16–74 years and 75 years and over, England, 1998–1999 to 2005–2006 (N.B. Indirectly standardized percentage by age, sex, method of admission and diagnosis/procedure, standardized to 2002–2003 population). Source: National Centre for Health Outcomes Development
10
Discussion
The underlying assumption of the reimbursement policy enshrined in the Community Care Act is that most delays in discharge from hospital are due to the failure of Local Authority Social Services Departments to arrange post-discharge care. However, this paper supports our previous findings that the NHS is accountable for the majority of delays. The fall in numbers of patients experiencing delay in discharge precedes the Act and occurs against a backdrop of decreasing numbers of available NHS beds and shorter lengths of stay. At the same time the total number of occupied bed-days are reaching a plateau which suggests that the system has reached full capacity. Rising readmission rates are of particular concern, suggesting the emphasis on earlier discharge may have had a rebound effect, though it is difficult to explore this without examining individualized data on delayed discharges.
The option given to hospitals to charge SSDs for delays is unlikely to have improved the performance of SSDs, since relatively few hospitals choose to impose charges. 6 We discovered from a survey carried out as part of our study that the majority of hospital trusts were not charging SSDs for delays in discharge attributed to them, but had formed agreements to work collaboratively in using the delayed discharge grant to reduce/prevent delays.
There are no available data to monitor the wider impact of reductions in discharge delays and shorter average lengths of hospital stay. It is not known, for example, whether patients discharged from hospital earlier in their recovery period are more likely to be readmitted on an emergency basis, or whether patients, their families and carers experience a higher or lower quality of discharge and post-discharge care as a result. What we found, however, is that patient and carer concerns about NHS discharge arrangements figure highly among the reasons for delay.
SitReps does not record the number of days that any given delay lasts as bed-days lost to delayed discharge are only recorded as an aggregate figure. It is therefore not possible to tell whether the total number of bed-days lost to delay reflects a small number of patients experiencing lengthy delays, or a greater number of patients with short delays.
As patients spend less of their recovery time in hospital as evidenced from the decrease in mean length of stay, the lack of monitoring of the quality of post-discharge care is a concern. This is especially the case in the light of issues about decreasing eligibility for NHS care, closures in the NHS long-term care sector and the increasing use of ‘interim care’ arrangements (i.e. the use of temporary, short-term placements to facilitate discharge from an acute hospital bed).
Summary
There is a lack of evidence to support the policy of charging social services to improve public sector efficiency, and there are no data available to determine the impact of the policy to allow hospitals to charge SSDs for delays in hospital discharge. Overall, the number of bed-days lost to delayed discharge is a relatively small proportion of total bed-days, with the proportion of delays attributed to SSDs still smaller.
The focus on reducing delays in discharge takes place against a number of pressures to reduce time patients spend in hospital, such as the decreasing number of available beds, increasing numbers of admissions, the pricing structure of the national tariff and waiting list targets while at the same time rates of emergency readmissions to hospital have continued to rise in England.
Footnotes
DECLARATIONS
Footnotes
Acknowledgements
None