
Abstract
Summary
Objective
To investigate recent trends in the recorded incidence, lifetime prevalence and prescribing of symptom relief medication for allergic rhinitis in England.
Design
Analysis of primary healthcare datasets.
Setting
The UK prevalence of allergic rhinitis has increased very significantly over recent decades. Analysis of primary healthcare datasets offers the possibility to advance understanding about the changing epidemiology and management of allergic rhinitis. QRESEARCH is one of the world's largest national aggregated health databases containing the records of over nine million patients. We extracted data on all patients with a recorded diagnosis of allergic rhinitis and calculated annual age–sex standardized incidence and lifetime period prevalence rates for each year from 2001–2005. We also analysed prescribing trends for antihistamines and drugs used in nasal allergy in those with a recorded diagnosis of allergic rhinitis.
Main outcome measures
Age-sex standardized incidence, lifetime prevalence rates and prescribing trends for symptom relief medication for allergic rhinitis in England.
Results
The age-sex standardized incidence of allergic rhinitis was 5.57 per 1000 person-years in 2001 and increased by 33.0% to 7.41 per 1000 person-years in 2005 (P<0.001). Lifetime age-sex standardized prevalence of a recorded diagnosis of allergic rhinitis increased by 43.2% from 46.35 per 1000 in 2001 to 66.37 per 1000 in 2005 (P<0.001). Over this period a 41.7% overall increase in prescriptions for antihistamines and drugs used in nasal allergy was observed (antihistamines 45.5%, drugs used in nasal allergies 35.5%).
Conclusions
Recorded incidence and lifetime prevalence of allergic rhinitis have increased substantially in recent years. A similar increase in prescriptions for antihistamines and drugs used in nasal allergy in patients with allergic rhinitis is also observed.
Introduction
Allergic rhinitis is a common condition affecting people of all ages in the UK. 1 , 2 A recent review of existing UK epidemiological data revealed that the prevalence of allergic rhinitis approximately trebled over the last three decades, but more recently appears to have stabilized, and may in fact be declining. 3 The reasons underpinning these variations in disease patterns remain poorly understood.
The International Study of Asthma and Allergies in Childhood (ISAAC) epidemiological research programme recently published data of their 2002–2003 Phase Three study; 2 this survey compared data from the baseline Phase One study (completed a mean of seven years after Phase One). 4 Both phases of this international cross-sectional survey enquired about symptoms indicative of allergic rhinitis over a 12-month period in school-aged children. Results showed that in the UK, the 12-month period prevalence of self-reported symptoms of allergic rhinitis was 15.3% in 13–14 year-olds, a fall of 3.6% from Phase One. In 6–7 year-olds, the 2002–2003 12-month prevalence of self reported symptoms was 10.1%, an increase of 0.3% from Phase One.
In adults, data from the Health Survey for England (HSE) found that the 12-month period prevalence of symptoms was 15% in 2001, this being unchanged from the 1996 figures. 3 Results from the European Community Respiratory Health Survey (ECRHS) conducted in 1994 showed that for four British towns and cities, the self-reported prevalence of ever having a diagnosis of hayfever or nasal allergy ranged from 23.6–29.2%. 5
Whilst the above data provide useful information on variations in lifetime/period prevalence of self-reported symptoms of allergic rhinitis over time, particularly in children and adolescents, relatively little reliable national data describes clinician diagnosis of allergic rhinitis and changes in the epidemiology for the whole adult population over time. Exploitation of large national healthcare datasets, with their key strengths of large numbers and representative data, offers an important opportunity to develop insights into the epidemiology of allergic rhinitis and associated prescribing. 6
Studying primary care databases provides a window onto overall national trends, something that is not possible with large scale surveys such as ISAAC (which has studied only children) and ECRHS (which looks only at adults). 7 Building on our previous work, 1, 3, 8 we sought to describe recent trends in recorded primary care diagnosis of allergic rhinitis and prescribing for allergic rhinitis in England.
Methods
We used Version 10 of the QRESEARCH database, which is a very large, nationally representative anonymized aggregated health dataset derived from 525 general practices throughout the UK. 6 It contains data for the period 1 January 1999 to 31 December 2005 and includes over 30 million patient years of observation, these being derived from over nine million individual patients. Only practices from England were included in this analysis. For further information on practice inclusion and data collation, please refer to our initial paper in this series of reports drawing on QRESEARCH data. 9
Patients were included in the analysis year if they were registered for the entire analysis year in question. Patients who might have incomplete data (i.e. temporary residents, newly registered patients and those who joined, left or died during the year) were not eligible for inclusion. Data for a total of 2,958,366 patients was analysed.
We considered patients to have allergic rhinitis if they had a computer-recorded diagnostic Read code for allergic rhinitis in their electronic health record for the relevant time period. Details regarding the Read codes used are available from the corresponding author.
Incidence was defined as the number of new cases of disease diagnosed and recorded in a specific year, with the denominator of number of patient years of observation (this being calculated as a product of the number of patients registered with practices and their length of registration) being used to calculate incidence rates. Lifetime prevalence was defined as the numbers of people with a diagnosis of allergic rhinitis recorded in the GP records on at least one occasion at any point in their lives; the denominator used to calculate the lifetime prevalence rate was the number of patients registered with the study practices.
For the general population we have determined the consultation rates per person per year with a GP and with a nurse. This includes consultations in the home, at the surgery and on the telephone. We have also determined the consultation rate per person per year for patients with each specific disease regardless of the reason for those consultations. Note that the requirements for patients to be registered for the whole of the analysis year lead to slight under-estimates of consultation rates in the very young and the very elderly populations. 10
Lifetime prevalence of allergic rhinitis per 1000 patients. © QRESEARCH
2006 Lifetime prevalence (and 95% CI) of allergic rhinitis per 1000 registered
patients, 2001–2005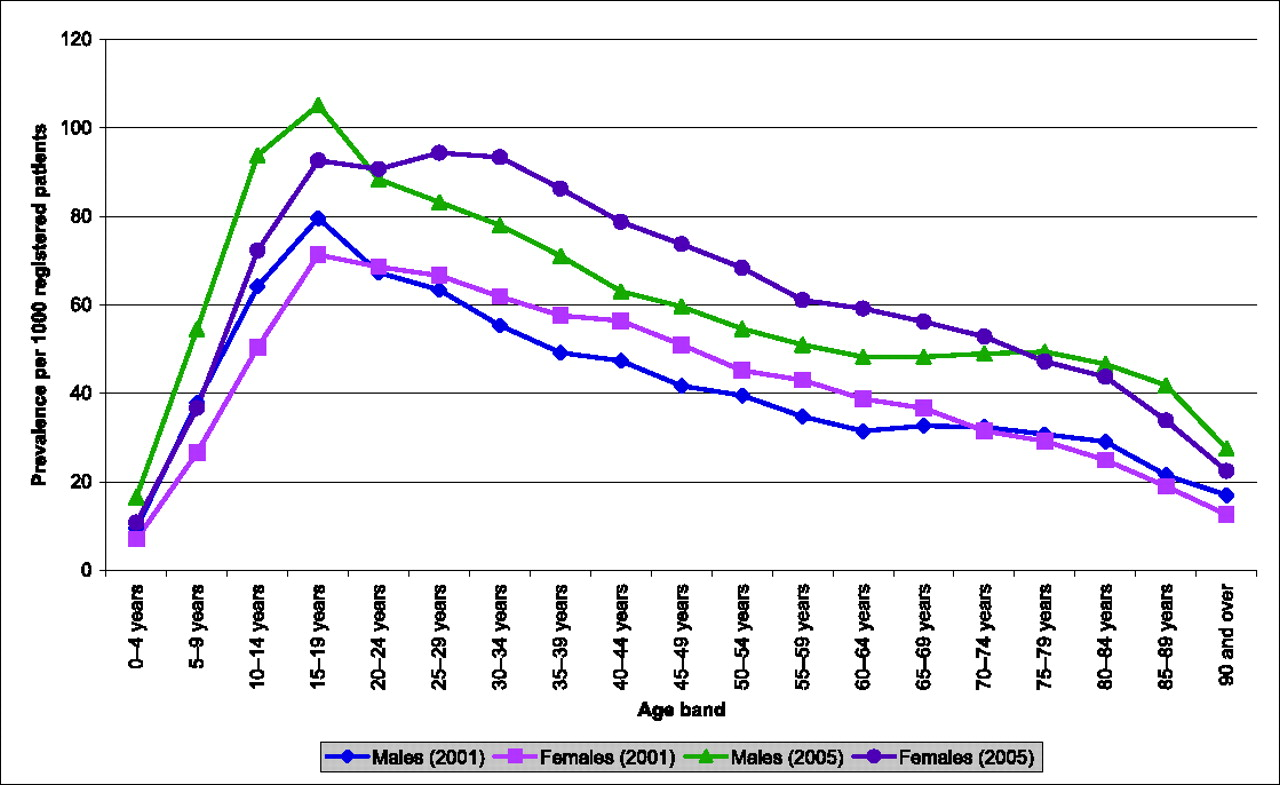
In order to describe trends in prescribing of antihistamines and nasal preparations of anti-allergic medication, for each of the five years we extracted linked prescribing data in those with a recorded diagnosis of allergic rhinitis and estimated numbers of prescriptions prescribed for both antihistamines and other more specific drugs used for the treatment of nasal allergy listed in chapter 12.2.1 of the British National Formulary (topical nasal corticosteroids, topical nasal antihistamines and topical nasal cromoglicate). Not all patients issued prescriptions in general practice actually present them to pharmacies for dispensing; estimates based on issued prescriptions may therefore be different from Prescribing Analysis and Cost (PACT) data.
We used the Chi Square Mantel-Haenszel test for trend using Epi Info software to test for trends over time. 12
Results
Age-sex standardization of lifetime prevalence of allergic rhinitis and changes over time
Figure 1 shows how the lifetime prevalence of allergic rhinitis varied by age for both sexes in 2001 and 2005. There is a sharp increase in the lifetime prevalence in males and females during the first two decades of life, with peak lifetime prevalence occurring in the 15–19 years age group. Thereafter lifetime prevalence steadily declined in both sexes. The highest lifetime prevalence rate was noted for males aged 15–19 in 2005 at 105.1 per 1000 (95% CI 103.1 to 107.2 per 1000). Whilst lifetime prevalence of allergic rhinitis was higher in males than in females before the teenage prevalence peak, in the years that follow, female prevalence exceeds that of males.
Table 1 details the age–sex standardized lifetime prevalence rate of allergic rhinitis for each of the five years of interest, showing a steady increase in life time prevalence with an overall 43.2% increase in recorded lifetime prevalence of allergic rhinitis per 1000 patients over this time period. The chi-square Mantel-Haenszel test was 12,352 (p<0.001) for lifetime prevalence, indicating a significant positive trend from 2001–2005.
Incidence rate of allergic rhinitis and changes over time
Table 2 details the incidence rate per 1000 person-years of allergic rhinitis for each of the five years of interest, these data showing an overall 33.0% increase during the period 2001–2005. The Chi Square Mantel-Haenszel test was 1110 (p<0.001) for incidence rates, indicating a significant positive trend from 2001–2005.
Consultation rates for allergic rhinitis
Incidence rate (and 95% CI) of allergic rhinitis per 1000 patient-years, 2001–2005
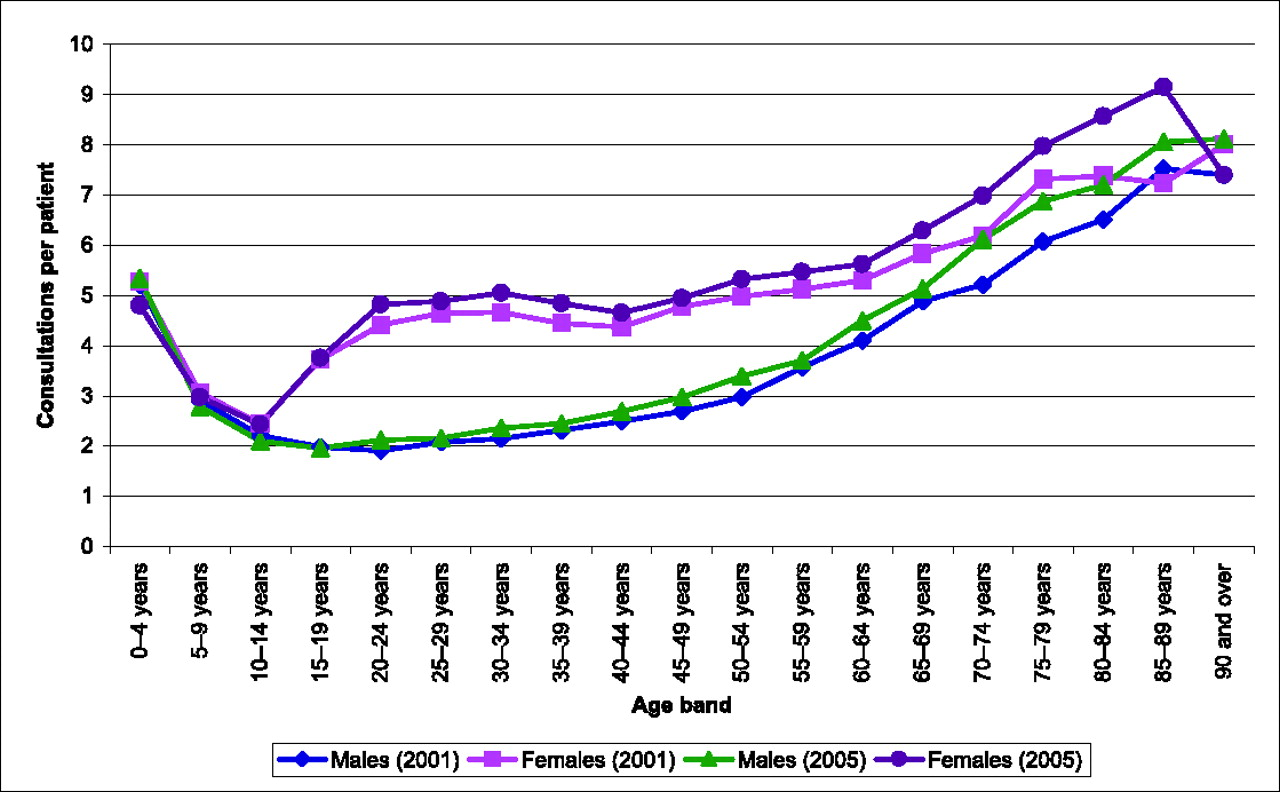
Consultation rates for allergic rhinitis (regardless of the reason for encounter) per patient by clinician
Figure 3 shows GP consultation rates per patient (regardless of the reason for consultation) for allergic rhinitis broken down by age and sex.
Trends in prescribing of antihistamines and drugs used in nasal allergy
Table 4 details the estimated numbers of community prescriptions for antihistamines and drugs used for nasal allergies in patients with allergic rhinitis throughout England for each of the five years. Overall, for these drugs there has been an increase of 41.7% in the number of prescriptions issued (antihistamines 45.5%, drugs used in nasal allergies 35.5%).
Discussion
This study of routine data from one of the world's largest national datasets reveals a large, significant increase in recorded incidence and lifetime prevalence of allergic rhinitis in primary care in England during the period 2001–2005. This has been associated with an increase of similar proportion in the issuing of prescriptions of prescribed treatments for allergic rhinitis.
Considering findings in relation to the published literature
Table 5 summarizes previous published epidemiological data for allergic rhinitis. Data from our work show that lifetime clinician-recorded prevalence peaks in the teenage years, and these results are in keeping with data from latest ISAAC study data. 2 However, one major difference is the change in prevalence of allergic rhinitis in teenagers between these two studies. Whilst ISAAC Phase Three shows a small fall in period prevalence from Phase One for self-reported symptoms of allergic rhinitis, our data show an increase in lifetime prevalence for a recorded diagnosis of allergic rhinitis. This discordance may reflect improved diagnosis and recording. The female preponderance for prevalence and increased consultation rates for females after the teenage years has also been identified in recent UK data describing presentation of allergic rhinitis in primary care . 13
The significant increases in recorded incidence and lifetime prevalence of allergic
rhinitis may be multifactorial. There may have been recent increased clinician
awareness of allergic rhinitis, which may then have led to improved identification
and recording of allergic rhinitis. Equally, Overall consultation rates compared with those for allergic rhinitis, for
all GP and nurse consultations in 2005. Includes all consultations
regardless of the reason for the encounter. © QRESEARCH 2006 GP consultation rates per patient for allergic rhinitis. © QRESEARCH
2006
Main strengths and limitations of this work
Estimated number of patients with allergic rhinitis who had a prescription for antihistamines and drugs used in nasal allergy in the past 12 months by year
There are a number of limitations that need to be considered when using databases of routinely collected data and these all potentially apply to this work. Most importantly, we were dependant on physician-recorded diagnosis of allergic rhinitis and there may have been improvements in recording of allergic rhinitis over this time period. The relatively short time window over which trends were studied is another limitation, but this does also have the advantage of confining analysis to a period during which there were no changes in disease definition or classification. Data regarding childhood prevalence may be underestimated, as clinician recording of diagnosis will be dependent on parents bringing their children for consultation. This is a recognized problem when using routine general practice data for research, and has been highlighted by previous research using general practice data. 15
Conclusions and implications for future research
Comparison of UK epidemiological data for allergic rhinitis
Footnotes
DECLARATIONS
Footnotes
Acknowledgements
We would like to record our thanks to the contributing EMIS practices and patients and for EMIS for providing technical expertise in creating and maintaining QRESEARCH. We thank QRESEARCH staff (Govind Jumbu, Alex Porter, Justin Fenty, Mike Heaps and Richard Holland) for their contribution to data extraction, analysis and presentation. We also thank Dr Chantelle Anandan, Research Fellow, University of Edinburgh for contributing to statistical analysis of data. These findings have been reported in Primary care epidemiology of allergic disorders: analysis using QRESEARCH database 2001–2006, which is published by the NHS Health and Social Care Information Centre