
Abstract
Summary
Objective
Consultants employed by the NHS in England are allowed to undertake private practice to supplement their NHS income. Until the introduction of a new contract from October 2003, those employed on full-time contracts were allowed to earn private incomes no greater than 10% of their NHS income. In this paper we investigate the magnitude and determinants of consultants' NHS and private incomes.
Design
Quantitative analysis of financial data.
Setting
A unique, anonymized, non-disclosive dataset derived from tax returns for a sample of 24,407 consultants (92.3% of the total) in England for the financial year 2003/4.
Main outcome methods
The conditional mean total, NHS and private incomes earned by age group, type of contract, specialty and region of place of work.
Results
The mean annual total, NHS and private incomes across all consultants in 2003/4 were £110,773, £76,628 and £34,144, respectively. Incomes varied by age, type of contract, specialty and region of place of work. The ratio of mean private to NHS income for consultants employed on a full-time contract was 0.26. The mean private income across specialties ranged from £5,144 (for paediatric neurology) to £142,723 (plastic surgery). There was a positive association between mean private income and NHS waiting lists across specialties.
Conclusions
Consultants employed on full-time contracts on average exceeded the limits on private income stipulated by the 10% rule. Specialty is a more important determinant of income than the region in which the consultant works. Further work is required to explore the association between mean private income and waiting lists.
Introduction
Until the introduction of a new contract from October 2003, consultants working in the National Health Service in England were paid a fixed NHS salary. Bonus payments in the form of distinction awards and discretionary points were used to reward excellence in clinical practice, research, teaching, contributions to health policy and management. Consultants with a full-time NHS contract were allowed to undertake private practice, but were limited to earning a private income no higher than 10% of their NHS income – the so-called ‘10% rule’. Those employed on part-time contracts, including the ‘maximum part-time’ contract where consultants receive ten-elevenths of a full-time salary, were allowed to undertake unlimited private practice.
Concerns were expressed with this system by the House of Commons Health Select Committee
1
in terms of: The complexity of and lack of transparency in the contractual arrangements The wide variation in the amount of NHS work undertaken by consultants The inadequate use of job plans and the lack of a rigorous appraisal system The large number of NHS work commitments not being met The lack of accurate and independent data on consultants' NHS and private activity The potential for conflicts of interest arising from private practice.
With respect to the last item, the Health Select Committee identified three potential problems. First, that ‘lucrative private practice can tempt consultants away from their NHS work to the extent where they fail to meet their contractual obligations to the NHS’. Second, that ‘NHS consultants who work in the private sector have perverse incentives to keep their NHS waiting times high in order that that demand for private work is stimulated.’ Third, that the system is inequitable because ‘patients able to pay for their treatment privately can queue-jump patients on the NHS, irrespective of their comparative clinical needs.’ 1
The Health Select Committee's recommendations with respect to private practice included inter alia systematic collection of activity data for consultants working in the NHS and the private sector, more rigorous monitoring of the 10% rule for full-timers, and a ‘long term objective that consultants in the NHS should not undertake private practice.’ 1
After prolonged negotiations a new consultant contract was introduced in England from November 2003. In many circumstances pay increases under the new contract were backdated, in some cases back to April 2003. 2 The new contract applies to all new consultants and to existing consultants who chose to accept it. Under the new contract there is no restriction on private income, but undertaking private practice at the expense of NHS work can affect pay progression. Additionally, underpinning the new contract is a code of conduct on private practice which sets out standards for best practice in managing private and NHS work. 3 The purpose of the code is to encourage openness and transparency with respect to private sector commitments, and consultants are required to disclose details of their private practice. It has been argued that financial incentives with respect to private practice have changed little under the new contract. 4
In view of the concerns expressed about potential conflicts of interest between NHS work and private practice, we investigated consultants' NHS and private activity. Since direct measures of activity (e.g. hours) are not available, 1 we focused instead on NHS and private incomes; our aim in this paper is to examine the magnitude and variation of these. The analysis is undertaken using a unique, anonymized, non-disclosive dataset on consultants' income derived from tax returns held at Her Majesty's Revenue and Customs (HMRC). Our analysis has four components. First, we calculate the total income earned by consultants in England and disaggregate this into NHS income and private income. Second, we calculate the ratio of private income to NHS income and examine this with respect to the 10% rule. Third, we investigate the determinants of NHS and private income and see how these vary by age, contractual status, specialty and region of place of work. Fourth, we examine the association between private income and NHS waiting lists.
Methods
Data and variables
Our main data source is a dataset of consultants' annual income based on anonymized, non-disclosive data derived from tax returns for the financial year 2003/4 held by HMRC. The dataset includes hospital consultants and those working outside of hospitals, including consultants in public health medicine and dental public health and those working in community health services. These data were linked to the 2003 NHS Medical and Dental Workforce Census held at the Information Centre for Health and Social Care
5
,
6
by HMRC statisticians to produce an anonymized, non-disclosive dataset for statistical analysis containing the following individual level variables: Total schedule E income (employment income, defined as the total amount of schedule E income from all sources for a doctor, comprising pay plus expenses plus benefits plus taxable lump sums minus expenses) Total schedule D income (self-employed income, defined as the total amount of schedule D income from all sources for a doctor, comprising net business profits for tax purposes) Total income (defined as total schedule E income plus total schedule D income) Age band (≤40 years, 40–44 years, 45–49 years, 50–54 years, 55–59 years, ≥60 years) Contractual status (full-time, part-time, maximum part-time). Part-time is defined as being contracted for up to nine-elevenths of full-time plus allowed to do unlimited private practice; maximum part-time is defined as being contracted for ten-elevenths of full-time plus allowed to do unlimited private practice Pay scale Specialty description Specialty group number and description Government Office Region code and name of place of work Strategic Health Authority (SHA) code and name of place of NHS employment.
Access to the anonymized dataset was granted by statisticians at HMRC at the request of the Department of Health on behalf of the researchers, who were required to sign and comply with official agreements on data security. The dataset was held by statisticians in HMRC and was analysed in their offices. The researchers were not allowed to take away the data or any results that would have identified individual consultants. Also, access was restricted; the researchers are unable to return to the dataset, with the result that further interrogations of the data are not possible.
The assembled dataset contains anonymized, non-disclosive data for 24,407 consultants in England. According to the 2003 NHS Medical and Dental Workforce Census there were 28,750 consultants employed in England at 30 September 2003. 5 , 6 Excluding those employed on honorary contracts (2139) and fixed-term consultants (179) gives a total of 26,432 consultants; our sample comprises 92.3% of this total. There were 2025 (7.7%) missing observations: 852 (3.2%) consultants were in the 2003 NHS Medical and Dental Workforce Census but could not be traced by statisticians at HMRC; 100 (0.4%) were excluded due to incomplete geographical data in the 2003 NHS Medical and Dental Workforce Census; 671 (2.5%) did not have a self-assessment tax return for 2003/4 at the time the dataset was created; 92 (0.3%) reported earning some Schedule D income but no Schedule E income; 132 (0.5%) reported earning schedule D income where the accounting period was missing or was not equal to 12 months; 16 (0.1%) reported earning schedule D income where the accounting period ended before or after the financial year 2003/4; and 162 (0.6%) had inconsistencies in the data recorded, so according to the normal practice of HMRC statisticians their data were excluded. Analyses are based on raw sample data; no adjustments have been made to reflect missing observations.
All consultants in the dataset were included in the 2003 NHS Medical and Dental Workforce Census, and were therefore employed by the NHS. We therefore defined schedule E (i.e. employment) income as ‘NHS income’. Note this includes distinction awards and discretionary points. Schedule D (i.e. self-employed) income is defined as ‘private income’. Note that private income may include income that is unrelated to medical service. Private income is assumed to have been earned in the SHA of place of NHS employment.
Data on waiting lists by specialty and by SHA were taken from provider-based hospital waiting lists in England in 2003/4 quarter four, obtained from the KH07 quarterly return submitted to the Department of Health by NHS Trusts. 7 These data include those waiting to be admitted to NHS hospitals in England as either a day case or as an ordinary admission. The figures used were for the number of patients waiting for three or more months.
Analysis
Using anonymized, non-disclosive individual level data for each consultant, we computed the conditional mean income earned by consultants in each age group, employed on each type of contract, and working in each specialty and each SHA of place of work. This gives the mean income for each group (e.g. each age group), conditional on all the other factors (e.g. controlling for type of contract, specialty and SHA). The calculations were based on three separate regression models regressing each of the three types of income (total income, NHS income, private income) against age group, type of contract, specialty and SHA of place of NHS employment (see the online Appendix for further details). We included in the analysis, but do not report figures for, specialties in which there are fewer than 30 observations.
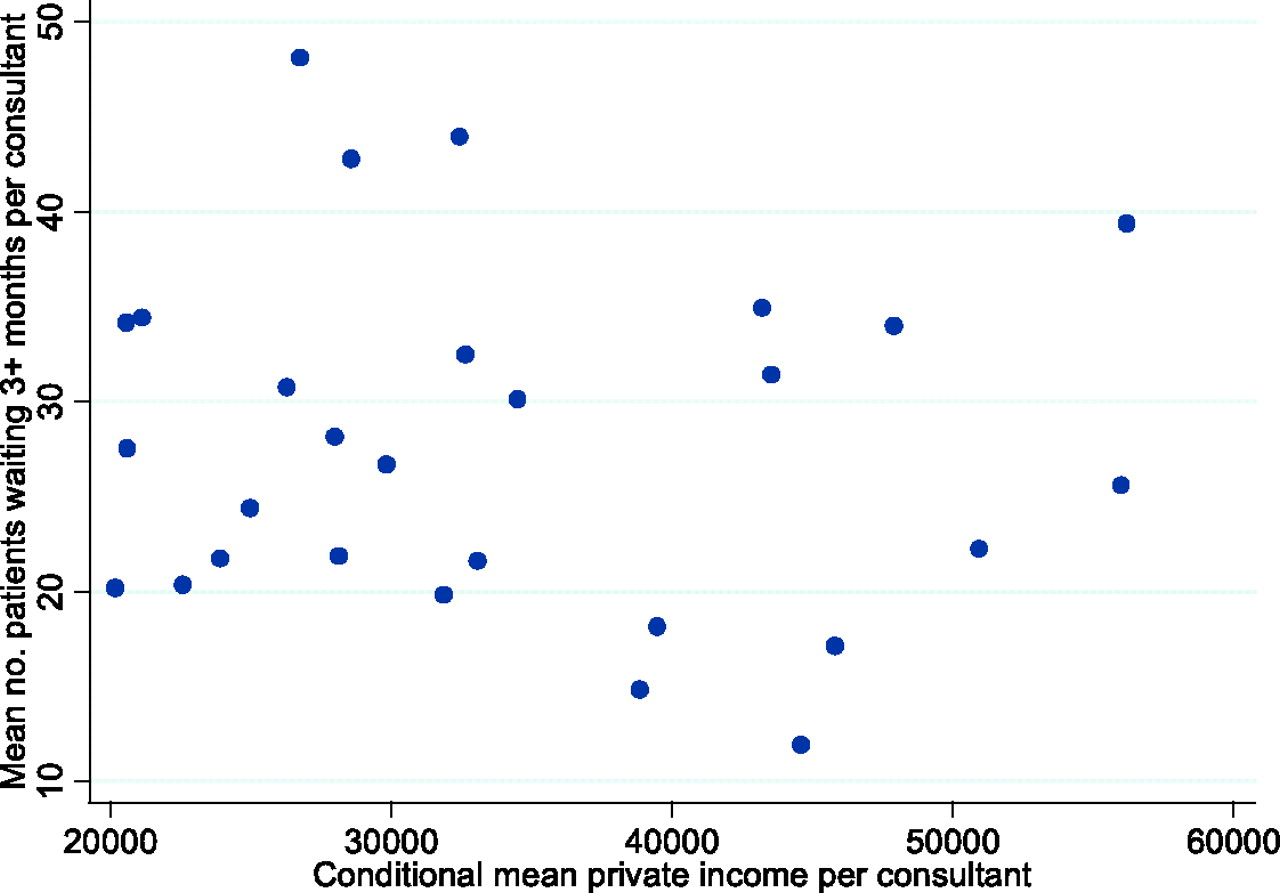
We related private income to waiting lists by plotting the mean number of patients per consultant waiting three or more months for a day case or ordinary admission against the conditional mean private income per consultant in each specialty and in each SHA. We assess the strength of the associations using Kendall's τb. 8
Results
The mean total income across all consultants in England in 2003/4 was £110,773. The mean NHS income was £76,628 and the mean private income was £34,144. The ratio of mean private income to mean NHS income was 0.45. Summary statistics for all the variables in the dataset are in Table A1 in the Appendix, which is available in full online.
Unconditional mean incomes by age group, contractual status, specialty and SHA of place of NHS employment are in Table A2 in the Appendix. The regression results used to compute conditional mean income are in Table A3 in the Appendix. Total, NHS and private incomes vary by age group, contractual status, specialty and SHA of place of work. The explanatory variables explain 24–27% of the variation in the income measures.
Conditional mean income by age group
The figures are conditional on type of contract, specialty and SHA of place of NHS employment.
Ratio of conditional mean private income to conditional mean NHS income.
Conditional mean income by type of contract
The figures are conditional on age group, specialty and SHA of place of NHS employment.
Ratio of conditional mean private income to conditional mean NHS income.
Conditional mean income by specialty, sorted by ratio of private income to NHS income
The figures are conditional on age group, type of contract and SHA of place of NHS employment. Figures are not reported for the following specialties, for which there are fewer than 30 observations: additional dental specialties; allergy; blood transfusion; clinical cytogenetics and molecular biology; clinical pharmacology and therapeutics; clinical physiology; community health service dental; general (internal) medicine; medical ophthalmology; oral surgery; paediatric dentistry; periodontics; prosthodontics; tropical medicine.
Ratio of conditional mean private income to conditional mean NHS income.
Conditional mean income by SHA of place of NHS employment, sorted by ratio of private income to NHS income
The figures are conditional on age group, type of contract and specialty.
Ratio of conditional mean private income to conditional mean NHS income.
The figures plot the mean number of patients per consultant waiting three or more months in each specialty ( Scatterplot of mean numbers of patients per consultant waiting three or more months for a hospital admission in each specialty by conditional mean private income per consultant in each specialty Scatterplot of mean numbers of patients per consultant waiting three or more months for a hospital admission in each SHA of place of NHS employment by conditional mean private income per consultant in each SHA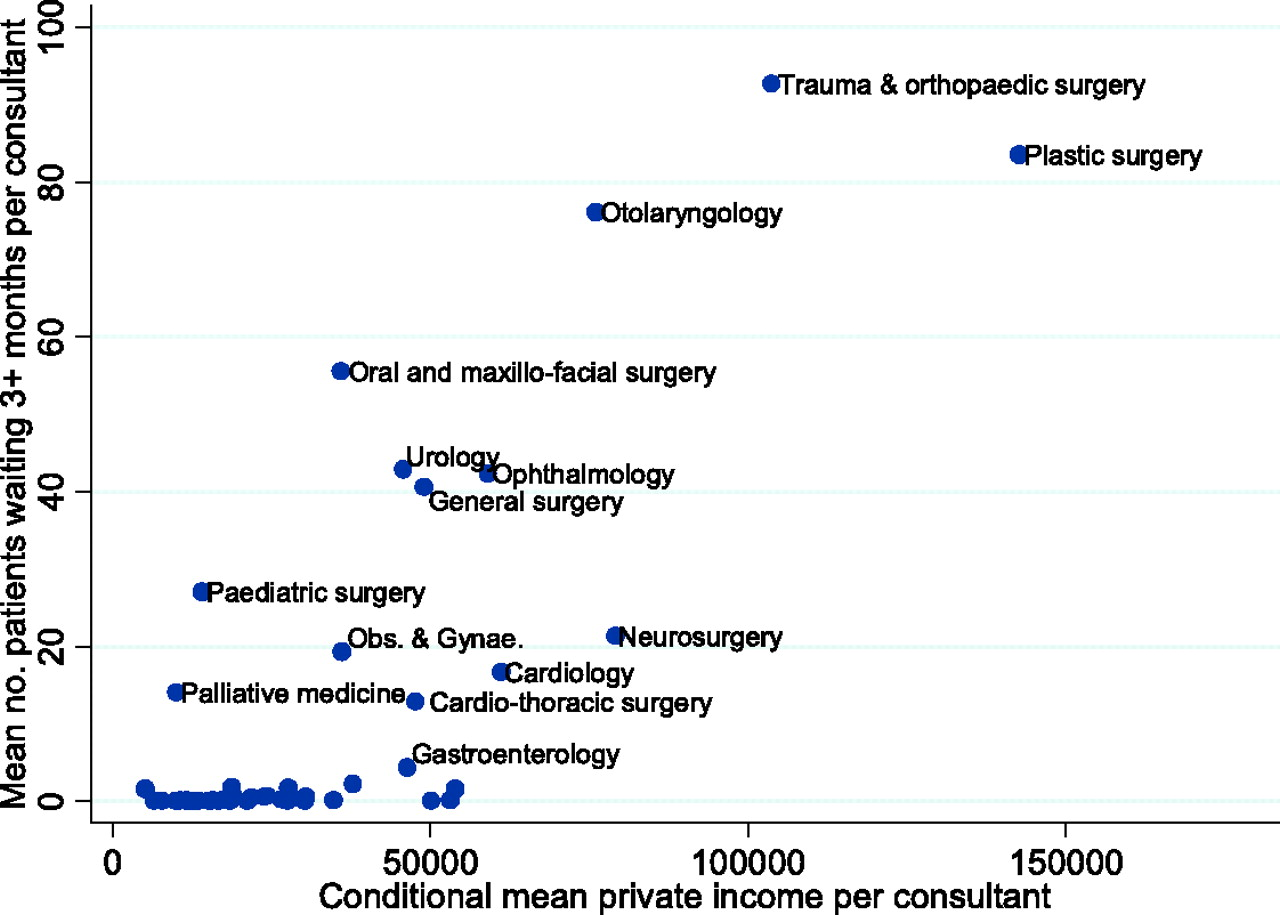
Discussion
In this study we found that the average consultant in England earned a total income of £110,773 in 2003/4. Sixty nine percent of this (£76,628) was NHS income and 31% (£34,144) was private income. The ratio of private income to NHS income across all consultants was 0.45. For those employed on a full-time contract it was 0.26. This exceeds the limit stipulated by the 10% rule, and appears to endorse concerns raised by the Health Select Committee about the poor enforcement of this rule.
This finding echoes the results of earlier research. A survey conducted by the Monopolies and Mergers Commission in 1993 showed that some consultants spent substantial amounts of time each week undertaking private practice: around 60% of consultants undertook private practice alongside their NHS work; around 80% of these spent between 5 and 15 hours per week in private practice, 10% worked for 15–19 hours and 10% worked for more than 20 hours per week. 9 Evidence presented by the King's Fund to the Health Select Committee 10 reported median Schedule E and Schedule D incomes for full-time and maximum part-time consultants in 1993/4 based on Inland Revenue data. The evidence showed that on average full-time consultants exceeded the 10% rule. The King's Fund reported that ‘[t]he data for full-time consultants show that many of them must have been earning more than the allowed 10 per cent over and above their NHS incomes: that is, they were breaking the terms of their contracts. The data for maximum part-time consultants show that they are undertaking an amount of work that almost doubles their incomes, as they are allowed to do.’
The finding that the 10% rule has been breached has resonance in other areas of doctors' pay. For instance, since 2003 general practices in the UK have had their pay determined in part by the quality of the care they provide, based on quality indicators in the Quality and Outcomes Framework. The negotiated contract included a clause that ‘[a] system of exception reporting will be put in place to ensure that practices providing a quality service will not lose out on quality payments through factors outside their control’ and that this scheme ‘will be measured within a high trust system developed to strike a balance between monitoring and demonstrating that standards have been achieved’. 11 Gravelle et al. 12 have subsequently shown that there is evidence of gaming, as practices attempt to increase their revenue by artificially inflating the number of patients they ‘exception report’ as unsuitable for inclusion in the assessment of the quality of their services.
The 10% rule is still likely to have been exceeded by the average full-time consultant if we allow for the fact that pay increases under the new contract could be backdated to April 2003 (which means that the data in our study may include NHS income earned under the new contract). For consultants who did not backdate their pay the ratio of private income to NHS income reported here is the value under the old contract. For consultants who did backdate their pay the increase is included in the ratio of private income to NHS income. Since only NHS pay increases were backdated this suggests that NHS income would be lower if backdated pay was not included and hence the ratio of private income to NHS income would be higher under the old contract.
We also found in our study that total, NHS and private incomes vary by age group, contractual status, specialty and SHA of place of work. Consultants employed on maximum part-time contracts earn significantly higher private and total incomes and significantly lower NHS incomes than those employed on full-time contracts. Previous research suggests that consultant surgeons employed on maximum part-time contracts have significantly higher NHS activity rates than those employed on full-time contracts. 13 This implies that maximum part-timers undertake significantly more NHS activity than full-timers for significantly less NHS pay. It also implies that while their private income is greater than that of full-timers, maximum part-timers who undertake private activity do not appear to do so at the expense of NHS activity.
The figures for NHS income include distinction awards. Evidence for 2002 suggested that consultants in psychiatry, obstetrics and gynaecology, anaesthetics, radiology and pathology were less likely to receive distinction awards than other consultants. 14 Ranking the specialties in Table 3 by NHS income reveals that this does not appear to have reduced the group mean NHS income earned by these consultants.
We acknowledge a number of limitations with our study. First, the analysis is derived from individual tax records of schedule E and schedule D incomes. A potential weakness is that private income is measured using schedule D income, and this may include self-employed income that is unrelated to medical service. This might include, for example, income from medicolegal work or research for the private sector. Important strengths of the data are that it covers over 90% of consultants working in the NHS in England in 2003/4 and that while tax data are self reported, unlike other self reported income data, reporting is required under law; failure to report accurately is an offence, and tax returns can be audited. These factors mean that the earnings figures used in this study are unlikely to be compromised by measurement error, which is a common problem with other earnings data. 15
Second, while it contains rich data on consultants' income, the dataset has only a limited number of explanatory variables. Additional variables that might also affect income include gender (in 2003 25% of consultants were female), country of qualification (35% qualified outside the UK) and ethnic group (47% were from non-white ethnic groups). 5 , 6 These have been shown to affect consultants' earnings in previous studies. 16
We found a positive association between mean private income and waiting lists across specialties, which is driven by a small number of specialties. However, the scatterplots of waiting lists against private income only provide a measure of the association between these two variables; causality cannot be inferred. It may be the case that private income has a positive impact on waiting lists because private practice is undertaken at the expense of NHS work, or because consultants have pecuniary incentives to keep NHS waiting times high to maintain demand for their private sector work. On the other hand causality may run in the opposite direction, as the existence of NHS waiting lists may encourage patients to buy private health care. We recommend that further research is undertaken to investigate the relationship between consultants' private practice and waiting lists.
This study is based on anonymized HMRC data for the financial year 2003/4, which was the last year before the new consultant contract was introduced. Our results provide a baseline to assess the impact of the new contract on the incomes of consultants in England. We recommend that, in the interests of transparency and accountability, datasets on income such as the one used in our study should, with appropriate safeguards, be made available for future use by researchers.
Footnotes
DECLARATIONS
Footnotes
Acknowledgements
This study was commissioned by the Advisory Committee on Resource Allocation at the Department of Health as part of its review of the Staff Market Forces Factor. We are grateful to the Health and Social Care Information Centre and statisticians at Her Majesty's Revenue and Customs for assistance with data. The views expressed are those of the authors and not necessarily those of the ACRA, the DoH, the HSCIC, or HMRC. We thank Robin Dowie at the Health Economics Research Group, Brunel University for her advice and support. An earlier version of this paper was presented at the Health Economists' Study Group meeting held at the University ofBirmingham, UK in January 2007. We thank James Raftery and other participants at the meeting for their helpful comments