
Abstract
Background
Measurements of plasma normetanephrine (NMN) and metanephrine (MN) provide a sensitive test for diagnosis of phaeochromocytomas and paragangliomas (PPGLs), but do not allow detection of dopamine-producing tumours. Here we introduce a novel mass spectrometric based method coupled to ultraperformance liquid chromatography (LC-MS/MS) for measuring NMN, MN and 3-methoxytyramine (MTY), the O-methylated metabolite of dopamine.
Methods
Specific collision-induced fragment ions assessed by multireaction monitoring transitions were used for identification, with quantification according to signal intensities of analytes relative to stable isotope labelled internal standards. Results for solid-phase extracted samples from 196 subjects analysed by LC-MS/MS were compared with those analysed by liquid chromatography with electrochemical detection (LC-ECD). Concentration ranges in 125 volunteers were compared with those from 63 patients with PPGLs, including 14 with metastatic disease.
Results
The LC-MS/MS method showed linearity over four orders of magnitude with analytical sensitivity sufficient to measure to 0.02 nmol/L. Intra- and inter-assay coefficients of variation ranged from 2.8% to 13.5%. NMN and MN were respectively measured 17% and 10% higher and MTY 26% lower by LC-MS/MS than by LC-ECD. Medians and ranges for 3-methoxytramine, NMN and MN were respectively 0.08 (0.03-0.13), 0.35 (0.13-0.95) and 0.15 (0.07-0.33) nmol/L in volunteers. Among patients with PPGLs, plasma methoxytyramine was six-fold higher in patients with than without metastastases (1.09 versus 0.19 nmol/L) and in three patients was the only metabolite increased.
Conclusions
The LC-MS/MS method enables accurate, selective and sensitive measurements of catecholamine O-methylated metabolites that should be particularly useful for screening and management of dopamine-producing metastatic PPGLs.
Introduction
Phaeochromocytomas and paragangliomas (PPGLs) are catecholamine-producing tumours arising from adrenal and extra-adrenal chromaffin tissue. Measurements of plasma free metanephrines (PFM), the O-methylated metabolites of catecholamines, provide a highly sensitive test for diagnosis of the tumours.1,2 These measurements commonly include the noradrenaline metabolite, normetanephr-ine (NMN) also known as normetadrenaline, and the adrenaline metabolite, metanephrine (MN) also known as metadrenaline, Measurements of 3-methoxytyramine (MTY), the O-methylated metabolite of dopamine, have more recently been described for characterization of dopamine-producing PPGLs. 3 These measurements appear particularly useful for screening of PPGLs in patients with succinate dehydrogenase subunit B and D (SDHB/D) gene mutations 4 and identifying the presence of metastatic disease. 5
Liquid chromatography with electrochemical detection (LC-ECD) represents the earliest method developed for determination of PFM. 6 Although the method can also be used to measure MTY, analytical sensitivity and accuracy for this purpose is limited. Immunoassay-based methods provide another alternative,7–10 but do not allow measurements of MTY. With the introduction of mass spectrometry to clinical chemistry laboratories, this detection system commonly coupled to liquid chromatography (LC-MS/MS) has become increasingly used for measurements of PFM.11–15
The solid phase extraction (SPE) procedures usually employed for LC-MS/MS are simpler than those required for LC-ECD, in some methods enabling online sample preparation.13,16 Analytical sensitivity of mass spectrometers has also been steadily increasing, not only allowing more accurate quantification of PFM, but also of MTY,13,16 which is usually present in plasma at concentrations below 0.1 nmol/L.
With the above considerations in mind, our aim was to develop an LC-MS/MS method with analytical sensitivity sufficient not only for measuring plasma PFM, but also MTY. We compared and validated the method against our routine LC-ECD method, with additional validation achieved through participation in an international quality assurance programme described elsewhere. 17 Furthermore, we validated reference intervals for the method using blood samples obtained from 125 volunteers and established preliminary diagnostic utility of the method using samples obtained from 63 patients with PPGLs, including 14 with metastatic involvement.
Materials and methods
Materials
Instrumentation included an AB Sciex QTRAP 5500 triple quadrupole mass spectrometer coupled to an Acquity ultra-performance liquid chromatography > (UPLC) system from Waters Corporation. The latter was equipped with a binary solvent manager, a sample manager, a column manager, an Acquity UPLC® HSS T3 column (1.8 μm, 2.1 × 100 mm) and guard column (Waters Corp.). Sample preparation was achieved using a Positive-Pressure-96 Processor with SPE on OASIS® MCX-96 well plates (30 μn, 10 mg), all from Waters.
MTY, NMN and MN were from Sigma-Aldrich. 3-Methoxytyramine-α,α,β,β-D4. HCI (d4-MTY), DL-normetanephrine-α-D2, β-D1. HCI (d3-NMN) and DL-metanephrine-α-D2, β-D1 . HCI (d3-MN) were from Medical Isotopes Inc. Working solutions of standards were prepared in 0.2 mol/L acetic acid from Merck. LC-MS/MS grade acetonitrile and methanol were from Merck. Ammonium acetate was from Sigma-Aldrich.
Human subjects
Plasma samples were obtained from 125 normotensive and hypertensive volunteers and 229 patients investigated for routine and research purposes. Blood was collected by venipuncture into heparinized tubes after an overnight fast and at least 20 min of supine rest. Blood was kept on ice until centrifuged, with plasma separated and stored at -80°C until analysed.
The normotensive and hypertensive volunteer group included 79 women and 46 men with a median age of 41.1 y (range 19-78) selected according to the criteria outlined in the Prospective Monoamine-producing Tumour (PMT) study protocol. In brief, these criteria covered adult (>18 y) male and female healthy volunteers and patients with primary hypertension. Subjects with PPGLs included 35 women and 28 men with a median age of 52 y (range 20-82) at testing between September 2010 and March 2012. This group included 14 patients with malignant disease.
Diagnosis of PPGLs in patients who underwent operative removal of tumours was based on histopathological examination of resected specimens. In patients with metastatic disease who did not undergo surgical intervention, diagnosis was based on functional imaging demonstrating evidence of chromaffin cell metastases. This was usually further supported by either or both routine biochemical evidence of a catecholamine-producing tumour and a past history of a pathologically confirmed PPGL. Diagnosis of malignant disease was based on findings by conventional and functional imaging of metastases in liver, bones or lungs, and in some operated cases by findings of pathologically confirmed lymph node involvement.
All normotensive and hypertensive volunteers and patients investigated for research purposes provided written informed consent under a multicenter protocol (The PMT study) that covered screening of patients for PPGLs and which was approved by the intramural review boards at each participating institution. Inclusion of patients into the PMT protocol was based on suspicion of a PPGL according to several criteria: (1) risk of disease associated with a previous history of the tumour; (2) risk of disease due to a family history of PPGL or genetic mutations known to predispose individuals to develop PPGLs; (3) presence of an adrenal or retroperitoneal mass discovered incidentally during abdominal imaging studies; (4) new onset of hypertension or hypertensive episodes and/ or symptoms suggestive of PPGLs; and (5) presence of therapy-resistant hypertension.
Samples from patients undergoing routine diagnostic procedures at Dresden, who did not provide written consent, were also used for comparisons of LC-ECD and LC-MS/ MS methods. Use of data from these samples was approved by the Institutional Review Board of the Technical University of Dresden with an exemption from informed consent, subject to anonymity of the data.
Specimen processing
SPE 96-well plates were sequentially conditioned with methanol, de-ionized water and 10 mmol/L ammonium acetate buffer (pH 6.5), which were passed through the SPE material under positive pressure (60-80 psi) in volumes of 500 μL each. Wells were then loaded with 975 μL of 10 mmol/L ammonium acetate buffer, 20 μL of premixed internal standard (IS) solution (final concentrations 2.5-3 nmol/L) and 900 μL of plasma. Following positive pressure elution of samples, the SPE material was washed sequentially with 500 μL of 2% aqueous formic acid and 500 μL of methanol. The amine metabolites and IS, which remained retained on the SPE 96 material, were eluted into 96 deep well plates using two passes of 100 μL 5% ammoniacal methanol. After drying eluates in a vacuum-assisted centrifuge (Savant SC210A Speedvac Concentrator, ThermoFisher Scientific), residues in each well were reconstituted in 100 μL of 2% acetonitrile, 0.2% formic acid.
LC-MS/MS procedure
Calibrators (prepared by dilution of working standards in 2% acetonitrile, 0.2% formic acid) and SPE-purified samples were injected onto the UPLC column at a flow of 0.53 mL/min using a gradient of mobile phases A (0.2% formic acid in water) and B (0.2% formic acid in acetonitrile). A 2% proportion of mobile phase B over the first half minute following injection was increased linearly to reach 60% at 1.5 min and then 98% at 1.8 min. Column washing was completed at 2.5 min at which stage the gradient was reversed to reach the initial 2% proportion of mobile phase B at three minutes. This was followed by one minute of column equilibration. Column temperature was maintained at 25°C and sample manager temperature at 5°C.
Analytes were measured by the triple quadrupole mass spectrometer in multireaction monitoring (MRM) mode using positive electro-spray ionization (ESI). Expected mass/charge ratios (m/z), assumed as [M + H+], were respectively m/z 168, m/z 184 and m/z 198 and for MTY, NMN and MN. In agreement with others,11,13,14,18 a second larger ion signal, [M-NH3 + H+] for MTY and [M-H20 + H+] for NMN and MN, was observed during parameter optimization, which were finally used as precursor ion masses (Ql). MRM transitions are summarized in Table 1.
MRM transitions and respective fragmentation parameters
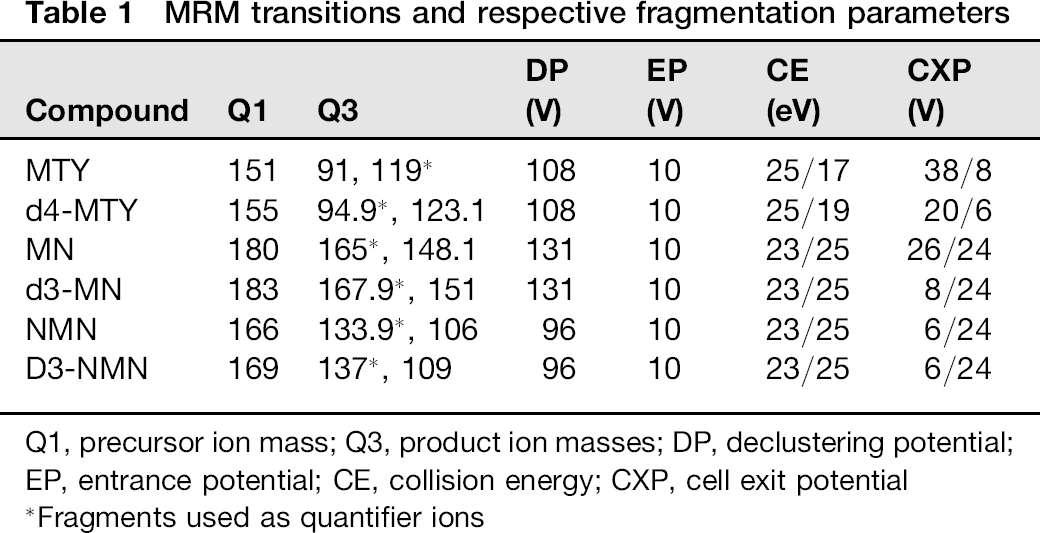
Q1, precursor ion mass; Q3, product ion masses; DP, declustering potential; EP, entrance potential; CE, collision energy; CXP, cell exit potential
Fragments used as quantifier ions
Optimization of compound dependent source and fragmentation parameters was performed by injection of single standards using the instrument-integrated syringe pump (Table 1). Ionization source (ESI) parameters were further optimized by automatic flow injection analyses provided by the Analyst software package (Version 1.51, AB Sciex) with curtain gas (30 psi), ESI voltage (5500 V), temperature (600°C), gas 1 (70 psi) and gas 2 (60 psi).
Method validation: ion suppression, analyte recovery and linearity
Since all validation procedures - including collections of plasma from reference and patient populations - were carried out using heparinized plasma, validation of the presented LC-MS/MS method is restricted to this sample matrix. Ion suppression or enhancement, a well known observation in mass spectrometric based methods, 19 was examined after injection of an SPE processed plasma sample by postcolumn infusion (10 μL/min) of d3-MN, d3-NMN and d4-MTY (0.50-0.60 μmol/L) via a T junction into the chromatographic eluate. MRM transitions for each IS were assessed over the course of the gradient.
Assessment of SPE recovery was performed by comparison of pre-extraction and postextraction spiked plasma samples in triplicate. Aliquots of plasma were each spiked with two levels of MTY, NMN and MN (0.5-3.0 nmol/L) and a single level of IS. These samples together with an equivalent series of unspiked samples were subjected to SPE. Following SPE, the latter unspiked samples were then spiked with equivalent amounts of standards and IS as used in pre-extraction spiked samples. Absolute recovery was calculated based on absolute peak areas of analytes from pre-extraction and postextraction spiked samples. Relative recovery was calculated using analyte/IS ratios.
Linearity of quantification was assessed using aliquots of pooled plasma spiked with 2.5-50.0 nmol/L of each analyte. Aliquots were diluted serially with charcoal-stripped plasma (containing non-detectable levels of metabolites) to obtain at least 12 concentration levels down to 0.020 nmol/L. Lower limits of quantification (LLOQ) and upper limits of quantification (ULOQ) were determined as the lowest and the highest measured concentrations with accuracies within 20% of expected concentrations.
Method validation: precision, interferences and carryover
Assay precision was evaluated using three plasma pools each spiked with a specific concentration of MTY, NMN and MN to achieve low, middle and high plasma concentrations of metabolites. Aliquots were stored at -80°C until use. Intra-assay variation was determined by measuring each level 12 times within a single run. Inter-assay variation was assessed by measurements over 40 consecutive runs over a nine-month period.
Since adrenaline and NMN have the same MRM transitions, the LC-MS/MS method was tested for interferences due to possible chromatographic co-elution of adrenaline. Samples in which chromatographic interference was demonstrable on LC-ECD, either due to paracetamol or unknown contaminants in samples from patients requiring haemodialysis for kidney failure, were also assessed by LC-MS/MS. Carryover was assessed using a sequence of injections of low, high and then low-level plasma extracts.
Method comparisons
A comparison study with an SPE-based LC-ECD method 6 was performed on 196 plasma samples, including 30 from patients with PPGLs. These samples were first subject to routine measurements by LC-ECD. As already established by de Jong et al., 16 plasma metanephrines remain stable through up to three repeated freeze/thaw cycles. Samples for this comparison study were derived from both normal, hypertensive and patient volunteers enrolled into the PMT study as well as other patients investigated solely for routine purposes. Agreement of the two methods was assessed using Bland-Altman plots. 20
Additional comparisons of results obtained by the LC-MS/MS method were also achieved through participation in an inter-laboratory proficiency programme, as described elsewhere, 17 and involving a total 22 analytical methods run by different laboratories. This programme returns results for both precision, based on coefficients of variation derived from six pairs of samples, and accuracy, as assessed by measures of bias relative to median results for all laboratories.
Statistics
Statistical analyses were carried out using the SPSS Statistics 19 software package. Because plasma concentrations of NMN and MN are non-normally distributed, all results are presented as medians. Spearman's test was used to examine significance of correlations and Wilcoxon and Kruskal-Wallis tests were used for respective comparisons between two or three groups. A Bonferroni-adjusted P value (Padjusted = 0.05/3 = 0.0167) was used to determine significance for the three pairwise comparisons possible for three groups. For all other differences a P < 0.05 was considered significant. Reference intervals were established using the 2.5 and 97.5 percentiles of distributions. Logistic regression was used to establish receiver-operating characteristic (ROC) curves.
Results
Chromatographic characteristics
Sequential chromatographic separation of NMN, MN and MTY was achieved within two minutes (Figure 1). With the additional two minutes required for column washing and re-equilibration, the total per sample run time was four minutes enabling all samples in each 96-well plate to be analysed within seven hours, a considerable reduction in time compared with the 64 h required to run the same number of specimens by LC-ECD.
Chromatographic separation of plasma free normetanephrine, metanephrine and 3-methoxytyramine. The solid chromatographic outline represents a calibrator (0.55 nmol/L NMN, 0.50 nmol/L MN, 0.60 nmol/L MTY), the dashed outline a quality control sample and the dotted line sample from a patient with metastatic PPGL (11.5 nmol/L NMN, 4.8 nmol/L MN, 1.2 nmol/L MTY). MTY, 3-methoxytyramine; NMN, normetanephrine; MN, metanephrine; PPGL, phaeochromocytomas and paragangliomas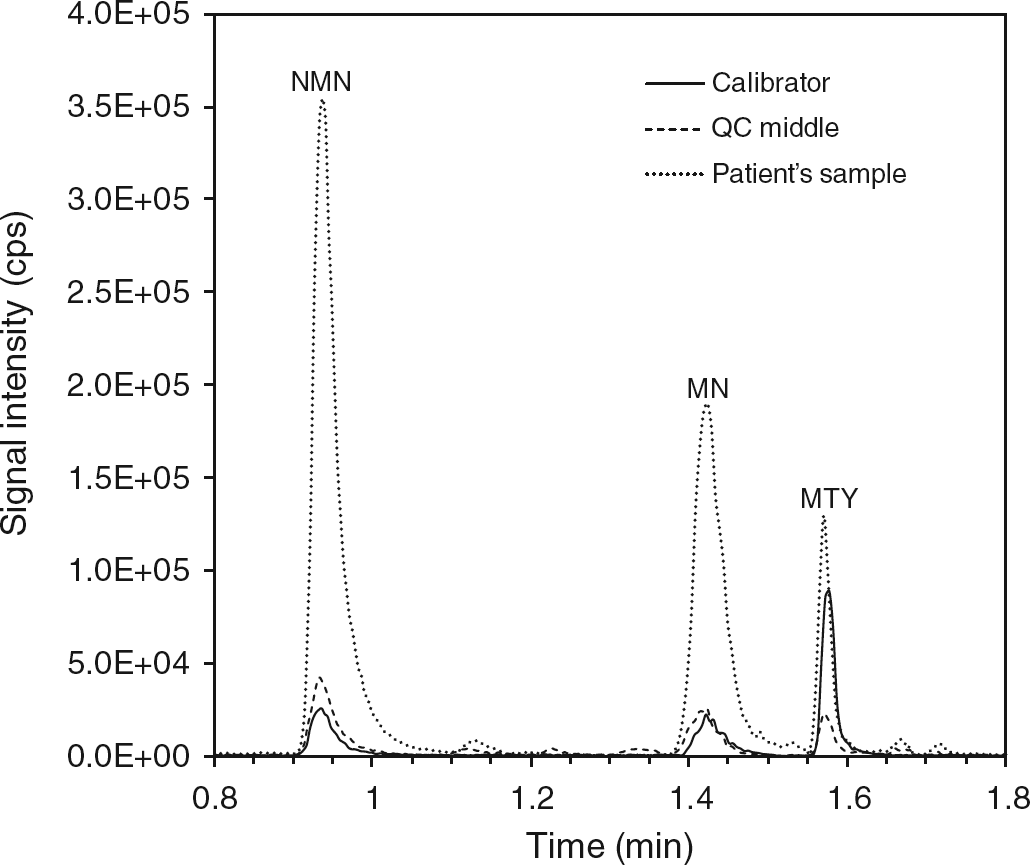
Ion suppression, analyte recovery and linearity
Postcolumn injection of IS into the chromatographic eluate after injection of plasma extracts onto the UPLC column revealed no problematic suppression or enhancement of the signals for any of the analytes over the ranges of their retention times (Supplementary Figure SI; please see http://acb.rsmjournals.eom/lookup/suppl/doi:10.1258/ acb.2012.012112/-/DCl).
Absolute recoveries of analytes, assessed by comparisons of pre- and postextraction spiked samples, were 66-83% for MTY, 74-93% for NMN and 90-93% for MN. IS-corrected recoveries were 106% for MTY, 96-104% for NMN and 102-103% for MN.
Measured concentrations of MTY, NMN and MN showed excellent linearity (r = 0.999) over the four orders of magnitude assessed using the extracts of serially diluted spiked samples of pooled plasma (Supplementary Figure S2; please see http://acb.rsmjournals.com/lookup/suppl/ doi:10.1258/acb.2012.012112/-/DCl). Respective averaged accuracies were 104% for MTY (range 96.8-114.7%), 97.5% for NMN (range 85.9-107.3%) and 102.5% for MN (range 93.2-118.1%). LLOQs for MTY, NMN and MN were respectively 0.024, 0.024 and 0.020 nmol/L, while ULOQs were 63, 55 and 56 nmol/L.
Precision, accuracy, interferences and carryover
Intra-assay coefficients of variation ranged from 2.9% to 5.6% for MTY and NMN and up to 13.5% for MN, while inter-assay coefficients of variation ranged from 7.9% to 8.4% for NMN and from 6.7 to 11.7 for MN and MTY (Table 2). Additional assessment of assay precision through participation in an international quality assurance programme returned coefficients of variation for MTY, NMN and MN equal to or below 4.3% (Supplementary Table S1; please see http://acb.rsmjournals.com/lookup/ suppl/doi:10.1258/acb.2012.012112/-/DC1). Findings of minimal bias, particularly for MTY and NMN, furthermore verified accuracy of the method.
Intra- and inter-assay variation coefficients
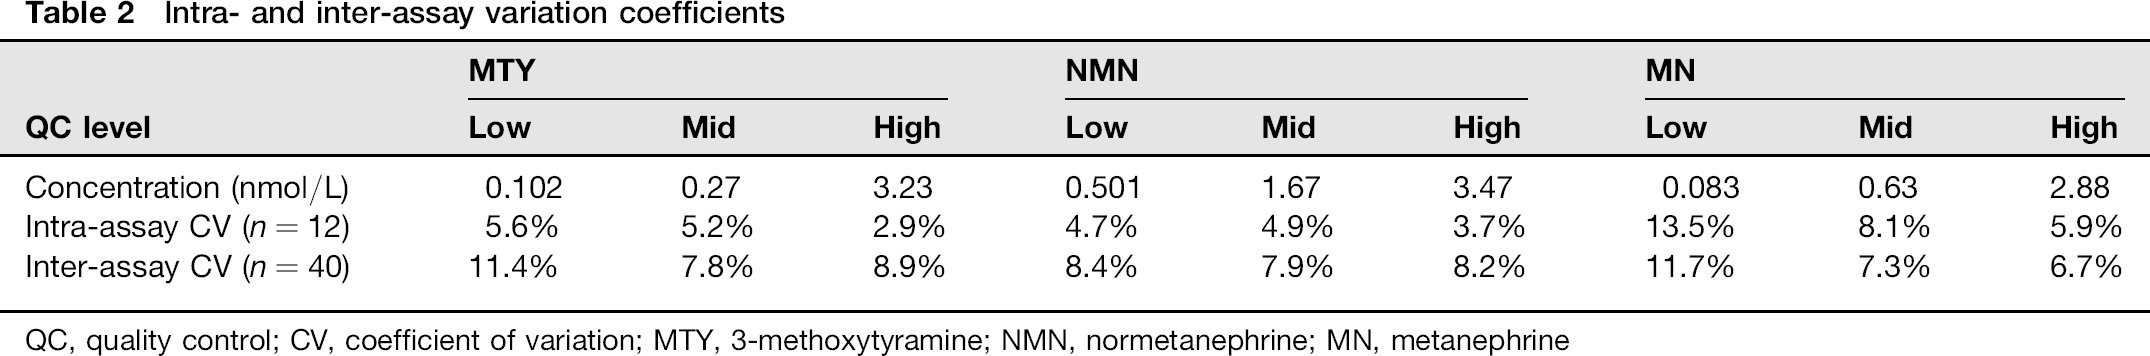
QC, quality control; CV, coefficient of variation; MTY, 3-methoxytyramine; NMN, normetanephrine; MN, metanephrine
Although adrenaline shared the same MRM transitions with NMN, the two analytes were baseline separated and there was no interference from adrenaline demonstrable upon direct injection (data not shown). Samples in which LC-ECD measurements of NMN were compromised by a chromatographic peak corresponding to acetaminophen showed no demonstrable interference upon analysis by LC-MS/MS (Supplementary Figures S3a and b; please see http://acb.rsmjournals.com/lookup/suppl/doi:10.1258/ acb.2012.012112/-/DC1). Furthermore, interference during LC-ECD measurements by commonly observed contaminating chromatographic peaks for samples from patients on haemodialysis was not demonstrable for LC-MS/MS measurements (Supplementary Figures S3c and d). No observable difficulties during SPE sample preparation or interference problems during LC-MS/MS analysis were apparent for haemolytic or lipaemic sample matrices.
There was no demonstrable carryover from injected samples containing high levels of analytes to subsequently injected samples.
LC-ECD method comparison
Comparisons of the 196 patients’ samples measured for O-methylated metabolites by both LC-MS/MS and LC-ECD indicated excellent agreement (P < 0.0001) between the two methods for measurements of plasma NMN and MN with respective regression coefficients of 0.95 and 0.85 (data not shown). Bland-Altman plots, however, revealed that NMN and MN were respectively measured 17% and 10% higher (P < 0.0001) by LC-MS/ MS than by LC-ECD (Figures 2b and c).
Bland-Altman difference plots for comparison of liquid chromato-graphy-tandem mass spectrometry and high-performance liquid chroma-tography-electrochemical detection measurements of MTY (a), NMN (b) and MN (c) with log-scaled x-axis established as mean values and y-axis established as the relative differences between the two methods, dotted lines represent the median. MTY, 3-methoxytyramine; NMN, normetanephrine; MN, metanephrine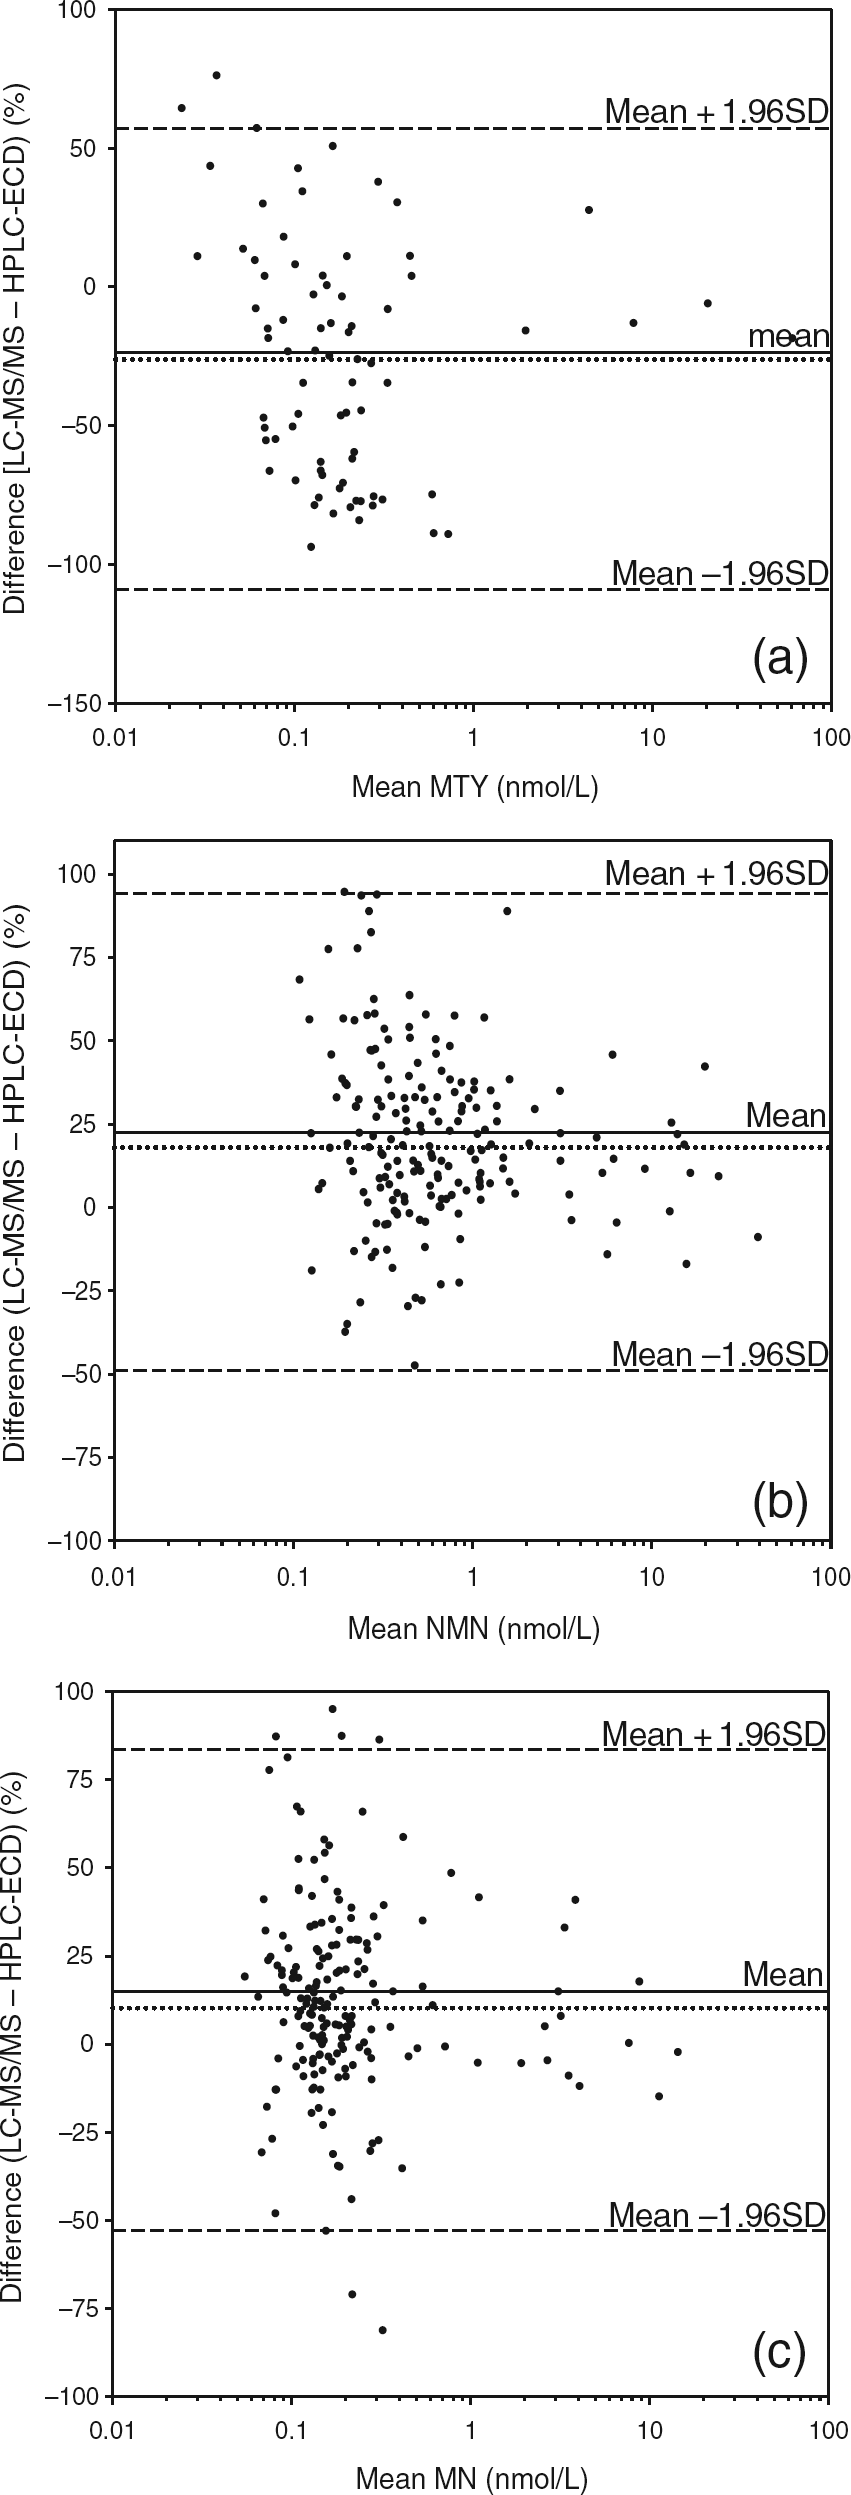
Plasma MTY was measured using LC-MS/MS in all 196 patients samples. However, due to late-eluting co-chromatographic peaks and the usually low plasma concentrations of MTY (<0.12 nmol/L), measurements of this analyte by LC-ECD were in many cases unreliable and only possible in 80 patients’ samples. For those samples in which MTY was measurable by both methods, there was a positive relationship (r = 0.635, P < 0.0001) between measured values by LC-ECD and LC-MS/MS, albeit with more scatter than for measurements of NMN and MN (data not shown). In contrast to results for NMN and MN, plasma concentrations of MTY were measured 26% lower (P < 0.0001) by LC-MS/MS than by LC-ECD (Figure 2a).
Direct injection onto our LC-MS/MS system of the calibrators used for LC-ECD measurements revealed no difference in measured values from those predicted based on calibrators used for LC-MS/MS.
Metabolite concentrations in volunteers and patients with PPGLs
Among the 125 volunteers, plasma concentrations of MTY ranged from 0.03 to 0.13 nmol/L (median 0.08), NMN from 0.13 to 0.95 nmol/L (median 0.35) and MN from 0.07 to 0.33 nmol/L (median 0.15) (Figure 3). Respective lower and upper cut-offs of reference intervals determined as the 2.5 and 97.5 percentiles were 0.04 and 0.13 nmol/L for MTY, 0.17 and 0.73 nmol/L for NMN and 0.08 and 0.31 nmol/L for MN. Age showed significant positive correlations with plasma concentrations of NMN (r = 0.374, P < 0.0001) and MTY (r = 0.289, P = 0.0011). There was also a weaker positive relationship between age and plasma MN (r = 0.192, P = 0.0307).
Of the 63 patients with PPGLs, 56 (89%) had increases in plasma NMN above the upper cut-offs of the reference population, compared with 34 (54%) for MN and 42 (67%) for MTY (Figure 3). For three patients (patients 4, 10 and 61) plasma MTY was the only metabolite increased. These three patients had an atypical clinical presentation without increased blood pressure or the usual symptoms of catecholamine excess. All three patients had primary tumours with extra-adrenal locations. Two of the three patients (4 and 10) had metastatic disease. Both these patients also had germ-line mutations of the SDHDgene.
Dot-box and whisker plots showing plasma concentrations of MTY (a), NMN (b) and MN (c) in 125 volunteers compared with concentrations in 63 patients with PPGLs divided into two groups according to the absence or presence of metastatic involvement. The dashed grey horizontal lines reflect upper cut-offs established from the 97.5 percentiles of the volunteer population. Three patients with PPGLs (4, 10, 61) are indicated for whom plasma MTY was the only metabolite increases above the upper cut-offs. MTY, 3-methoxytyramine; NMN, normetanephrine; MN, metanephrine; PPGL, phaeochromocytomas and paragangliomas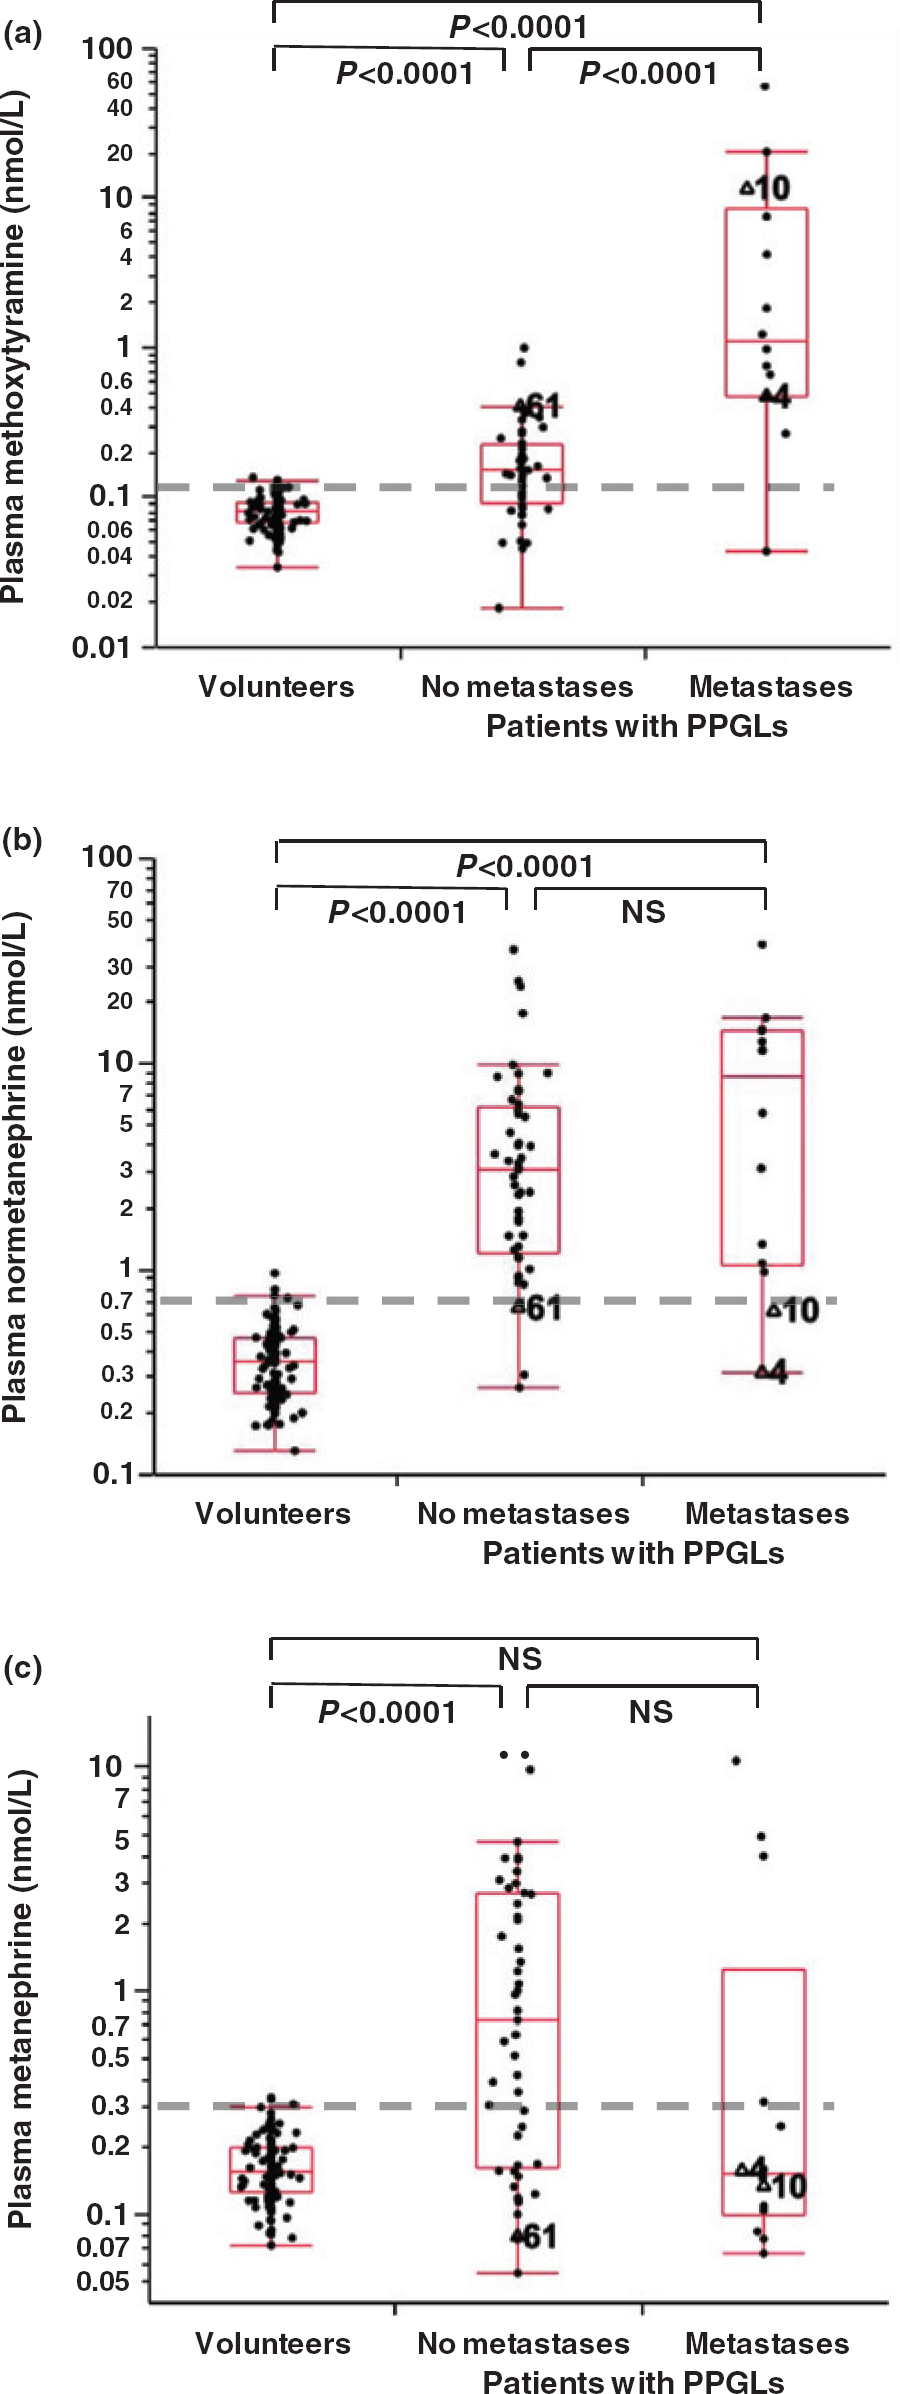
All patients with PPGLs had an increase above the upper cut-offs of at least one of the three O-methylated metabolites (100% diagnostic sensitivity). Diagnostic sensitivity remained at 100% with application of recently described age-adjusted upper cut-offs of reference intervals for NMN and higher upper cut-offs for MN (0.45 nmol/L) designed primarily to optimize diagnostic specificity without compromising sensitivity. 21
Among the 14 patients with metastatic PPGLs, 13 (93%) had increases in plasma MTY above the cut-offs with the seven highest concentrations all observed in patients with metastatic disease (Figure 3a). Median concentrations of MTY among patients with metastatic PPGLs were six-fold higher (P < 0.0001) than in patients without metastases and 14-fold higher (P< 0.0001) than in volunteers (1.09 versus 0.19 versus 0.08 nmol/L).
ROC curve analysis indicated that above a cut-off of 0.41 nmol/L, increases in plasma MTY could distinguish patients with from those without metastastic PPGLs with respective diagnostic sensitivities and specificities of 86% and 96% (Figure 4). The area under the curve for MTY was 0.902, whereas areas for NMN, MN and the combination of MTY, NMN and MN were respectively 0.608, 0.668 and 0.917 (data not shown). Stepwise linear discriminant analysis established that MTY could correctly classify 86% of patients according to the presence or absence of metastases (F = 12.04, P = 0.0097) and that additional consideration of NMN and MN offered no improvement in discriminatory power.
Receiver-operating characteristic curve analysis for plasma 3-methoxytyramine as a biomarker for distinguishing between patients with phaeochro-mocytomas and paragangliomas according to the presence (n = 14) or absence of metastases (n = 49)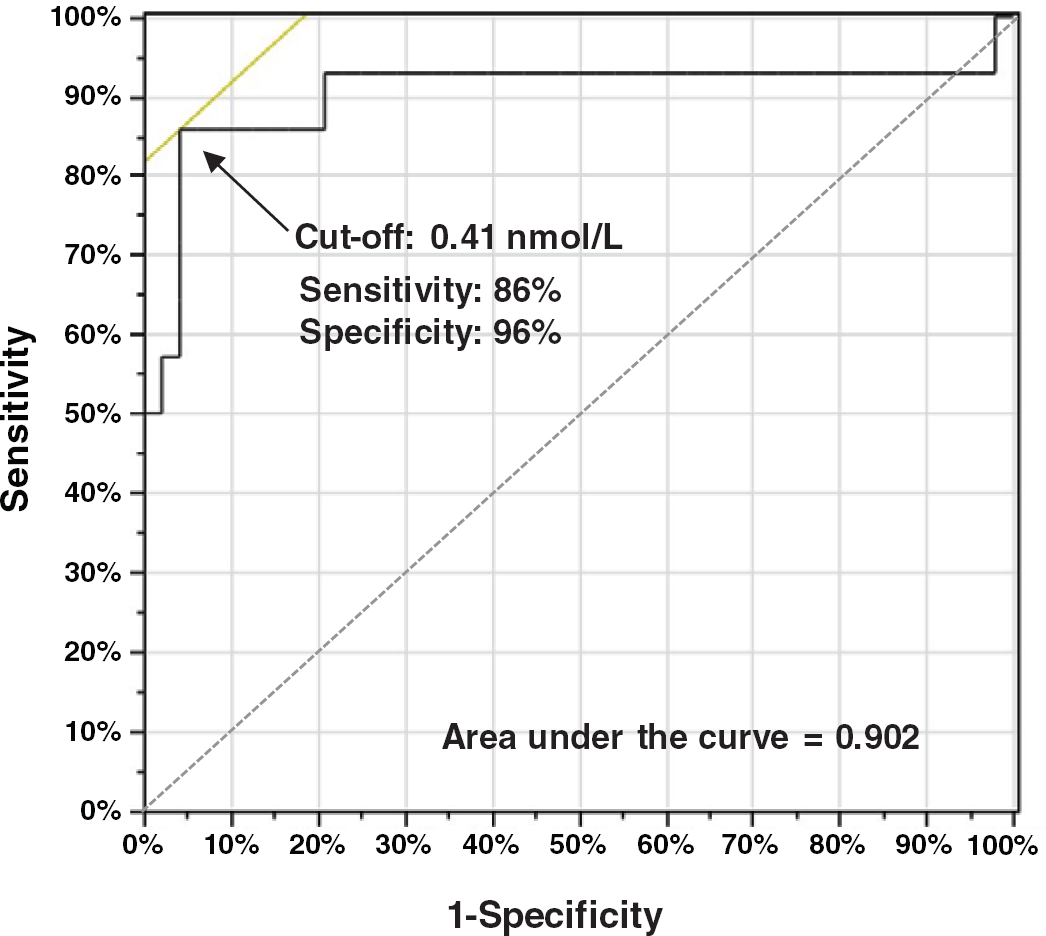
Discussion
We demonstrate for the first time a LC-MS/MS method that allows not only accurate measurements of plasma free NMN and MN, but also measurements of MTY with clear utility for diagnosis of dopamine-producing PPGLs, particularly those designated metastatic. This technological advance follows from recent observations indicating that plasma MTY may provide a novel biomarker for metastatic PPGLs, with increases that can also characterize patients with PPGLs due to mutations of SDHB/D genes.3,5 These observations were, however, based on LC-ECD measurements, which as we describe here are not as reliable nor as accurate as the present LC-MS/MS measurements.
Our LC-MS/MS method allows precise determination of all three O-methylated metabolites in plasma down to 0.02 nmol/L. This is particularly important for MTY, which as established here normally circulates at concentrations between 0.03 and 0.13 nmol/L. Although such concentrations can be measured by LC-ECD they are at the extreme limits of detection, requiring considerable care and attention beyond the scope of the more robust requirements of the routine clinical laboratory. The robustness of the present LC-MS/MS method in contrast makes this method easily transferable to the routine laboratory environment. The shorter run time, enabling a 10-fold increase in sample throughput, combined with the simpler and more efficient SPE 96-well plate format for sample preparation also offers a considerable advance over our LC-ECD procedure for which a full days work is required for preparation of 36 samples, which then require another 24 h to run.
To date, at least six different methods have been described for measuring PFM using LC-MS/MS.11–16 Improvements in analytical sensitivity of instruments since the first method was introduced by Lagerstedt et al. in 2004 11 have enabled measurements of MTY for later methods,13,16 but not to the level of 0.02 nmol/L described here as required for most patients’ samples. This advance in analytical sensitivity is in part achieved through analyte enrichment. Although the associated vacuum centrifugation adds an hour to sample preparation, it is also required to bring the injection vehicle into a suitable form for UPLC separation without compromising mass spectrometric measurements. The step does make the method difficult to adapt for automated on-line sample preparation described by others.14,16 Nevertheless, initial sample preparation after specimen ali-quotting up to vacuum centrifugation takes less than an hour so that if required at least 1000 specimens can be processed and run by one analyst within a single work week.
In addition to high sample-throughput and improved analytical sensitivity, other important advantages involve freedom from analytical interferences that can be a problem for LC-ECD measurements. The enhanced analytical sensitivity and specificity, particularly important for measurements of MTY, probably accounts for the lower levels of plasma MTY measured by LC-MS/MS than by LC-ECD. Higher levels by LC-ECD presumably reflect elec-trochemically active contaminants co-chromatographing with MTY that could not be resolved by visual interpretation of chromatograms.
Interestingly, while LC-MS/MS provided lower more accurate and precise measurements of plasma MTY than by LC-ECD, plasma concentrations of NMN and MN were measured on average up to 17% higher by LC-MS/MS than by LC-ECD. These findings, in agreement with similar differences observed by de Jong et al., 16 are most likely explained by differences in IS correction. For the LC-ECD procedure, less efficient recovery of NMN and MN than of the IS, requires correction using calibrators added to charcoal-stripped plasma. The lower recovery of NMN and MN than of the IS is then corrected for to minimize underestimation of analyte concentrations in patient specimens. This recovery correction may underestimate differences between the recovery of metabolites and IS in those specimens, a problem that is not an issue for the stable-isotope labelled IS used for LC-MS/MS.
Despite the analytical differences in measured values between LC-MS/MS and LC-ECD procedures, plasma concentrations and upper cut-offs of reference intervals for NMN, MN and MTY in our volunteer subjects were similar and certainly not overly higher than those described by us for LC-ECD measurements.5,21 Recently we established age-adjusted reference intervals for plasma NMN determined by LC-ECD for optimal sensitivity and specificity in the diagnosis of phaeochromocytoma. The upper cut-offs for NMN determined in the present group of 125 subjects with a median age of 41.1 y, at 0.73 nmol/L, are only 7% higher than those of 0.68 nmol/L calculated by the equation (UCNMN = 2.07 × 10⁻⁶ × age 3 + 0.54) described in that other study. 21 A correction to the final y-intercept term for that equation from 0.54 to 0.59 is sufficient for use of age-adjusted reference intervals for NMN measured by our LC-MS/MS method.
Other investigators using LC-MS/MS13,16 described upper cut-offs of reference intervals of 0.17-0.18 nmol/L for MTY, 1.07-1.18 nmol/L for NMN and 0.33-0.51 nmol/L for MN that are higher than those described here. The higher upper cut-offs determined in those other studies than determined here likely reflects measurements performed from blood sampled in the seated rather than the recommended supine position.22,23 Nevertheless, as outlined elsewhere, 21 to maintain reasonably high specificity for a test involving multiple analytes it appears useful to raise upper cut-offs of analytes of secondary importance, such as MN, beyond levels indicated by the 97.5 percentiles. Therefore, rather than using the cut-off of 0.31 nmol/L for MN determined here, the value of 0.45 determined elsewhere 21 for optimal specificity remains in our opinion more appropriate. In support of this contention, use of this cut-off for MN, together with age-adjusted cut-offs for NMN did not compromise diagnostic sensitivity among the group of 63 patients with PPGLs in the present analysis.
The above considerations may also apply for plasma MTY for which in the present study we established upper cut-offs of only 0.13 nmol/L. Upper cut-offs of 0.17 or 0.18 nmol/L determined by others13,16 may be preferable. Given the significant positive relationship of plasma MTY with age, it may also be useful to consider age-adjusted reference intervals for MTY similar to those proposed for NMN. 21 Of much more importance for MTY, however, is consideration of dietary catecholamines as a major confounding variable. 24 For this reason measurements of plasma concentrations of MTY must always be carried out from blood collected under fasting conditions.
With the confounding influence of dietary catecholamines controlled for, the present analysis indicates that measurements of plasma MTY by LC-MS/MS can be particularly useful as a biomarker of metastatic PPGLs. ROC curve analysis indicated values for diagnostic sensitivity (86%) and specificity (96%) that were considerably higher than respective values of 57% and 85% observed by us previously for patients with and without metastatic involvement. 5 The latter retrospective analysis utilized a large patient population, whereas the present results reflect prospective data for a smaller population and should therefore be regarded as preliminary. Nevertheless, it is possible that the differences in diagnostic efficacy may reflect enhanced analytical precision and accuracy of measurements by LC-MS/MS than by LC-ECD.
The importance of measuring plasma MTY, in addition to NMN and MN, is illustrated by the finding that plasma MTY was the only metabolite increased in three patients with PPGLs. Such results nevertheless should be considered in the context of the presentation of such patients who do not show the usual signs and symptoms of catecholamine excess typical of patients with PPGLs. Thus, whether plasma MTY should be measured in all patients with a suspicion of the tumour is questionable. Possibly these measurements may be better made available for specific situations such as patients screened for PPGLs because of a previous history of disease or mutations of SDHB/D genes. 2 The measurements also seem important for any patient with a diagnosed tumour in whom it is useful to identify metastatic involvement or an SDHB/D gene mutation.
In conclusion, we establish here a novel high-throughput LC-MS/MS method for accurate and specific measurements of not only plasma NMN and MN, but also of MTY the O-methylated metabolite of dopamine. As shown by intra-and inter-assay coefficients of variation the method shows good reproducibility with robust characteristics and sufficient analytical sensitivity for reliable measurements of all three metabolites suitable for the routine laboratory. We further support this use by demonstration in a group of over 60 patients with PPGLs, not only how the method may be useful for initial diagnosis of the tumours, but also how the additional measurements of MTY can characterize patients with dopamine-producing tumours, particularly those with metastatic involvement.
Declarations
Footnotes
Acknowledgements:
Thanks are extended to Daniela Pelzel, Carmen Berndt and Nan Qin for technical assistance and to Roland Därr and Stephan Glöckner for collections of human materials.