
Abstract
Background
Paediatric reference values for novel markers of phosphate homeostasis, bone formation and resorption and their putative relationship to growth are lacking.
Methods
A total of 424 healthy children, adolescents and young adults (221 males) aged 0.1–21 y, were enrolled in this cross-sectional study. Height, weight and height velocity were assessed. Plasma/serum samples for determination of C-terminal fragment of fibroblast growth factor-23 (cFGF-23), sclerostin, bone alkaline phosphatase (BAP) and tartrate-resistant acid phosphatase 5b (TRAP5b) were available from 222, 264, 352 and 338 individuals, respectively. Calculation of cross-sectional centiles and z-scores was based on median (M), standard coefficient of variation (S) and the Box-Cox power (L) of transformation (LMS method) per age cohort. Correlations between variables as well as with growth were assessed.
Results
cFGF-23, BAP and TRAP5b were significantly correlated with age (each P < 0.01), with highest values during infancy and adolescence. Serum levels of BAP and TRAP5b were significantly higher in adolescent boys compared with girls (each P < 0.01). In contrast, sclerostin levels were independent of age and gender. BAP and TRAP5b were strongly correlated and both were significantly associated with cFGF-23 and sclerostin as well (each P < 0.01). cFGF-23 was positively correlated with serum phosphate and renal phosphate threshold concentration (each P < 0.01). Height, weight, body mass index and height velocity were weakly correlated with BAP and TRAP5b (each P < 0.05).
Conclusions
This study provides age- and gender-related centile charts and z-scores for cFGF-23, BAP, TRAP5b and sclerostin and highlights the link between phosphate homeostasis and markers of bone metabolism during growth.
Introduction
Assessment and monitoring of skeletal health are important issues in patients suffering from inherited or acquired metabolic bone disease, which is most frequently related to chronic illness and/or the treatment required therefore. 1–3 However, monitoring metabolic bone disease is not an easy task, and in paediatric patients, effects of growth and development have to be taken into account too. Apart from histomorphometric analysis of bone biopsies, which is still the gold standard of diagnosis, dual-energy X-ray absorptiometry, quantitative peripheral computed tomography and biochemical markers of bone turnover are continuously recognized as important clinical monitoring tools. 4–6 These biochemical markers reflect global rather than local skeletal activity and are thought to mirror bone metabolism either at the level of regulatory circuits or at the level of bone cells, i.e. osteocytes, osteoblasts and osteoclasts.
Several molecules are suited to monitor the activation of osteoblasts and osteoclasts during bone formation (e.g. bone alkaline phosphatase [BAP], osteocalcin and type I procollagen peptide) and resorption (e.g. type I collagen-derived pyridinium cross-links and cross-linked telopeptides, tartrate-resistant acid phosphatase 5b [TRAP5b]), respectively. Although numerous studies indicate that these markers are powerful tools for monitoring individual patients, the great diversity in assays available for the same analyte seriously hamper the comparison of results between different studies and require assay-specific reference intervals. 4,7 This is especially important in paediatrics, as skeletal growth and development are invariably associated with bone turnover. Thus, apart from the need of a sufficiently large cohort of healthy children and adolescents, adequate curve-fitting procedures to derive reliable centile charts from a skewed distribution of data are required.
At the level of regulatory circuits, the RANKL/RANK/OPG and the Wnt signalling system, as well as the endocrine compartment consisting of calcitriol, parathyroid hormone (PTH) and fibroblast growth factor-23 (FGF-23), have to be considered as well. 8–12 In fact, FGF-23, an important regulator of phosphate homeostasis, as well as its C-terminal-derived fragment (cFGF-23), have been associated with cardiovascular morbidity and mortality in patients with chronic kidney disease. 13,14 In contrast, whether or not the FGF23 serum concentration is related to age, gender and/or linear growth is currently not known.
Recently, the osteocytic protein sclerostin (SOST localized on chromosome 17q12–21) has been recognized as an inhibitor of canonical Wnt signalling and a negative regulator of bone formation. 15–17 Both sclerosteosis (OMIM 269500) and Van Buchem disease (OMIM 293100) are characterized by progressive bone thickening and generalized osteosclerosis due to diminished sclerostin signalling and/or expression. Targeted inhibition of sclerostin is currently evaluated as a measure to stimulate bone formation in osteoporosis. Although the latter is mostly a disease in the elderly, it may affect children and adolescents as well, either as an inherited condition (primary osteoporosis, e.g. juvenile osteoporosis) or as a consequence of chronic illness and/or the treatment required (secondary osteoporosis). 2 Development of sclerostin inhibitors as a treatment of osteoporosis most likely requires monitoring of sclerostin serum concentration.
The aims of our study were (i) to determine age- and gender-specific reference values for cFGF-23, sclerostin, and two newly developed assays specific for BAP and TRAP5b activity; (ii) to provide centile charts together with z-scores; and (iii) to analyse correlation between these markers and growth.
Subjects and methods
Participants
A total of 424 (221 males) healthy Caucasian children, adolescents and young adults with a mean age of 11.2 y (range 0.1–21 y) participated in this study. Briefly, we introduced our study to the principal of a private school (primary and high school) in Rostock, Germany. We aimed to enroll 5–10 boys and girls per age and approximately 60% of parents and children consented to participate. Preschool children were either siblings of participants or from the hospital staff. Finally, preschool and schoolchildren presenting to the University Children's Hospital Rostock for diagnostic work-up either before minor surgery (e.g. for hernia, phimosis and hypospadia) or secondary to non-inflammatory diseases like epilepsy, enuresis and orthostatic complaints were also eligible, as long as the anthropometric measurements, clinical examination and results from routine laboratory assessment (blood cell count, C-reactive protein [CRP], creatinine and liver enzymes) were within the reference range. Children with growth disorders, a history of recent fracture or malnutrition, acute infections, elevated serum concentration of the CRP (≥5 mg/L) or creatinine (≥2 SD) at the time of enrolment as well as those with metabolic disorders, chronic inflammatory diseases and renal or hepatic disease were excluded. The study was approved by the Hospital Ethics Committee (HV-2009–003), and informed consent was obtained from parents and/or participants, if appropriate. Blood samples were obtained between 08:00 and 11:00 in the morning and at least three hours after the last intake of a meal. Serum and ethylenediaminetetraacetic acid (EDTA)-plasma were aliquoted and stored at −80°C until further analysis (see below). In particular, serum samples for quantitative determination of sclerostin, BAP and TRAP5b were availabe from 264 (146 males), 352 (184 males) and 338 (180 males) participants, respectively. Reliable data for sclerostin, BAP and TRAP5b were obtained from 260 (143 males), 346 (179 males) and 336 (178 males) samples, respectively. EDTA-plasma for quantitative assessment of cFGF-23 was available from 222 subjects (106 males) and reliable results were obtained from 218 samples. Data on intact PTH (iPTH) and 25-hydroxyvitamin D3 were gathered by chart review and were available from 78 and 133 subjects, respectively.
Anthropometric measurements
Trained physicians (AM and SW) measured the height and weight of all subjects with a precision electronic scale and a fixed stadiometer. Height velocity was calculated by the use of two height measurements at least six months apart. Age- and gender-related SD scores for height, weight, body mass index (BMI) and height velocity were calculated as described recently. 18,19
Serum and urine analysis
Total serum protein, albumin, CRP, calcium, phosphate and creatinine, as well as urinary creatinine and phosphate concentrations, were measured by established automated procedures (UniCel DxC Clinical Systems; Beckman Coulter Inc., Krefeld, Germany). The intra- and inter-assay variability with this instrument and the corresponding reagents was below 3%. The creatinine concentrations in serum and urine were determined according to Jaffé. The ratio of the maximum rate of tubular phosphate reabsorption to glomerular filtration rate (TmP/GFR) was calculated from the serum (S) and urinary (U) concentrations of phosphate (P
i) and creatinine (Crea) according to the formula:
20

Concentrations of iPTH (biointact PTH; aa 1–84) and 25-hydroxyvitamin D3 were determined using an automated chemiluminescence immunoassay system (Elecsys, Roche, Basel, Switzerland). Manual enzyme-linked immunosorbent assay (ELISA) kits for quantitative determination of cFGF-23 (second generation assay, limit of detection: 1.5 kRU/L; calibration range/mode: 0–445 kRU/L with first reading; 4-Parameter Marquard; Immutopics, San Clemente, CA, USA), sclerostin (limit of detection: 0.13 μg/L; calibration range/mode: 0–4 μg/L; linear scale, quadratic fit; Tecomedical, Sissach, Switzerland), BAP (limit of detection: 0.7 U/L; calibration range/mode: 0–140 U/L; linear scale, quadratic fit; Quidel, San Diego, CA, USA) and TRAP5b (limit of detection: 0.2 U/L; calibration range/mode: 0–15 U/L; linear scale, quadratic fit; Quidel) were used. All assays were performed essentially as described by the manufacturer and all samples were assayed in duplicate, i.e. 200 μL plasma (cFGF-23) as well as 50 μL (sclerostin), 40 μL (BAP) and 100 μL (TRAP5b) serum were required per duplicate measurement. The inter- and intra-assay coefficients of variation for cFGF-23, sclerostin, BAP and TRAP5b were 5.1%/5.0%; 9.3%/5.9%; 5.5%/5.0%; and 4.2%/2.8%, respectively. If the results differed by more than 5% (7% in the case of sclerostin), a second aliquot was used for the respective analysis. None of the samples underwent more than one freeze–thaw cycle. The Infinite M200 microplate reader (Tecan, Crailsheim, Germany) with corresponding software (Magellan™ V 6.6) was employed for data acquisition and transformation.
Statistics
Data were analysed using the SPSS statistical package 19.0 (SPSS Inc., Chicago, IL, USA) and Sigma Plot (Systat Software Inc., San Jose, CA, USA), respectively. The Kolmogorov–Smirnov test was applied to test for normal distribution.
Sclerostin serum concentrations were non-normally distributed (skewness = 2.24; P < 0.001) and a power transformation (reciprocal square root) was required (skewness = 0.46; P = 0.28), as weaker procedures like logarithmic or square root transformation were not sufficient. 21
Subsequently, mean, standard deviation (SD) and percentiles were calculated from the transformed data and the results were reverted to obtain concentration values. The LMS method (LMS chartmaker Pro Version 2.54, Harlow Printing Limited, Tyne & Wear, UK) was employed to generate age- and gender-specific reference values, if appropriate. 22 For this purpose, children younger than one year of age and young adults (≥19 y of age) were considered as one group, respectively. Probability values resulted from two-sided statistical tests and P < 0.05 was considered to be significant. Correlations between variables were assessed by bivariate and/or univariate linear regression analysis.
Results
A total of 424 healthy children and adolescents fulfilled the inclusion criteria and provided serum and/or plasma samples for this study. Absolute and standardized anthropometric characteristics of the study group were within the reference range (mean height: males, 0.04 ± 1.20 SDS, females, 0.12 ± 1.15 SDS; mean weight: males, 0.11 ± 2.14 SDS, females, 0.13 ± 1.97 SDS; mean BMI: males, 0.08 ± 1.28 SDS, females, 0.00 ± 1.16 SDS).
Reference values for cFGF-23, sclerostin, BAP and TRAP5b
Whereas cFGF-23, BAP and TRAP5b were significantly correlated with age (r = –0.22, 0.248 and 0.214; each P < 0.01), and in the case of BAP and TRAP5b also with gender (each P < 0.01), no such association was seen for sclerostin (Figure 1). The highest plasma concentrations of cFGF-23 were seen during infancy and adolescence, i.e. during the first two years of life and between 12 and 15 y of age, respectively (Figure 1a). In contrast, serum concentrations of BAP and TRAP5b showed less variability between infancy and childhood, i.e. during the first 9–10 y of life. After a rise at the time of the onset of the pubertal growth spurt, which, in turn, is later in boys than in girls, a constantly declining activity of either phosphatase was observed (Figures 1c–f). The LMS method was employed to calculate age- and/or gender-specific centiles for cFGF-23, BAP and TRAP5b (Table 1).
Data for cFGF-23 (a), sclerostin (b), BAP (c, d) and TRAP5b (e, f) according to age. Open and closed symbols denote values for males and females, respectively. For sclerostin, the 10th, 25th, 50th, 75th and 90th percentiles obtained after back transformation are indicated, while the 3rd, 10th, 25th, 50th, 75th, 90th and 97th percentiles are given for cFGF-23, BAP and TRAP5b, respectively. Sclerostin, cFGF-23, BAP and TRAP5 values determined in 2.3%, 11%, 5% and 4% of the entire study population fall beyond the parametrically calculated limits LMS values and specific percentile limits for cFGF-23 (a), BAP (b) and TRAP5b (c) according to age and gender L, skewness; M, median; S, coefficient of variation. To calculate the age- and gender-related z-score for any one of these parameters, the determined concentration Y
t together with the corresponding values for L, M and S (L
t, M
t and S
t) are used according to the formula 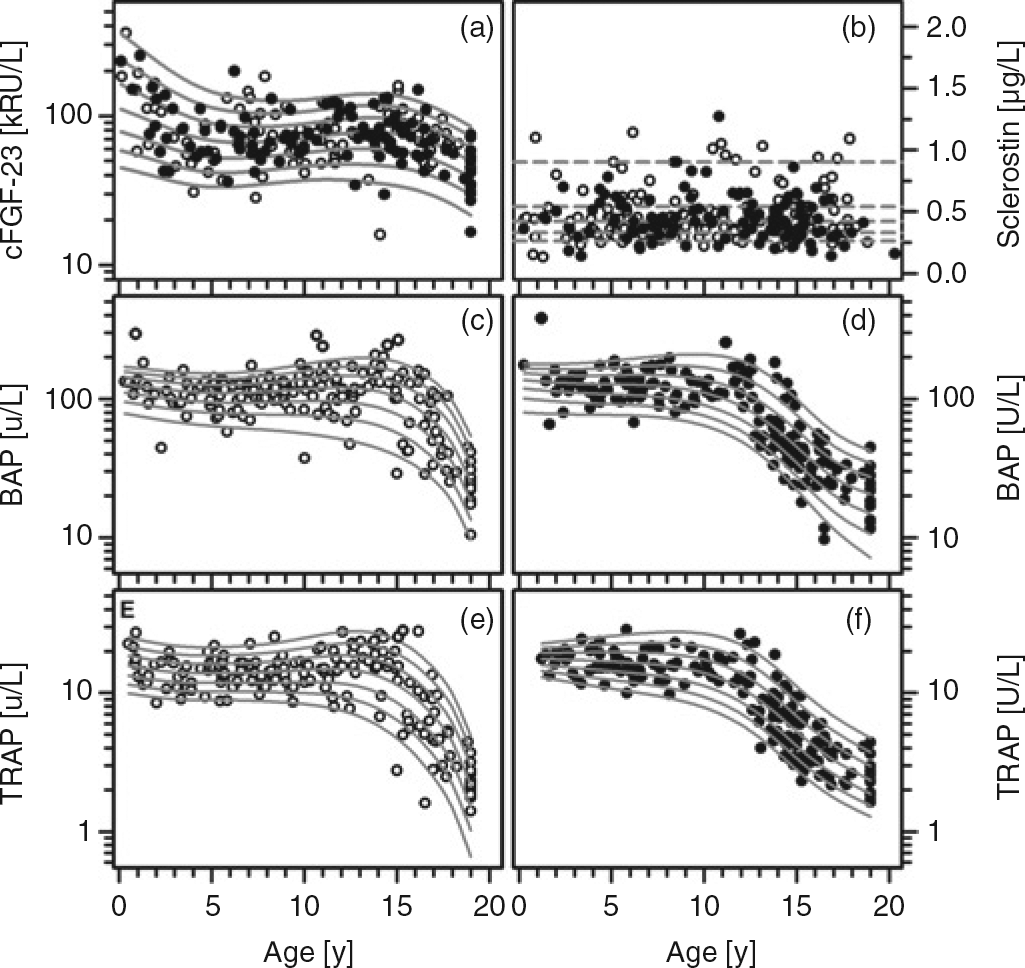

The serum concentrations of sclerostin were independent of age, height, weight, BMI and gender (each P > 0.50) (Figure 1b). After normalization by means of reciprocal square root transformation, the reference range (mean ± SD, 1.58 ± 0.33) was obtained and z-scores for sclerostin (z
scler) were calculated according to the formula:
 Percentiles were calculated from transformed data and subsequently back-transformed to obtain concentrations representing the 3rd, 10th, 25th, 50th, 75th, 90th and 97th percentiles, i.e. 0.20, 0.26, 0.33, 0.42, 0.54, 0.76 and 1.0 μg/L, respectively.
Correlations between bone markers, mineral metabolism and anthropometric data
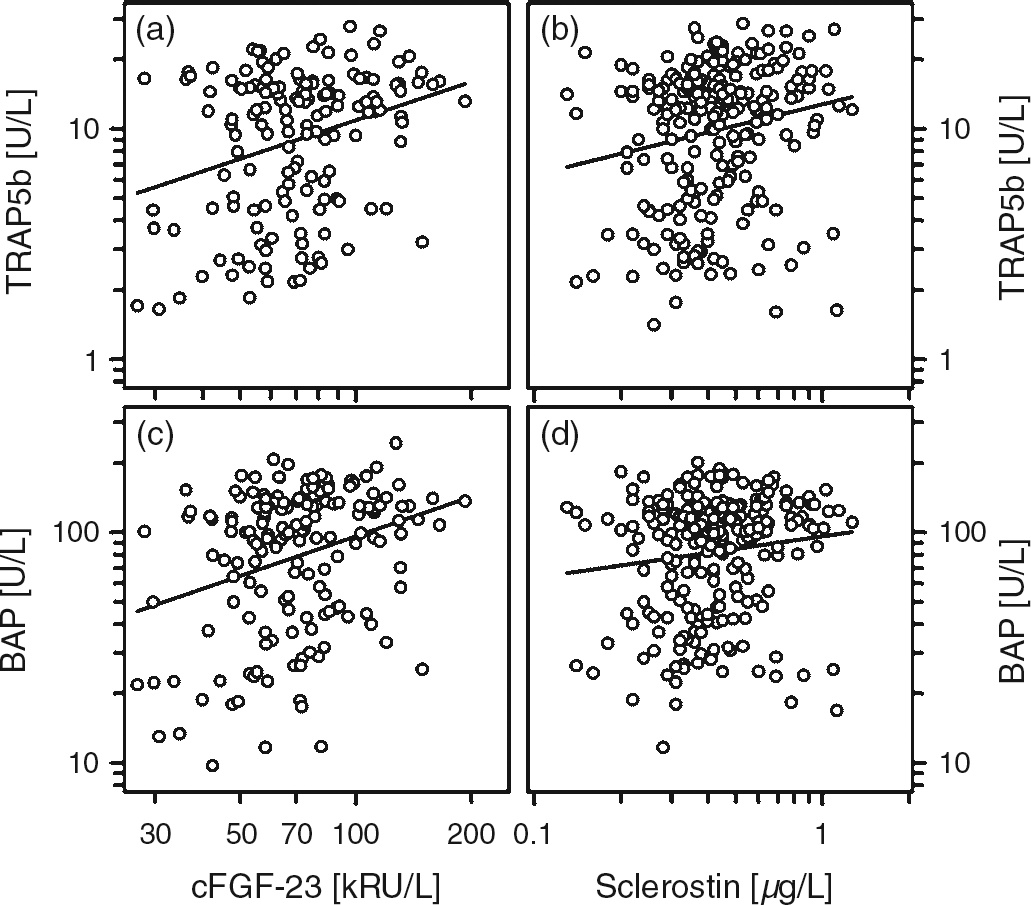
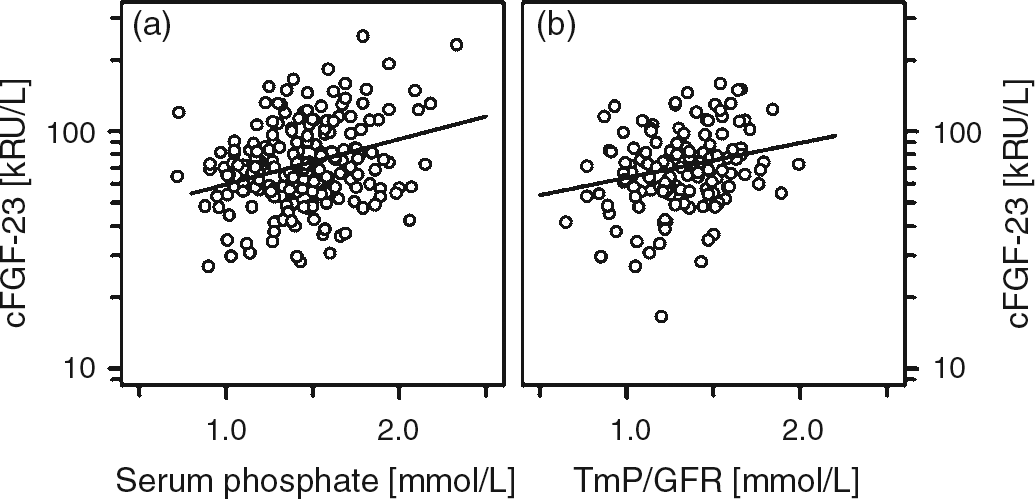
Besides a strong association between the absolute and standardized serum concentrations of BAP and TRAP5b (Figure 2), both of them were associated with absolute height velocity (r = 0.591; r = 0.653; each P < 0.001), with cFGF-23 and sclerostin (Figure 3). However, no such association between sclerostin and cFGF-23 was present at all (r = 0.017, P = 0.88). Bivariate regression analysis revealed that the concentration of sclerostin correlated positively with calcium (r = 0.136, P < 0.05) and negatively with TmP/GFR (r = −0.247, P < 0.05). The cFGF-23 concentration was positively correlated with serum phosphate (r = 0.210, P < 0.01), 25-hydroxyvitamin D (r = 0.230, P < 0.05) and TmP/GFR (r = 0.273, P < 0.001) (Figure 4 and data not shown). Standardized cFGF-23 was significantly associated with standardized weight and BMI (r = 0.178, P < 0.01; r = 0.292, P < 0.001). In contrast, none of the variables mentioned above were associated with serum iPTH.
Correlation between absolute and standardized values of BAP and TRAP5b (a, b). (a) r = 0.776, P < 0.001 and (b) r = 0.441, P < 0.001 Correlation between TRAP5b and cFGF-23 (a), TRAP5b and sclerostin (b) as well as between BAP and cFGF-23 (c) and BAP and sclerostin (d). (a) r = 0.21, P < 0.01; (b) r = 0.19, P < 0.01; (c) r = 0.248, P < 0.001; and (d) r = 0.136, P < 0.05 Correlation between cFGF-23 and serum phosphate (a) and the maximum rate of tubular phosphate reabsorption to glomerular filtration rate (TmP/GFR; b). (a) r = 0.21, P < 0.01 and (b) r = 0.273, P < 0.001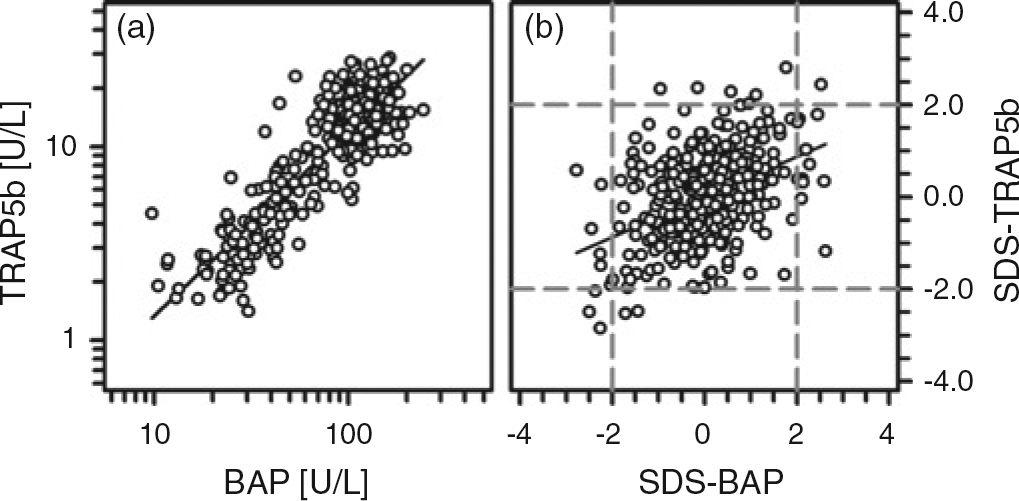
Discussion
This cross-sectional study in a large cohort of healthy children, adolescents and young adults aged from 0.1 to 21 y, enabled us to calculate gender- and age-specific reference values for cFGF-23, sclerostin, BAP and TRAP5b. Manual ELISA was used throughout the study, and from a technical point of view, all of them were satisfactory in terms of reproducibility and handling characteristics. Apart from this, standardization is an important issue when comparing quantitative immunochemical tests. Besides the antigen used for immunization and standardization, the design of the assay (inhibition assay, sandwich assay, etc.) and the characteristics of the antibodies have to be considered.
At present, two assays specific for intact and biologically active FGF-23 and another one specific for the C-terminal fragment of FGF-23 are commercially available. Although intact FGF-23 (iFGF-23) is detected with the cFGF-23 assay and the latter is calibrated in relative instead of absolute units, a fairly good correlation between iFGF-23 and cFGF23 was described. 23,24 The cFGF-23 assay is preferentially used and thus we decided to determine pediatric reference values for this assay.
In this study, the activity of BAP and TRAP5b was measured after surface immobilization by means of specific antibodies. Recombinant and purified enzymes are used for calibration and thus the activity of the respective enzyme serves as a readout for the metabolic situation of the skeleton, i.e. bone formation and resorption. Although paediatric reference values for BAP and TRAP5b have been published previously, these are either related to different assays and/or give the results in absolute concentration instead of enzyme activity. 25–27 Regardless of assay-related differences, the distribution of either BAP or TRAP5b activity in relation to age (and thus puberty) and gender is fairly comparable between our study and those mentioned above and closely resemble physiological growth. 27,28
Apart from TRAP5b, collagen-derived peptides released into the urine are rather widely used as markers of bone resorption. However, this might cause serious problems and erroneous results in patients with chronic kidney disease. In contrast, clearance of BAP and TRAP5b is virtually independent from renal function and thus the combination of both enzymes might be particularly useful to monitor bone metabolism in (pediatric) dialysis patients. 6
Although the distribution of serum sclerostin concentrations was significantly skewed, this was neither related to age, gender or anthropometric characteristics. The reference range together with percentiles was calculated after data transformation and the back-transformed values were presented. Due to the skewed data distribution, the percentiles are not equidistant, i.e. the differences between the 10th and third percentiles and between the 97th and 90th percentiles were 0.06 and 0.24 μg/L, respectively. Very recently, the comparison of two commercial ELISAs for sclerostin and a couple of studies on sclerostin serum concentrations in relation to pathological and physiological conditions in adults and in healthy children have been published. 29–35 The direct comparison of the ELISA purchased from Biomedica (Vienna, Austria) and Teco revealed statistically significant differences between both assays. In particular, sclerostin concentrations determined with the Teco assay are significantly lower than the ones determined with the Biomedica assay. 29 But perhaps even more importantly, throughout the studies mentioned above, either the ELISA purchased from Biomedica or in-house prepared assays were used. This hampers a direct comparison of our data with the one reported from Kirmani et al. 35 Apart from the differences regarding the sclerostin levels itself, it might be even more important that we were unable to show any effect of age or gender on sclerostin serum concentrations with the Teco assay. However, this discrepancy might be related to the different sample size. We investigated a rather large cohort of healthy children and adolescents covering the complete age range from early childhood (<1 y of age) to young adulthood. Thus, per gender and year of age, on average, data from five individuals were collected, and this provides a robust base to decipher any effect of age. Likewise, fetuin-A serum concentrations, which were initially described as age-dependent, turned out to be independent from age once a sufficiently large cohort of healthy children was evaluated. 18,36 Given that sclerostin controls bone homeostasis via prevention of excessive osteogenesis, the observed association with bone turnover, i.e. with BAP and TRAP5b, is not a surprise. Both the negative association with TmP/GFR and the positive association with serum calcium point to a link between sclerostin secretion and mineral homeostasis/bone mineralization, which strongly depend on the availability of calcium and phosphate. The associations between cFGF-23 and serum phosphorous, the calcium, phosphate serum product and TmP/GFR strengthen this hypothesis.
Apart from tumour-induced osteomalacia, cFGF-23 concentrations have been determined almost exclusively in the setting of chronic renal failure and/or hypophosphatemic rickets, i.e. conditions of metabolic bone disease. 13,14,37–41 Few studies have investigated the association between serum phosphate and FGF-23 levels, and while in normal mice a direct correlation between dietary phosphate intake, serum phosphate and FGF-23 levels was noted, data in humans are conflicting. 24,40,42,43 The latter differ with respect to the time schedules and the dietary protocol (phosphate infusion, phosphate-restricted diet compared with phosphate restriction plus concomitant application of phosphate binder). However, manipulation of serum phosphate via dietary phosphate intake appears best to mimic physiological conditions. 42 In this setting, serum concentrations of cFGF-23 were only slightly increased in response to moderate phosphate loading but dropped significantly when dietary phosphate was restricted. In contrast, doubling of serum phosphate concentrations within four hours did not translate into a parallel increase of FGF-23 serum concentration. 24 Although our study was not directed to evaluate the association between phosphate loading and serum FGF-23 concentrations, the observed correlation between these two parameters in healthy children illustrates the tight control of mineral metabolism and bone mineralization. In fact, a recent study with children on dialysis treatment points to an association between FGF-23 and improved skeletal mineralization, the latter judged from histomorphometric analysis of bone biopsies. 38
In summary, we examined the serum concentrations of cFGF-23, sclerostin, BAP and TRAP5b in a large cohort of healthy children covering all ages from early childhood to young adulthood. Whereas sclerostin levels turned out to be independent from age and gender, the LMS method was applied to generate percentile charts and z-scores for cFGF-23, BAP and TRAP5b. This will facilitate monitoring of bone metabolism in children. The observed associations between cFGF-23, sclerostin, BAP and TRAP5b highlight the link between phosphate homeostasis and markers of bone formation and resorption during growth.
DECLARATIONS