
Abstract
Background
Faecal calprotectin (f-Cp), a marker of intestinal inflammation, can be used to distinguish between functional and organic bowel disease. F-Cp, following extraction, is commonly quantified using enzyme-linked immunosorbent assays (ELISAs) but there are no data comparing the different f-Cp assays or sample extraction devices. We, therefore, evaluated and compared the performance of the Immunodiagnostik, Bühlmann and Eurospital f-Cp ELISA assays as well as the Roche, Immunodiagnostik and ScheBo Biotech commercial faecal extraction devices. We also briefly report results from a pilot f-Cp external quality assurance (EQA) scheme.
Methods
Imprecision, linearity, recovery, drift and limit of quantitation of the f-Cp assays were evaluated and between-assay variability assessed. The three commercial sample extraction devices were compared with the manual weighing method. Four faecal samples were distributed as part of a pilot EQA scheme to 15 laboratories using quantitative ELISA f-Cp assays.
Results
The three f-Cp assays demonstrated adequate intra-/interbatch imprecision, linearity and recovery. The crosscomparison study and EQA data demonstrated that, for the same sample, the Bühlmann assay reports up to 3.8 times higher f-Cp concentrations than the Immunodiagnostik and Eurospital assays. On average, the commercial extraction devices led to a 7.8-28.1% under-recovery of f-Cp in comparison to the manual weighing method.
Conclusions
Laboratories should be aware of the lack of the assay standardization, as demonstrated by the between-assay variability. A comparison between f-Cp concentrations reported by these assays and clinical markers of disease severity is required in order to determine their diagnostic accuracy. The EQA scheme represents the first available programme for f-Cp.
Introduction
Colonoscopy combined with the histological analysis of biopsy specimens is the primary diagnostic tool for the detection and quantification of intestinal inflammation in inflammatory bowel disease (IBD) and exclusion of irritable bowel syndrome (IBS).1–4 Endoscopy, however, is costly, invasive, not well tolerated by patients and carries a degree of clinical risk. Markers of systemic inflammation such as full blood count (FBC), serum C-reactive protein (CRP) and erythrocyte sedimentation rate (ESR) are used for predicting disease activity but are not specific for intestinal inflammatory disease and correlate poorly with symptoms and disease activity. 5
Calprotectin is a calcium- and zinc-binding protein predominantly expressed in neutrophils, in which it constitutes up to 60% of the total cytosolic protein.6,7 Calprotectin has antimicrobial8–14 and antiproliferative 15–17 properties and appears to play a regulatory role in the inflammatory process.18–20 Faecal calprotectin (f-Cp) concentrations are raised in patients with intestinal mucosal inflammation, 21 whereas levels in patients with IBS are similar to those in healthy individuals.22–24 F-Cp measurement, therefore, provides a non-invasive marker for distinguishing IBD from IBS, thereby reducing the number of unnecessary endoscopic and radiological investigations in patients presenting with chronic diarrhoea.22–28 Being not only more pleasant and convenient for the patient, the use of f-Cp could also provide potentially significant cost-savings. F-Cp concentrations correlate well with faecal excretion of 111Indium-labelled leukocytes29,30 which is the gold standard for quantifying the severity of gastrointestinal inflammation.31,32 F-Cp has been shown to perform better than the more routinely used inflammatory markers FBC, ESR and CRP in both distinguishing IBD from IBS, and in determining the severity of disease.33–36 Concentrations of f-Cp correlate with endoscopic and histological assessment of disease activity in both adults and children with IBD.22–24 Age-related reference ranges for calprotectin have also been proposed. 37 F-Cp is also considered useful in the management of IBD as it is a reliable predictor of relapse, particularly in ulcerative colitis (UC),38,39 and a marker of mucosal healing in response to therapy.40,41
Calprotectin is resistant to both in vitro and in vivo degradation, is uniformly distributed in faeces and is stable for up to seven days at room temperature,42,43 allowing stool samples to be posted to the laboratory for f-Cp analysis. Following sample extraction, f-Cp may be quantified using several different enzyme-linked immunosorbent assays (ELISAs) with identical manufacturer-recommended cut-off values for distinguishing IBD from IBS. There are, however, no data published in the literature on comparisons of the different f-Cp ELISAs or sample extraction devices. We, therefore, evaluated and compared the performances of three of the f-Cp ELISA kits currently available within the UK (Immunodiagnostik PhiCal® [Bensheim, Germany], Bühlmann Laboratories EK-CAL [Schönenbuch, Switzerland] and Eurospital Calprest® [Trieste, Italy]) as well as the Roche (Roche Diagnostics GmbH, Mannheim, Germany), Immunodiagnostik AG and ScheBo Biotech AG (Giessen, Germany) faecal extraction devices. We also report results from a pilot f-Cp external quality assurance (EQA) scheme.
Methods
Whereas the f-Cp concentrations of patient samples are in the order of microgram per gram of wet faeces (μg/g), the calibrators and controls (and in-house internal quality control [IQC]) of the f-Cp assays contain ng/mL levels of calprotectin. Consequently, patient samples are diluted 2500-fold during the preanalytical sample preparation steps. With the exception of the intra- and interbatch ELISA imprecision data (ng/mL units), all calprotectin concentration data are expressed in μg/g. The intra- and inter-batch assay imprecision experiments were conducted using the assay controls and in-house IQC material, and hence the data are presented in ng/mL; values expressed in ng/mL can be converted to μg/g by multiplying by 2.5.
Sample extraction and measurement of faecal calprotectin
Faecal material used in this evaluation was obtained from anonymized surplus stool samples kindly supplied by other laboratories carrying out in-house calprotectin analysis. Upon receipt, samples were either stored at 4°C or -80°C and extracted within two days or three months, respectively. 43
F-Cp was measured using the EK-CAL (10–600 μg/g analytical range), PhiCal (Cat. # 6937) and Calprest (Cat. # 9031) two-site sandwich calprotectin ELISA assays manufactured by Bühlmann Laboratories AG, Immunodiagnostik AG and Eurospital, respectively. All assays are based upon the modified version 43 of the method originally developed by Røseth et al. 42 Faecal extracts were, unless otherwise stated, prepared using the following ‘manual’ approach essentially as previously described. 43 In summary, stool samples were equilibrated to room temperature (21–26°C) immediately prior to extraction; frozen samples were first thawed slowly overnight at 4°C. Following thorough mixing of the sample by vortexing, a 50–100 mg portion of faecal material was weighed and subsequently diluted to achieve a weight-to-volume ratio of 1:50 using extraction buffer. Each of the samples was briefly vortexed for 30 s and subsequently completely homogenized using a multi-tube vortexer for 30±5 min at approximately 1800 rpm. A portion of the resulting homogenate (approximately 1.5 mL) was centrifuged at 8000 g for 10 min and the supernatant promptly decanted and stored at -80°C until analysed. Frozen faecal extracts were assayed within six months of preparation. 43 All assays were run according to the manufacturers’ instructions using a Triturus® automated ELISA platform (Grifols UK, Cambridge, UK). Please note that each manufacturer's sample extraction buffer is incompatible with the other ELISA assays. Thus, it was not possible to assess the performance of all three assays for each given parameter using a common faecal extract.
Evaluation of extraction method
A series of nine faecal samples were extracted using the manual approach described above and using the Roche, Immunodiagnostik AG and ScheBo Biotech stool extraction devices in accordance with the appropriate manufacturer instructions. Samples were extracted using the buffer from the Bühlmann Laboratories AG f-Cp kit since that assay was used to analyse all faecal extracts.
ELISA evaluation
Imprecision
Imprecision of the f-Cp kits was assessed using two different approaches: (1) the intra- and interbatch imprecision of the faecal extract ELISA assay step alone and (2) the combined intrabatch imprecision of the whole analytical process including both the preanalytical sample extraction and ELISA quantitation steps.
ELISA assay intra-batch imprecision (n = 12–14): each manufacturer's ELISA assay was evaluated at four levels of calprotectin concentration using both the respective manufacturer's supplied controls and in-house internal quality control materials prepared from stool samples with appropriate concentrations of calprotectin. The Immunodiagnostik high-level control was a bespoke preparation produced by the manufacturer for the purpose of this study.
ELISA assay inter-batch imprecision (n = 8): the Bühlmann and Eurospital calprotectin ELISA assays were assessed at two different analyte concentrations using the respective manufacturer's supplied control materials. In the case of the Immunodiagnostik ELISA assay (supplied with only one level of control at time of evaluation), it was assessed using the manufacturer's supplied control and in-house prepared internal quality control materials.
Total assay intra-batch imprecision (n = 10): two faecal samples with approximate calprotectin concentrations of 50 and 250 μg/g were each extracted ten times. Each replicate was analysed in duplicate in the same batch using the appropriate f-Cp assay.
Dilution linearity and recovery
To assess the linearity over the analytical range of the f-Cp assays, two faecal extracts were subjected to four serial doubling dilutions up to 1:16 using the appropriate manufacturer's sample diluent. The observed f-Cp concentrations were plotted versus the expected values and the relationship assessed using least-squares linear regression. Mean percentage differences were calculated to represent the average percentage deviation between the expected and observed calprotectin concentrations across the four dilutions of each extract. Recovery was assessed by spiking preprepared faecal extracts with known amounts of calprotectin using the manufacturer's supplied calibrator solutions. Two faecal extracts were prepared containing approximate baseline calprotectin concentrations of 10 (S1) and 40–55 (S2) ng/mL and separate aliquots of the two faecal extracts were each spiked with an equal volume of one of the three highest kit calibrators. The concentrations of calprotectin added to each aliquot of the two baseline extracts were 20, 60 and 120 ng/mL for the Bühlmann assay; 26, 105 and 420 ng/mL for the Immunodiagnostik assay; and 25, 50 and 100 ng/mL in the case of the Eurospital assay. Following analysis of the baseline and spiked extracts, recoveries were expressed as percentages of the expected concentrations.
Drift
For the Bühlmann and Eurospital kits, the two levels of the manufacturer's supplied control materials were run routinely at the beginning and end of each sample batch (n = 7) in order to detect assay drift. For the Immunodiagnostik assay, assay drift was assessed by running the control alongside an in-house internal quality control material (approximately 300 μg/g). An in-house quality control was used to assess drift because the kits supplied by Immunodiagnostik at the time of the evaluation contained only one control level.
Limit of the blank, lower limit of detection and limit of quantitation (precision profile)
Estimations for the limit of the blank (LoB), limit of detection and limit of quantitation (LoQ) were derived essentially as previously described. 44 A zero sample containing dilution buffer alone was analysed 10 times consecutively in the same assay run and the LoB calculated using the formula: LoB = meanblank + 2SDblank. (SD, standard deviation). The lower limit of detection (LLoD) is defined as the lowest analyte concentration that can be distinguished from the LoB. A blank sample was spiked with a small but known concentration of calprotectin using the manufacturer's supplied calibrators and analysed five times consecutively in the same run as the aforementioned LoB samples. Concentrations of calprotectin in the spiked samples were chosen upon the basis of the manufacturer's claimed analytical sensitivity. The LLoD was calculated using the formula: LLoD = LoB + 2SDspiked sample.
The LoQ is defined as the lowest analyte concentration that can be reliably measured with a coefficient of variation (CV) of 20%. A series of samples (calibrators, controls and faecal extracts) containing a range of different calprotectin concentrations were each assayed a minimum of five times (n = 5–10). Intrabatch %CV was plotted against the mean calprotectin concentration for each sample in order to generate a precision profile for each kit. The calprotectin concentration of each replicate was calculated from a calibration curve generated for each assay run using GraphPad Prism version 4.00 (GraphPad Software, San Diego, CA, USA).
Cross-kit comparison study
A series of ‘fresh’ unfrozen stool samples (n = 45) were extracted and analysed using each of the three manufacturer's kits as previously described. Results for the three kits were compared using one-way analysis of variance statistical analysis (GraphPad Prim version 4.00 – GraphPad Software).
Pilot f-Cp EQA scheme
For the inaugural distribution of the pilot EQA scheme, faecal samples (101A–D) were obtained from four consenting laboratory volunteers with or without existing IBD. At the time of collection, two had known IBD (one with Crohn's disease and one with UC) and were ‘mildly’ symptomatic, one had no history of IBD and one had known UC and was symptomatic and experiencing a ‘relapse’. A complete bowel movement was collected from each volunteer using a disposable plastic bucket-type device with a screwlid to avoid toilet water artefacts. The samples were stored at room temperature and processed within 48 h of collection. Samples were thoroughly mixed to homogeneity and divided into 0.3–0.5 g aliquots that were placed in 30 mL polypropylene universal faecal sample pots (International Scientific Supplies Ltd, Bradford, UK) and distributed to participating UK laboratories measuring calprotectin using quantitative ELISA-based methods. Participants were asked to fill in questionnaire about sample requirements and methodology (f-Cp assay and sample extraction methods). Participants were requested not to freeze the stool specimens to prevent potential freezing artefacts and to carry out the extraction step within 72 h of receipt, since f-Cp is stable at room temperature for seven days. The authors from the New Cross Hospital Clinical Chemistry Department participated in the scheme themselves; samples were analysed using all three ELISA assays evaluated. Extraction (manual weighing method) and analysis of the four EQA samples was performed as described above.
Statistical analysis
Data processing and statistical analysis were performed using GraphPad Prism version 4.00 (GraphPad Software) and using Analyse-it® version 2.22 (Analyse-it Software Ltd, Leeds, UK).
Results
Imprecision
The observed %CVs of ELISA assay intrabatch imprecision were 5.0–8.3% (mean: 6.4%), 7.8–11.2% (mean: 10.0%) and 6.7–15.1% (mean: 10.1%) for the Bühlmann, Immunodiagnostik and Eurospital assays, respectively (Table 1). The Bühlmann assay exhibited the best assay interbatch imprecision (Table 1); %CV ranges were 5.3–8.2% (Bühlmann), 7.0–8.9% (Immunodiagnostik) and 7.1–8.2% (Eurospital). In general, the intrabatch imprecision was poorer for the patient extracts than for the manufacturer's control. The intrabatch imprecision of the whole analytical process (AssayTOTAL) was also evaluated at two levels of calprotectin (Table 1). All three kits displayed adequate total-assay imprecision with mean %CV values ≤11.6% in all cases.
Faecal calprotectin assay imprecision data
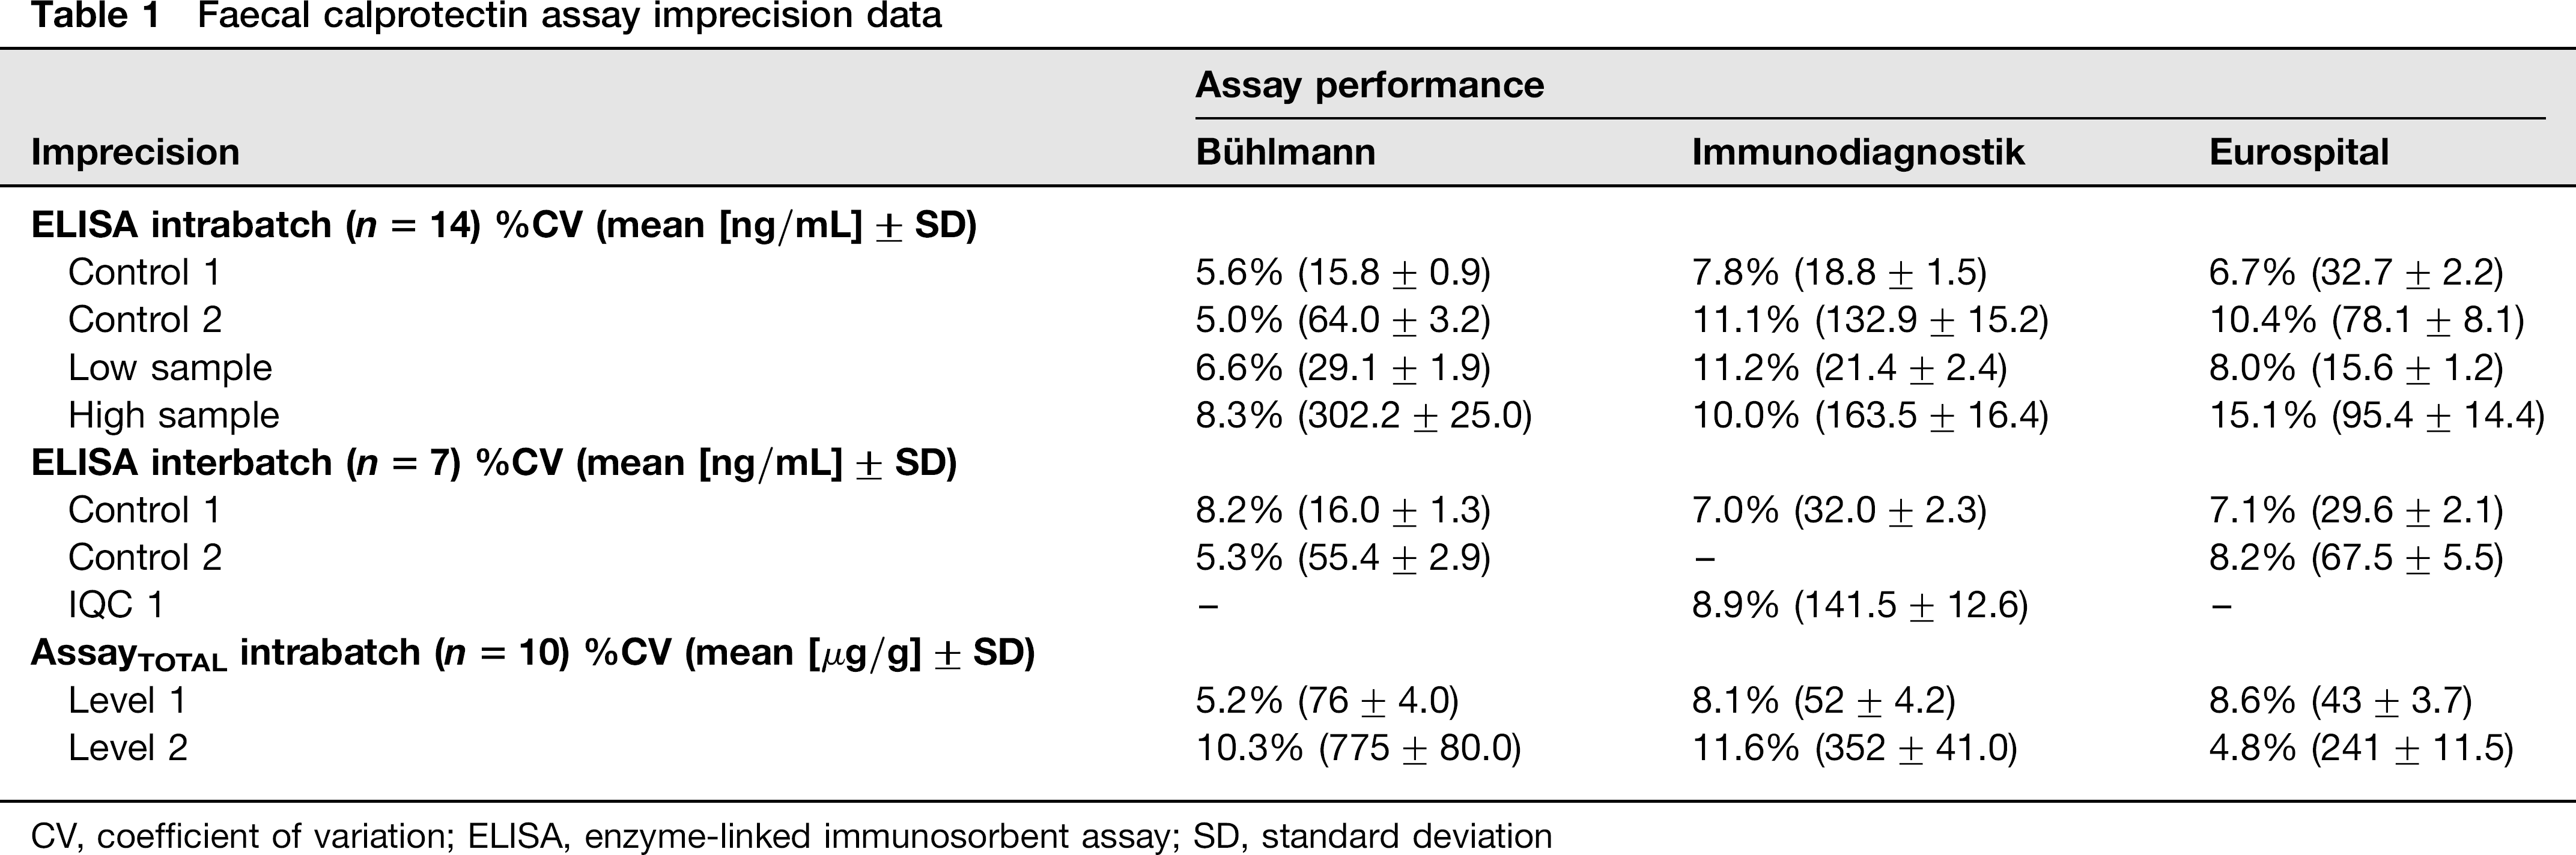
CV, coefficient of variation; ELISA, enzyme-linked immunosorbent assay; SD, standard deviation
Linearity of dilution and recovery
Dilution was adjudged to be linear for all f-Cp assays across the range of concentrations tested on the basis of linear regression analysis (Table 2). Mean percentage deviations for the two samples were 213% (8–17%) and 13% (1– 28%) for Bühlmann assay, 26% (19–39%) and 8% (3–12%) for the Immunodiagnostik assay, and 7% (1–11%) and 17% (0–30%) for the Eurospital assay. The three f-Cp assays demonstrated good calprotectin recovery with the Eurospital assay performing the best overall; mean recoveries for the kits were 96–103% (Table 2). The Immunodiagnostik demonstrated under-recovery at the highest spiked analyte concentration (S1:73%, S2: 81%).
Linearity of dilution, recovery, limit of the blank and lower limit of detection. Recovery data are presented as percentages of the expected values. Dilution linearity linear regression plots are not shown
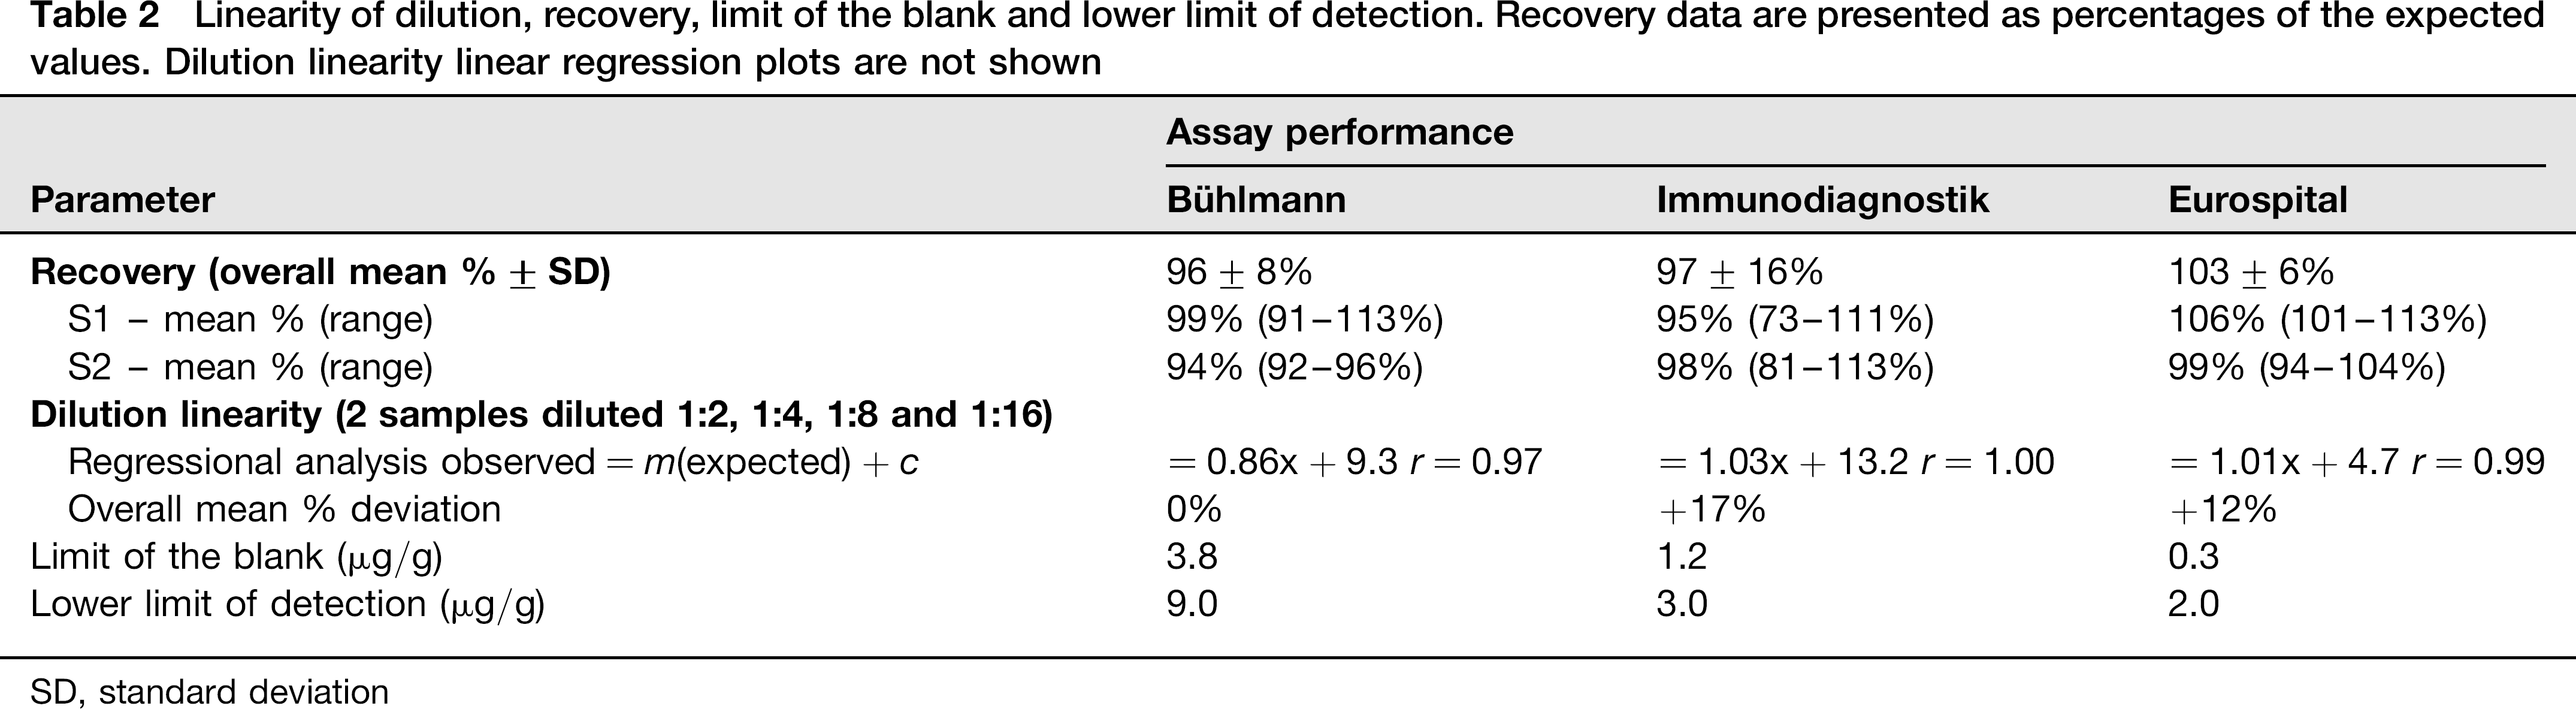
SD, standard deviation
Drift
Whereas no significant drift was observed for the Bühlmann or Immunodiagnostik kits relative to their respective mean %CVs of intrabatch imprecision (see above), a positive cross-plate drift was observed with the Eurospital assay. Mean percentage drift values (n = 7) for the two levels of analyte were 1.3% (range: 24.8–8.5%) and 20.8% (27.7–3.6%), 22.9% (211.9–3.1%) and 6.2% (23.3–18.0%) and 12.0% (2.3–24.1%) and 13.1% (0.6–23.5%) for the Bühlmann, Immunodiagnostik and Eurospital assays, respectively. Mean percentage drift values for the in-house IQC and the manufacturer's kit control materials were comparable for the Immunodiagnostik assay.
LoB, LLoD and LoQ (precision profile)
All three assays displayed insignificant inherent background signal in relation to the decision threshold (50 μg/g); the calculated LoB values were < 4.0 μg/g in all cases (Table 2). Calculated LLoD values were in agreement with, or an improvement on, the claims of the manufacturer (Table 2). Precision profiles are shown in Figure 1. Assay imprecision was < 20% across the stated analytical range of the Bühlmann (10–600 μg/g), Immunodiagnostik (7–2100 μg/g) and Eurospital (15.5–500 μg/g) f-Cp assays.
Precision profiles of f-Cp ELISA assays. Panels (a), (b) and (c) represent the profiles for the Immunodiagnostik, Bühlmann and Eurospital assays, respectively. The dotted vertical lines represent the manufacturer's claimed analytical range; the solid horizontal line represents the 20% CV cut-off criteria for acceptance. f-Cp; faecal calprotectin; ELISA, enzymelinked immunosorbent assay; CV, coefficient of variation
Cross-kit comparison
A common set of faecal samples (n = 45) was analysed on each of the three assays to assess between-kit variability (Figure 2). Median f-Cp concentrations for the Immunodiagnostik and Eurospital assays were 53 μg/g (interquartile range: 19–133) and 32 μg/g (interquartile range: 16–138), respectively, and results were not significantly different (P > 0.05). However, the Bühlmann assay produced significantly (P < 0.001) higher results for the sample set than the other two assays with a median f-Cp concentration of 90 μg/g (interquartile range: 32–349). In nine instances, the Bühlmann assay reported a calprotectin positive result (>50 μg/g) whereas one, or both of the other two assays reported a value less than the cut-off. Calprotectin-negative results were reported by the Eurospital and Immunodiagnostik for five and two samples, respectively, with both kits reporting f-Cp values less than the cut-off in the other two cases.
Cross-kit comparison to assess between-assay variability. A series of fresh faecal samples (n = 45) were extracted and analysed using each f-Cp assay. Medians (thick horizontal lines) and inter-quartile ranges (thin vertical/ horizontal lines) are shown for each assay. f-Cp; faecal calprotectin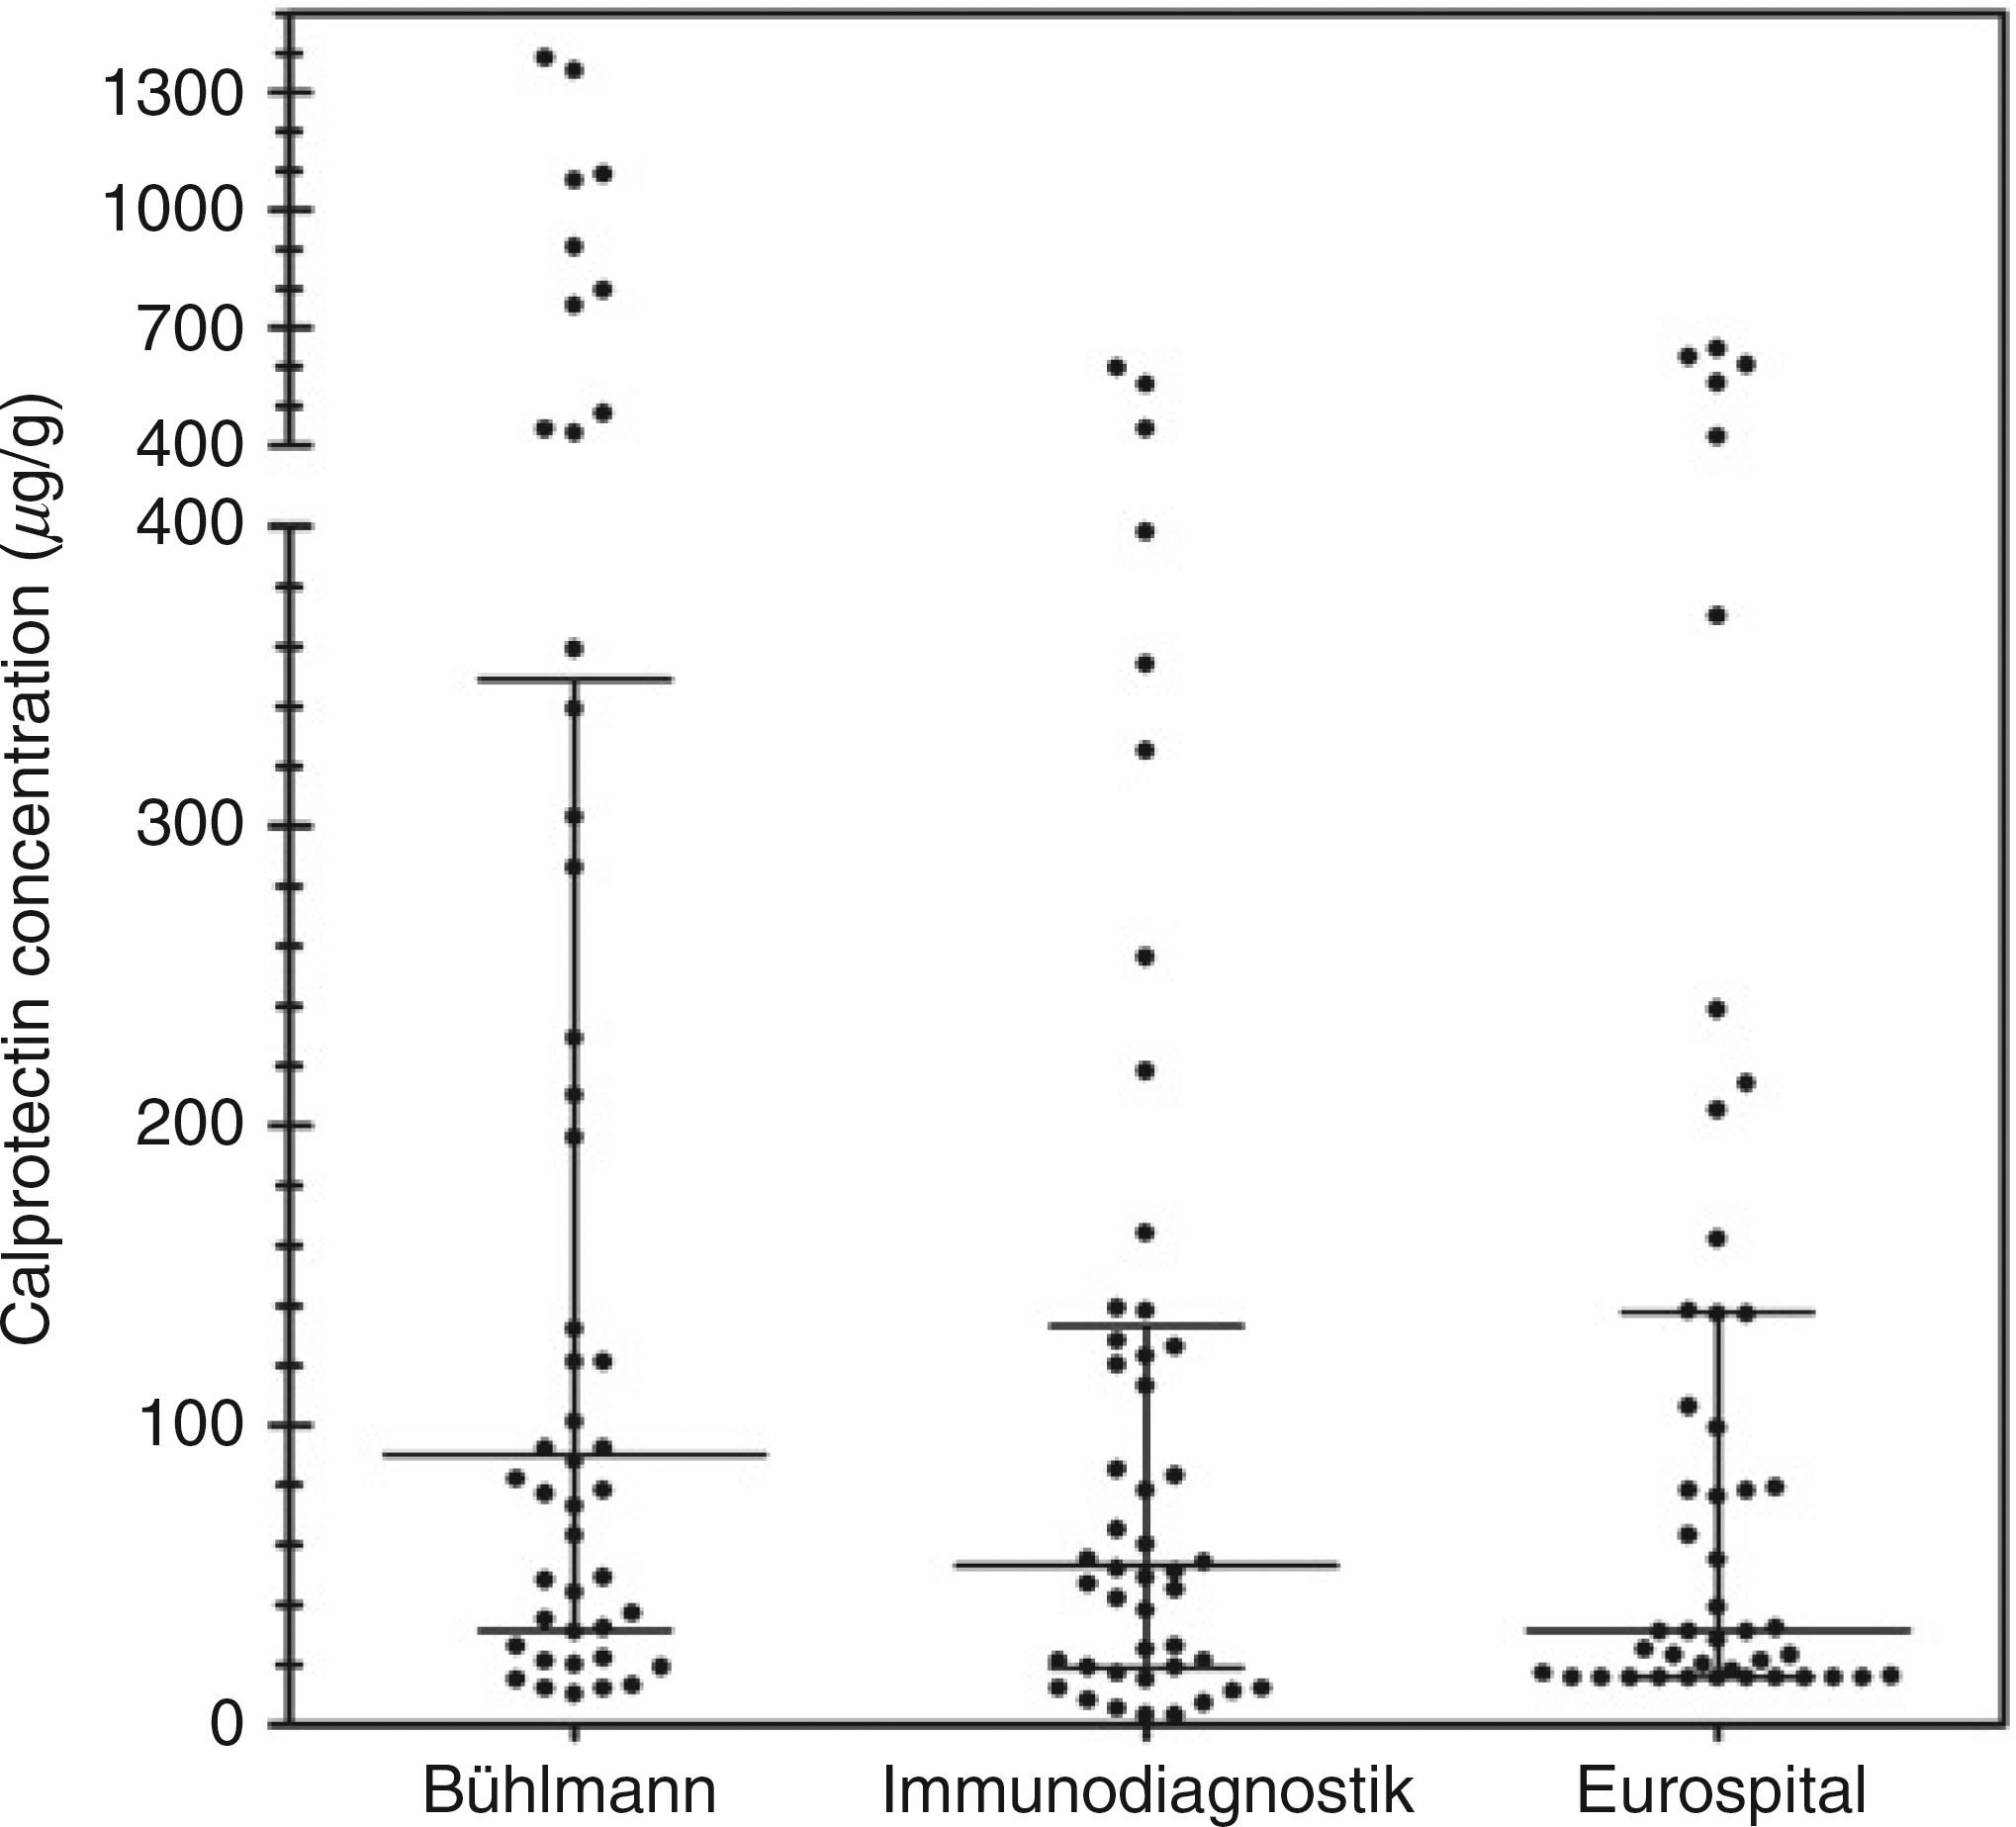
Extraction method
A series of nine samples were extracted using three commercially available preparation devices and the f-Cp concentrations compared with those determined from extracts prepared using the manual weighing approach (Figure 3). The f-Cp concentrations of the nine samples, as determined by the manual extraction method, ranged between 58 and 638 μg/g (Figure 3). Extraction of faecal samples with the commercial devices led to an under-recovery of calprotectin in comparison with the manual method. The overall mean biases of the Roche, ScheBo and Immunodiagnostik devices were 228.1%, 225.4% and 27.8%, respectively. Of interest is sample five, which was selected because of its watery consistency (Figure 3). The percentage recovery for this sample using the ScheBo and Immunodiagnostik devices was only ∼5%. In this case, collection grooves on the dosing tips of these devices were unable to hold the very fluid sample.
Comparison of three commercially available faecal preparation devices with the manual extraction procedure. The dotted horizontal line represents agreement with the manual extraction method; f-Cp concentrations of the sample extracts prepared using the manual weighing approach are stated in the table. f-Cp; faecal calprotectin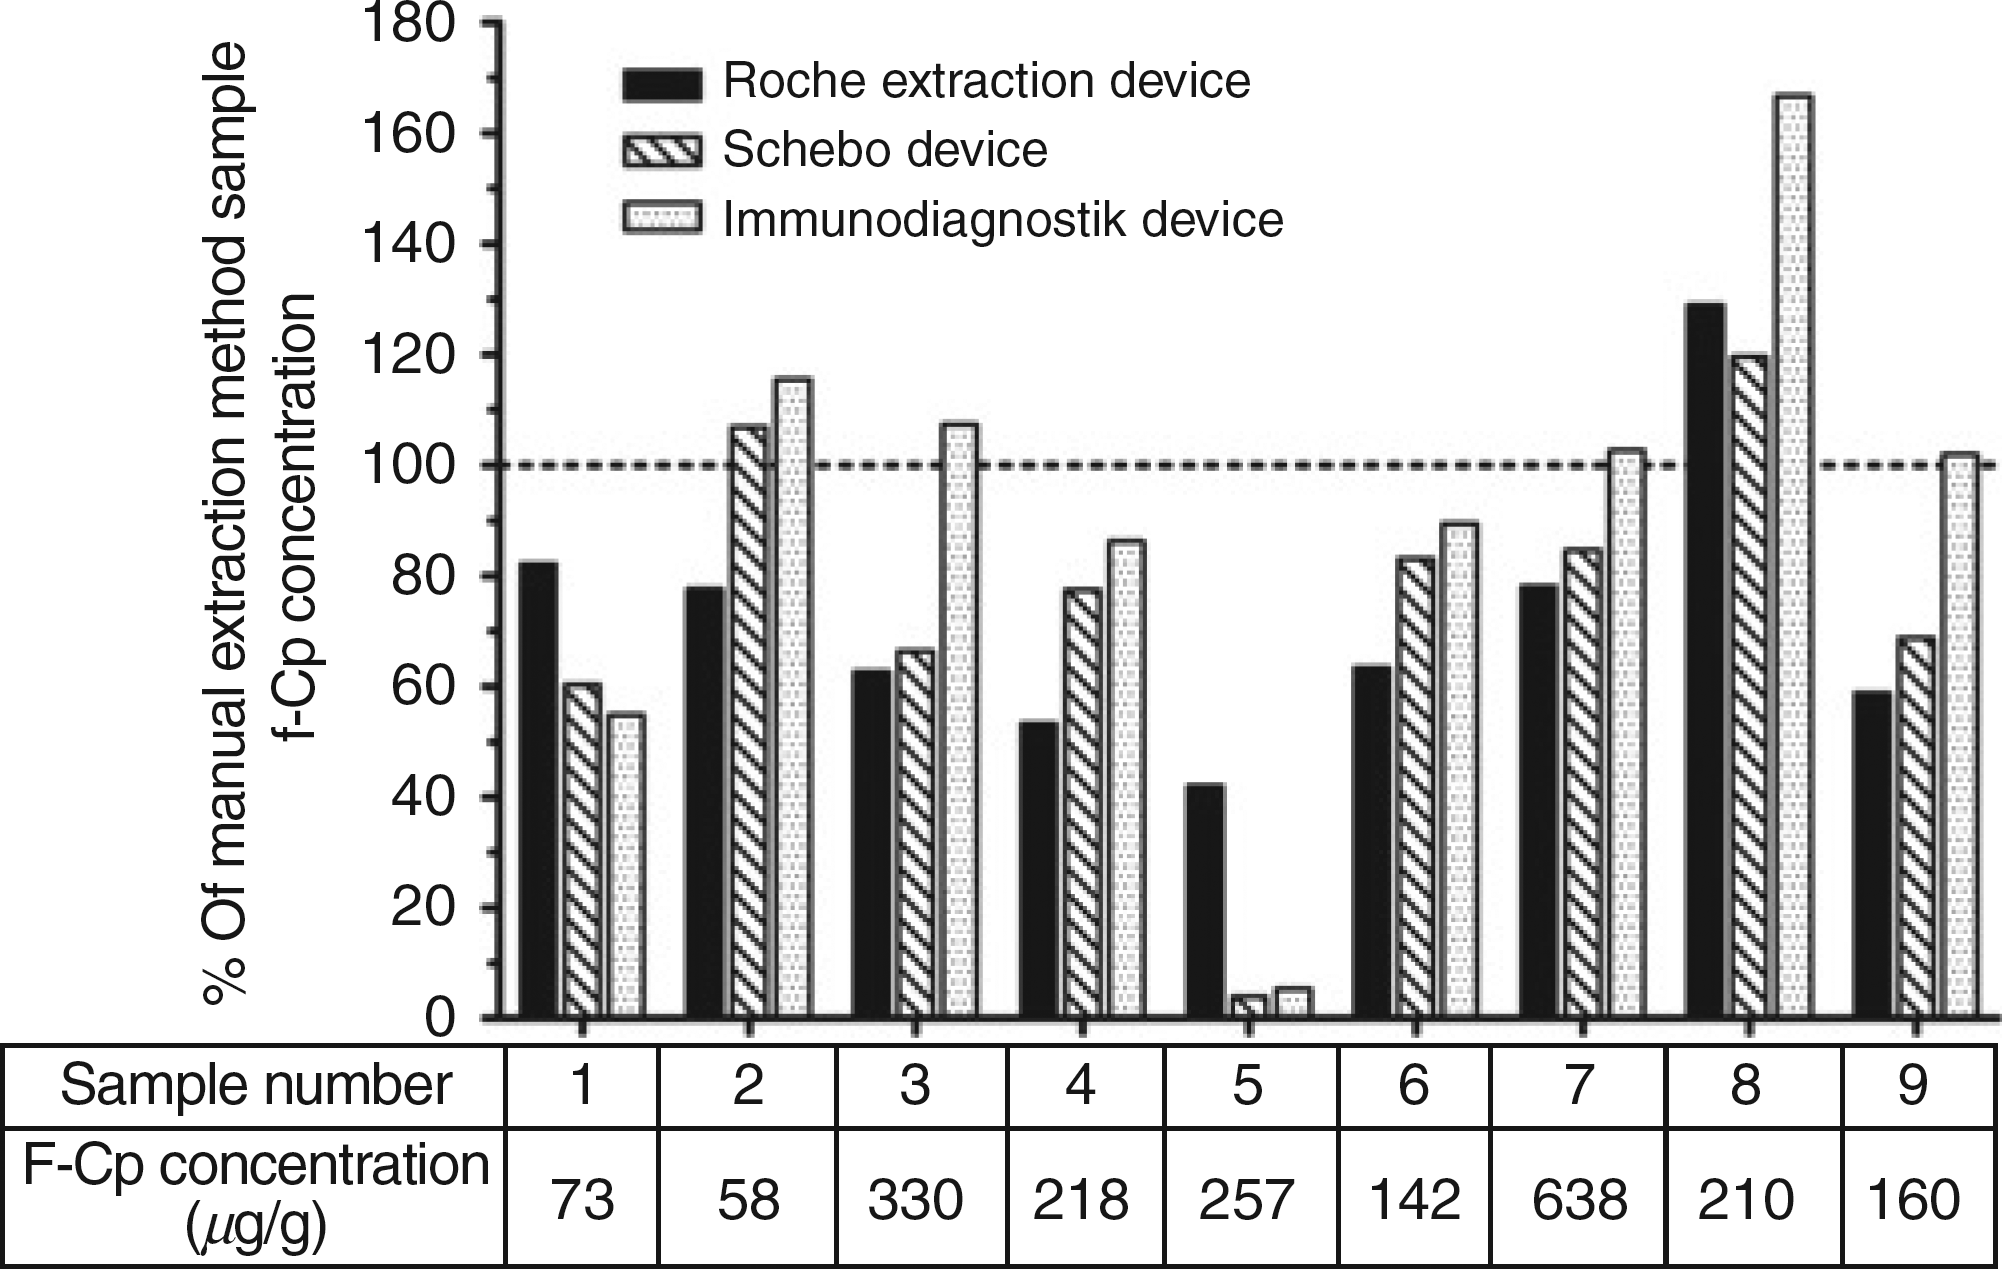
Pilot f-Cp EQA scheme
Four faecal samples were sent to 15 participating laboratories measuring f-Cp in the inaugural distribution of the pilot EQA scheme (Figure 4 and Table 3); results were returned by all but one participant. Some participants, including the authors from the New Cross Hospital Clinical Chemistry Department (Bühlmann, Immunodiagnostik and Eurospital), returned results for more than one manufacturer's ELISA, thus accounting for the additional three returns. The most commonly used method was the Bühlmann EK-CAL assay (7/18 returns). The majority of the participating laboratories (10/16) reported that they were using the manual method of extraction with the remaining six using commercially available stool preparation systems.
Returns for the first distribution of the pilot UK-NEQAS faecal calprotectin EQA scheme from laboratories utilising ELISA-based methods. Samples 101A-D are shown in panels A-D whereby the panel letter (A-D) corresponds to the sample ID of the same letter. The calprotectin concentration of each return is plotted against the assay type. Solid symbols represent the return of a numerical result whereas open symbols represent those reported as ‘less than’ (O) or ‘more than’ (□) results. Mean calprotectin values are represented as solid horizontal lines in instances when two or more numerical results were returned. EQA, external quality assurance; ELISA, enzyme-linked immunosorbent assay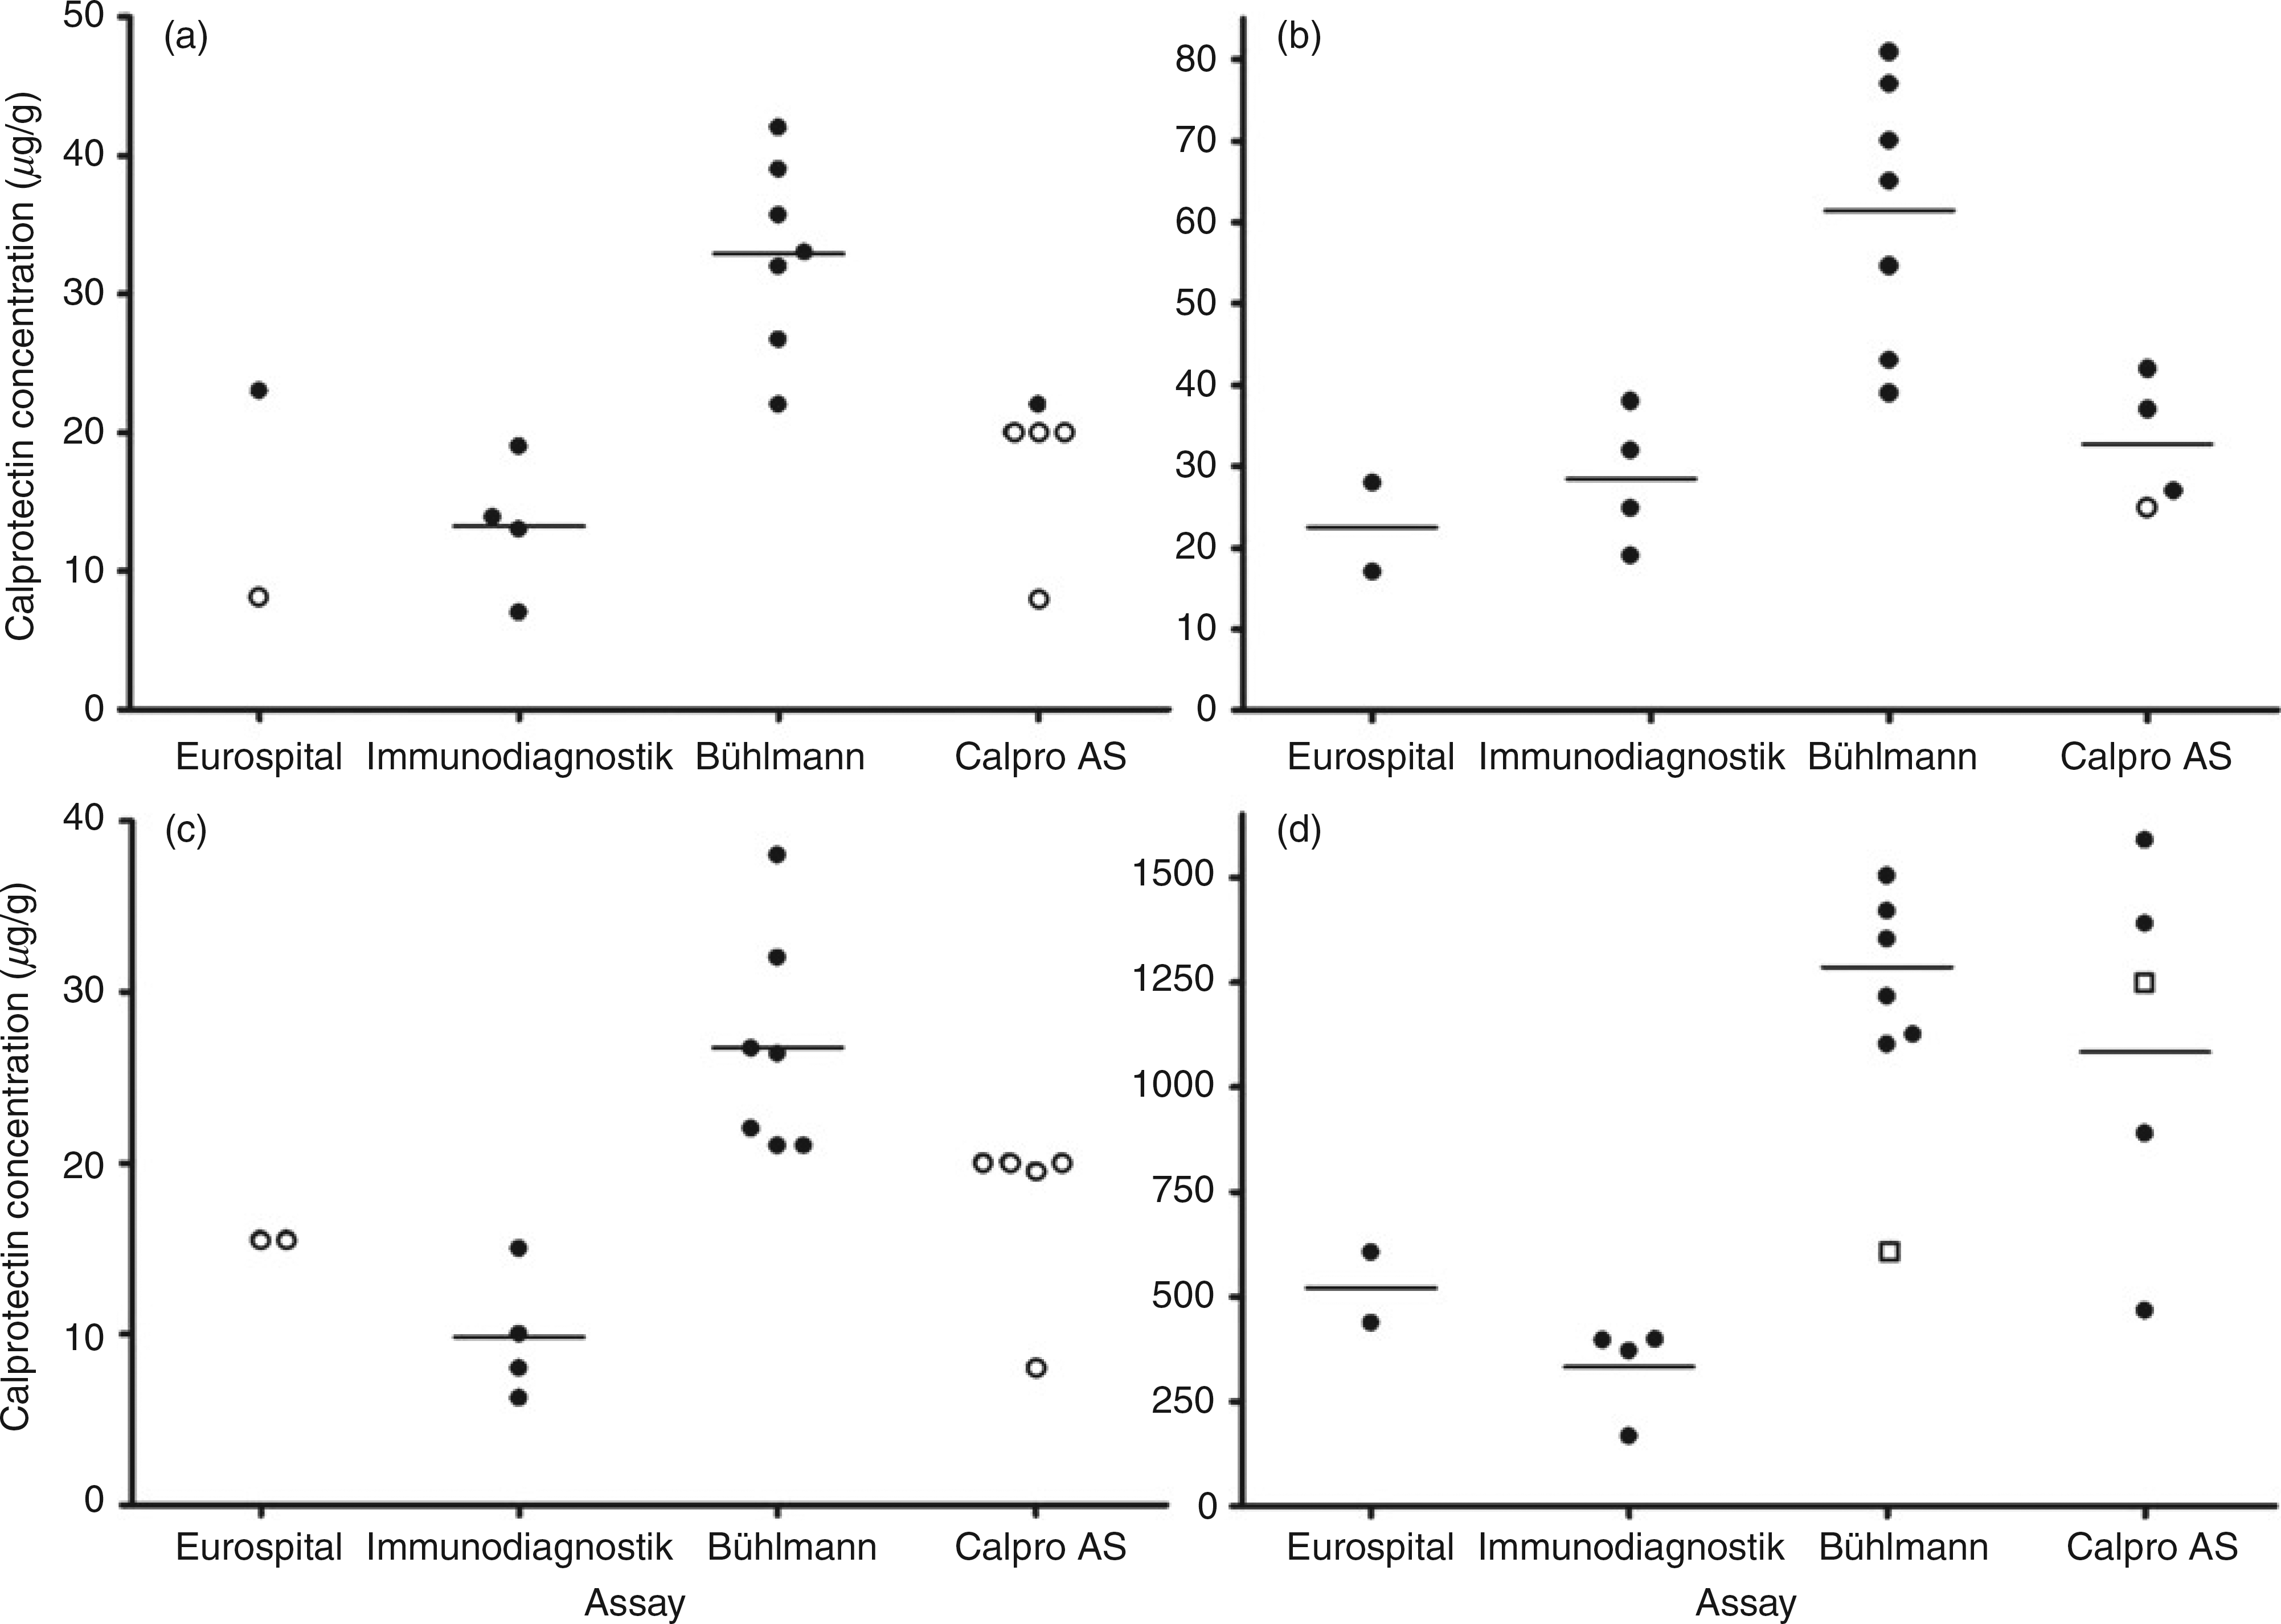
Summary of the EQA returns from participants for the first distribution of the pilot faecal calprotectin scheme. Consensus results are indicated by asterisks
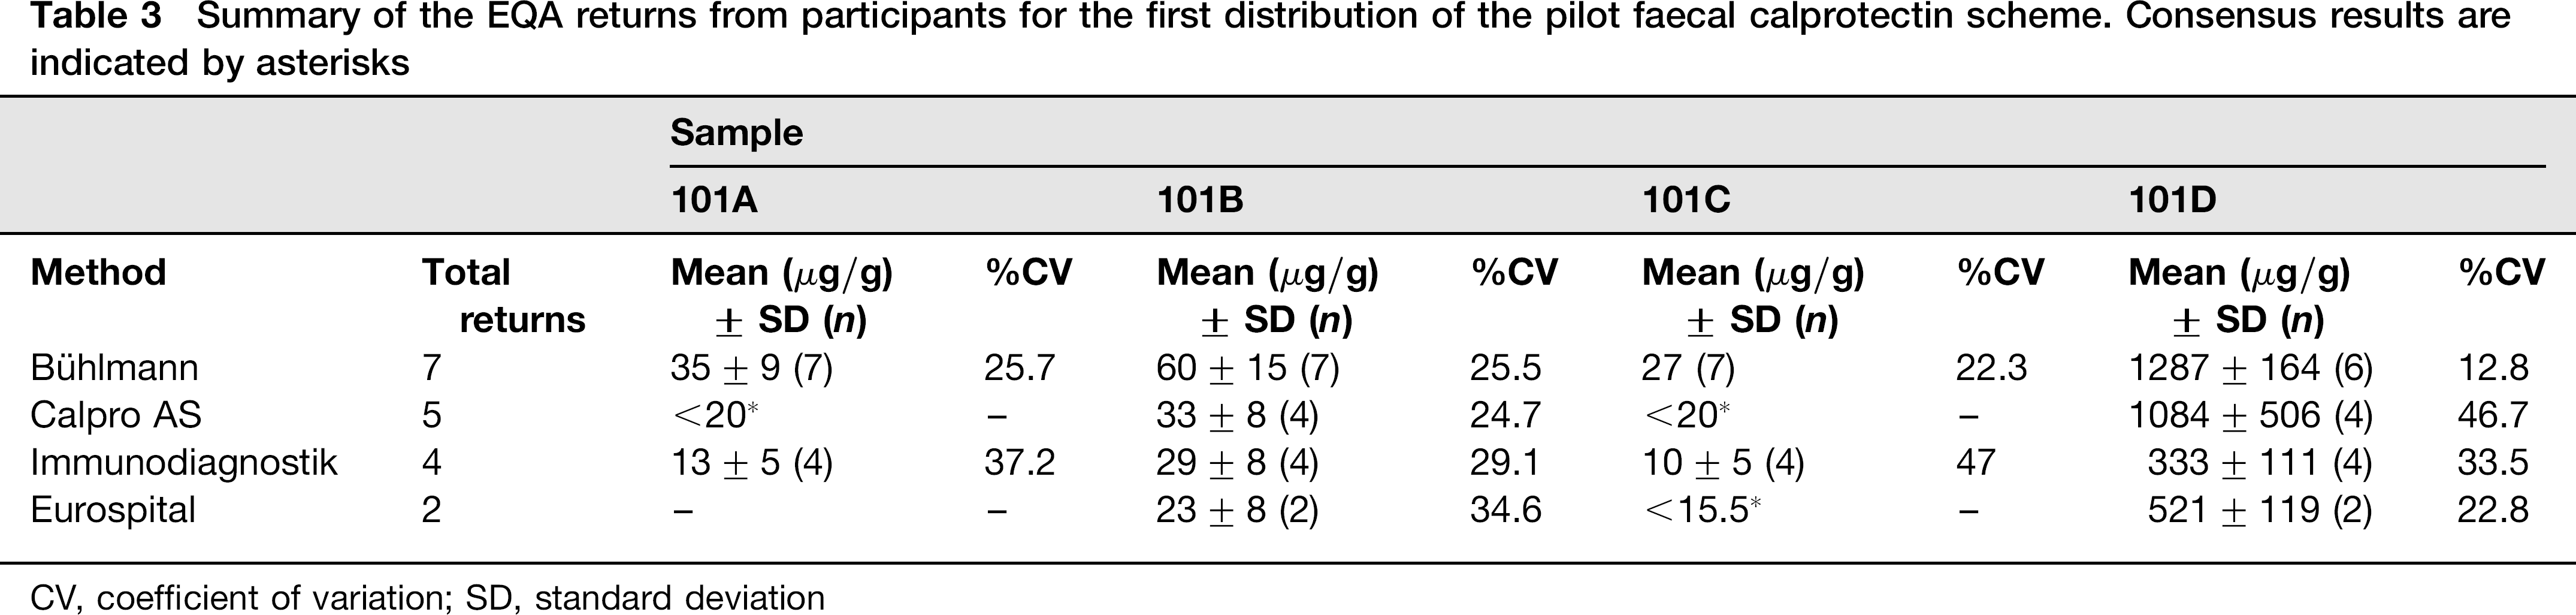
CV, coefficient of variation; SD, standard deviation
Anonymized results from the scheme participants for the first distribution of the pilot scheme (101) are presented in Figure 4; panels a–d represent the returns for samples 101A–D, respectively. The participant returns are summarized in Table 3. It was not possible to calculate means and CVs for all samples in all method groups because the majority of results returned for some samples were reported as ‘less than’ or ‘greater than’ rather than numerical values. The key observation from this initial set of data is that the f-Cp result obtained for a sample can vary significantly depending upon which method is being used (Figure 4). The Bühlmann method tended to give higher results than those generated from the Immunodiagnostik and Eurospital assays, in agreement with the between-assay variability study data (Figure 2). Where calculable, the mean calprotectin results by Bühlmann users were on average 2.8 (range: 2.1–3.8) and 2.5 (2.5–2.6) times higher than those reported for the Immunodiagnostik and Eurospital assays, respectively. At high f-Cp concentrations (Figure 4d), the results by the Calpro AS PhiCal Test were similar to those reported by the Bühlmann assay. For sample C, two Bühlmann users reported f-Cp concentrations below the manufacturer's cut-off value with the remainder of results above the 50 μg/g cut-off; all other methods reported the sample as calprotectin negative.
Discussion
Although there were differences between the three f-Cp ELISA assays, they all had acceptable intra- and interbatch imprecision, good calprotectin recovery and exhibited dilution linearity across the range of concentrations tested. The evaluation data were in agreement with that stated by the respective manufacturers and, therefore, all methods are suitable for routine laboratory measurement of f-Cp. There is no standard reference material or reference method listed on the Joint Committee for Traceability in Laboratory Medicine database for the measurement of calprotectin. Accuracy could not be evaluated due to the lack of a reference method. Ideally, the recovery of the f-Cp kits would have been assessed independently using a certified source of pure calprotectin to spike unextracted faecal material, thus testing both the preanalytical and analytical steps of the each assay. However, due to the lack of a certified calprotectin reference material, experiments in this study were limited to using the manufacturer's supplied kit calibrators to spike faecal extracts. The supplied assay calibrators are prediluted (ng/mL calprotectin) and thus could not be used to spike unextracted faecal material. Following the 2500-fold dilution step during sample extraction, the concentration of calprotectin in the resulting extracts would have been below the ng/mL measuring range of the assays. No significant cross-plate drift was observed for the Immunodiagnostik and Bühlmann assays relative to the assay imprecision of the assays. However, the Eurospital assay exhibited a positive assay drift when run according to the manufacturer's protocol.
The faecal extraction step required prior to ELISA analysis contributes to the overall imprecision of the f-Cp assay and so it is necessary to not only evaluate the imprecision of the ELISA quantitation step, but also the whole combined analytical process. When the extraction step was included in the estimation of imprecision, all three assays displayed %CVs that were comparable with the intrabatch imprecision for the ELISA analytical step alone. Sample extraction can either be performed manually or using commercially available extraction devices. Three extraction devices (Roche, Immunodiagnostik and ScheBo Biotech) were compared with the manual extraction method that served as the reference method because it involves accurately weighed amounts of stool whereas the commercial extraction systems utilise a fixed volume of faecal material to equate to a defined weight of stool. The data presented suggest that the commercial extraction systems under-sample when compared with the manual approach. This was particularly evident with watery stools, which are not uncommon given that chronic diarrhoea is an indication for f-Cp measurement.
The Birmingham Quality (UK NEQAS) pilot EQA scheme described here is the only programme available covering the measurement of f-Cp. Initial data from the first distribution of the pilot scheme have highlighted the lack of f-Cp ELISA assay standardization. The Bühlmann assay tended to give higher results (up to 3.8-fold) than the Immunodiagnostik and Eurospital assays, supporting the between-kit assay differences reported in this study. This is despite the fact that the three manufacturers’ recommended cut-off values for differentiating IBD from IBS are identical.42,45–47 We have presented the data that show that the choice of kit affects whether a sample is above or below the cut-off. The observed assay discordance is not just an issue in terms of potential patient misclassification but also when f-Cp is used to monitor the disease course of known IBD patients. This study has therefore identified the need for both a standardized calprotectin reference material against which these assays can be calibrated, as well as an in-house clinical evaluation. By comparing f-Cp concentrations with endoscopy and histology, the diagnostic accuracy of the assays can be verified and if necessary, be used to establish local cut-off values according to the intended use i.e. diagnostic versus disease monitoring.
Conclusion
The between f-Cp assay variability reported in this study has indicated the need for assay standardization. In the meantime, each laboratory should investigate transferability of the manufacturer's cut-off values to its patient population and if necessary, determine its own local cut-off values to optimally identify IBS and avoid the need for further costly and invasive investigations.
DECLARATIONS
Footnotes
Acknowledgements:
The authors are grateful to Dr Joanne Marsden (Clinical Biochemistry, Kings College Hospital, London), Chris Lennon (Clinical Biochemistry, York Hospital, York), Dr Jinny Jeffery (Derriford Combined Laboratory, Derriford Hospital, Plymouth) and Sonia Bradbury (Clinical Biochemistry and Immunology, Addenbrooke's Hospital, Cambridge) for their advice and donation of samples. We would also like to thank Birmingham Quality (UK-NEQAS) for administrating the EQA scheme and the New Cross Hospital (Wolverhampton) microbiology department for use of the Triturus instrument. Data presented in this manuscript formed part of a project submitted by SJW to the University of Birmingham in fulfilment of his Clinical Biochemistry MSc.