
Abstract
Background
The clinical utility of serum κ and λ free light chains (FLC) for the diagnosis and prognosis of plasma cell proliferative disorders is well established. We assessed the analytical performance of the N Latex FLC assays and compared it with the Freelite™ assays.
Methods
Analytical precision was assessed according to the CLSI EP5-A2 protocol. Method comparison was performed with 116 clinical samples and linearity was assessed on samples with monoclonal and polyclonal elevations of FLC. Analytical bias and variance was measured with two lots of N Latex FLC reagent.
Results
The N Latex FLC κ and λ assays had a total coefficient of variation of 5–7% across the analytical range. The slopes were 1.36 and 1.37 and the between-method variances were 40.0% and 45.4%, respectively, compared with the Freelite™. Good agreement in classification was observed for κ, λ and the κ/λ ratio (Cohen's κ 0.84, 0.76 and 0.89). Statistical non-linearity occurred commonly, but clinically significant non-linearity was observed in only one instance. Between-reagent lot variation was 7.3% and 10% for κ and λ, respectively.
Conclusions
The N Latex FLC assay has good precision, did not exhibit gross antigen excess and can be used in clinical practice based on the analytical performance characteristics.
Introduction
Monoclonal immunoglobulin free light chains (FLC) are important tumour markers often present in serum and urine of patients with monoclonal gammopathies. Serum κ and λ FLC assays measure polyclonal and monoclonal FLC in serum and the calculated κ/λ FLC ratio is a surrogate measure of clonality. Retrospective clinical studies have demonstrated the clinical utility of serum FLC measured by Freelite™ for the diagnosis and prognosis in plasma cell proliferative disorders, including primary amyloidosis, non-secretory myeloma, light chain multiple myeloma, light chain deposition disease and solitary plasmacytoma. Furthermore, the clinical use of FLC in documenting stringent complete response in multiple myeloma and for routine serial measurement to assess response in oligo-secretory diseases has been shown. 1,2
Immunoassay methods for serum FLC quantitation require adequate precision, specificity, accuracy and reproducibility between reagent batches. The Freelite™ polyclonal antibody-based assay, however, is reported to suffer from both low-concentration imprecision and lot-to-lot reagent variation of 8–45% for FLC concentrations and 17–32% for the calculated κ/λ FLC ratio. 3 This variation may lead to misinterpretation when monitoring patients, as doubling (or halving) of the ratio can occur in the absence of a change in disease status.
Samples from some patients are also reported to give under- or overestimation which can hinder accurate monitoring of disease response. Overestimation can occur due to the presence of polymeric forms that may react at multiple antigenic sites on the FLC molecules. 4,5 Some monoclonal FLC concentrations are reported to be manifold higher than estimated from serum protein electrophoresis. 6,7 In contrast, underestimation may occur due to the presence of antigen excess or from non-linear FLC reactivity on sample dilution. 8–13 FLC measurement spans the concentration range of 1 to 100,000 mg/L, and similar to the immunonephelometric quantitation of intact immunoglobulins, reliable automatic antigen excess testing is a requirement for measurement of serum FLC to avoid falsely underestimated concentration and inappropriate disease management.
Recently, serum κ and λ FLC immunonephelometric assays based on monoclonal antibodies have become commercially available. 14 We critically assessed the analytical performance of the new assays and compared it with the polyclonal Freelite™ κ and λ FLC assays for the characteristics of precision, method comparison, lot-to-lot variation, antigen excess and dilutional linearity. Here, we report on the findings of the analytical performance evaluation.
Materials and methods
Serum FLC were measured in batch mode with two commercial reagent kits: Freelite™ (Human Kappa and Lambda Free kits; The Binding Site Ltd, Birmingham, UK) and N Latex FLC κ and λ assays (Siemens Healthcare Diagnostics, Marburg, Germany) on a Siemens BNII nephelometer according to the respective manufacturer's instructions. For the sake of brevity, the respective analytical systems are referred to as Freelite™ and N Latex FLC hereafter.
Analytical precision was assessed according to the CLSI EP5-A2 protocol, with a two run per day design over 20 days. 15 Five serum pools across the standard measuring range (approximately 5–100 mg/L according to the N Latex FLC assay) were prepared from routine patient samples that had no detectable monoclonal bands with serum electrophoresis and immunofixation. Each pool was consistently analysed with the same instrument dilution factor for the duration of the study. Aliquots were stored at −20°C until analysis.
Serum samples submitted for routine FLC analysis during the study period were stored at −20°C and thawed once before analysis in batch mode. Analysis with the routine Freelite™ method was followed by the N Latex FLC as separate batches. The results of the Freelite™ assays were used to select samples (n = 116) to ensure that an adequate range of results were available for statistical analysis. A total of 278 samples were potentially available for analysis, of which 162 samples with a Freelite™ result below 50 mg/L were not analysed with the N Latex FLC assay. No result that was generated with the N Latex FLC assay was excluded from the analysis. The initial dilution factor for both κ and λ on Freelite™ was 1/100, while the factors for the N Latex FLC κ and λ were 1/100 and 1/20, respectively. Results outside the reportable ranges were subsequently repeated at the next appropriate dilution until a reportable result was achieved.
Passing–Bablok regressions and difference plots were performed to assess the relationships between methods. Agreement between assays, relative to their respective cut-off levels, was assessed with Cohen's κ statistic. Variances between methods and reagent lots were determined from the observed variances of differences and the within-method variances obtained from precision data as discussed elsewhere. 16
To test for antigen excess and non-linearity of the FLC assays, we assayed dilutions of serum samples in a library of 10 monoclonal κ and 10 monoclonal λ samples, as well as five patients with polyclonal increases in κ and λ. The monoclonal library samples were kept at −80°C for a period of up to six years before this study. The samples with polyclonal elevations of κ and λ were selected from routine samples with marked polyclonal elevations of total immunoglobulins. A total of 60 dilution series were performed (15 Freelite™ κ, 15 Freelite™ λ and 15 N Latex FLC κ, 15 N Latex FLC λ). The monoclonal samples were from patients in whom antigen excess and/or non-linearity were previously detected with the Freelite™ assay and results on some of these patients were published previously. 3 Dilutions were performed with the Siemens N Diluent (OUMT65) to achieve a dilution series comprising 0.05; 0.1; 0.2; 0.5; 0.7; 0.8; 0.9; and a neat sample. Results were standardized as a fraction of the average value obtained over all dilutions. Statistical non-linearity was determined according to the CLSI EP6-A protocol. 17 A clinically significant deviation from linearity was arbitrarily defined as two or more results outside a limit defined by ±0.05 (5%) at the lowest level and ±0.15 (15%) for the neat sample.
Variance between two N Latex FLC reagent lots, calibrated with the same calibrators, was assessed on a subset of samples from the method comparison study. The samples were stored at −20°C for one month and underwent two freeze–thaw cycles. The average bias between lots was established from difference plots.
Results
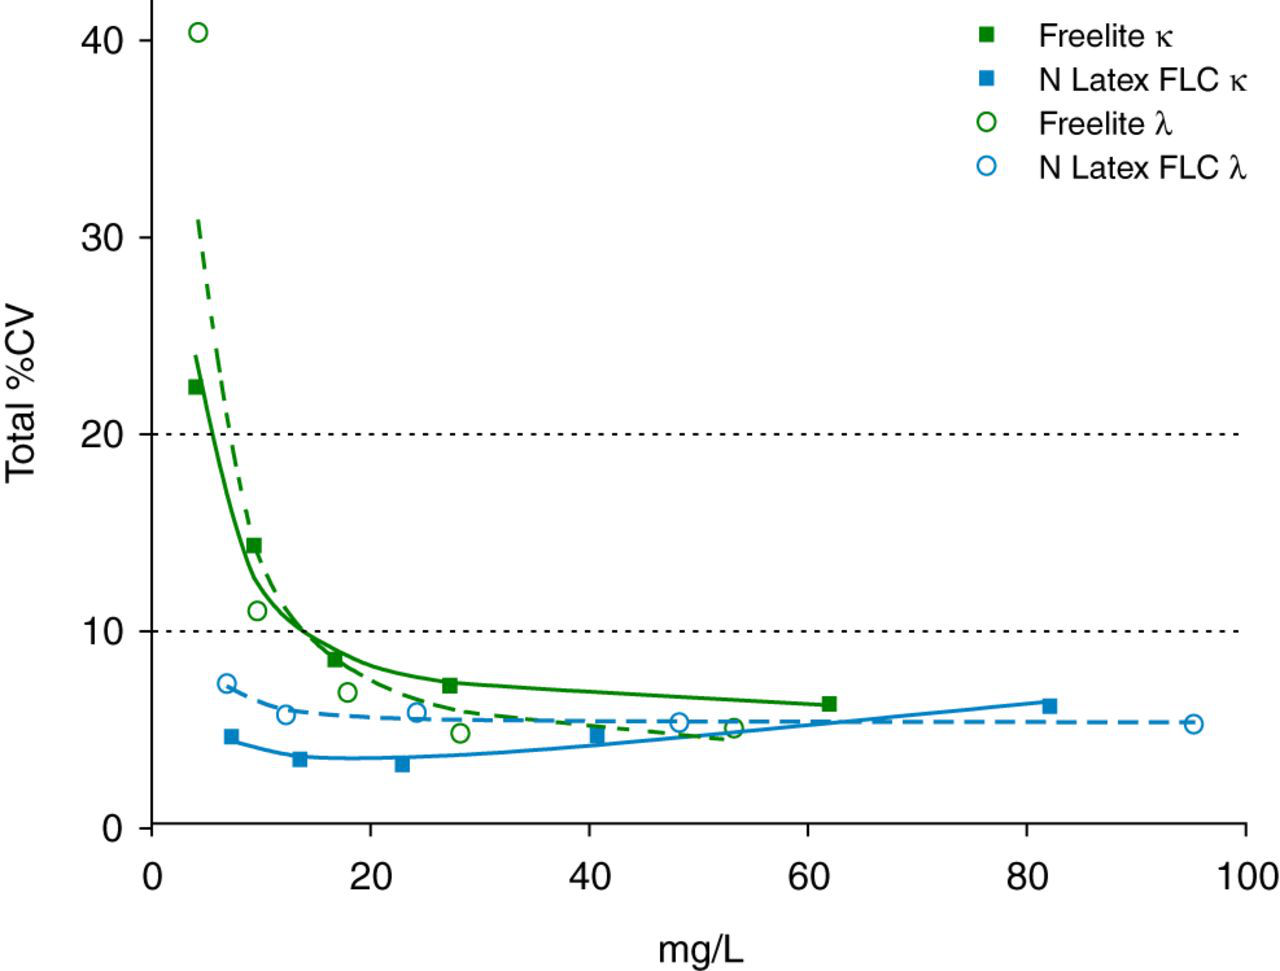
The results of the precision study are summarized in Figure 1. The N Latex FLC κ and λ assays demonstrated good precision with a total % coefficient of variation (CV) less than 5–7% across the measuring range. In contrast, the total %CV of the lowest pool on the Freelite™ assay exceeded the 20% acceptable limit for both κ and λ assays.
Precision profile of the total % coefficient of variation (CV) estimated according to CLSI EP5-A2. Squares (open and filled) indicate Freelite™ κ and N Latex FLC κ and circles (open and filled) indicate Freelite™ λ and N Latex FLC λ
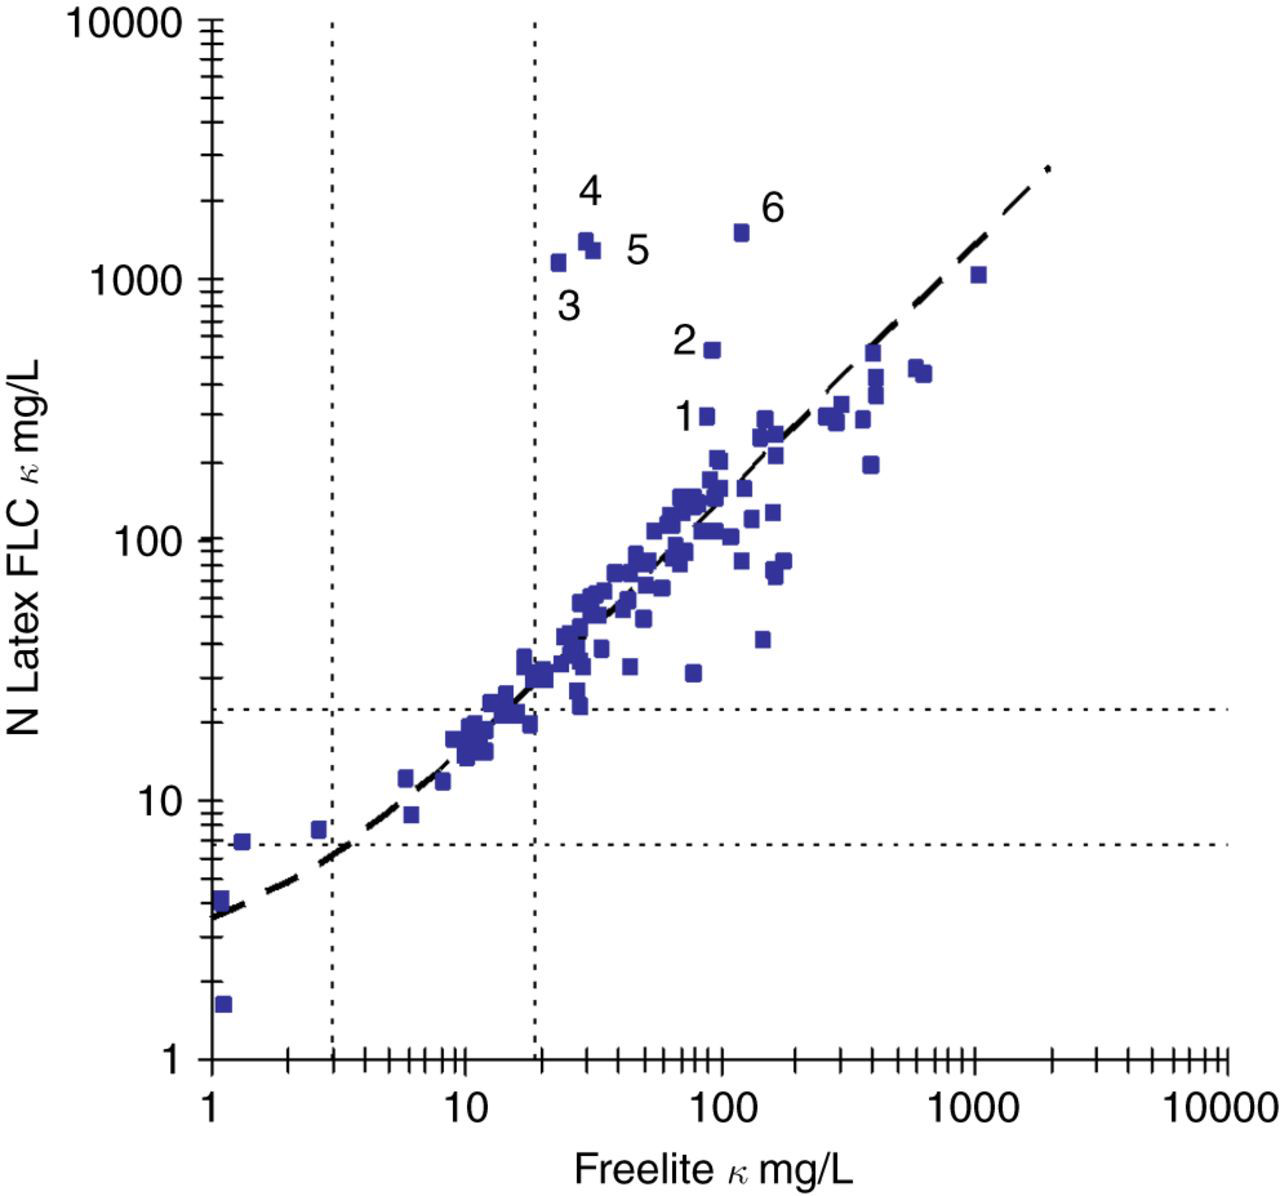
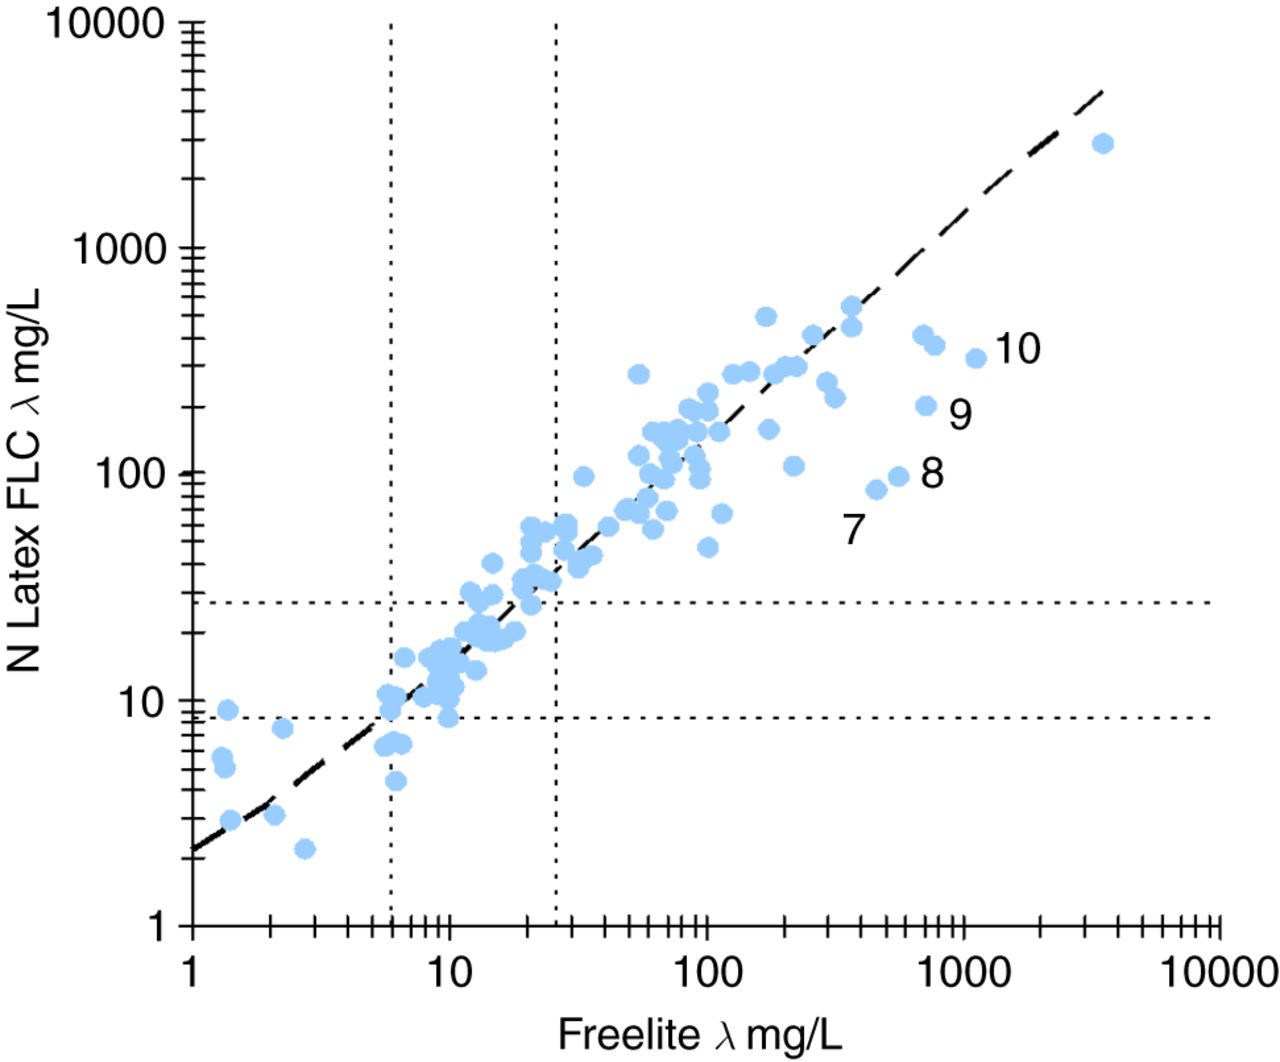
The scatterplots for both κ (Figure 2) and λ (Figure 3) demonstrated a linear relationship with both a wide dispersion of results around the regression lines as well as discordant classification at the respective decision levels. The average variances between the Freelite™ and N Latex FLC assays were 40.0% and 45.4% for κ and λ, respectively, after taking into account the precision of the two methods. The results obtained with the N Latex FLC κ and λ assays were proportionally higher than those obtained on the Freelite™ assays with slopes of 1.36 and 1.37. The regression analysis suggests that the upper reference limit of the N Latex FLC κ and λ assays should be adjusted to 29 and 37 mg/L, respectively, to be equivalent to the Freelite™ assays.
κ FLC scatter plot. N Latex FLC = 2.11 + 1.36 × Freelite™; 95% CI for offset −0.89 to 4.35 and 95% CI for slope 1.22–1.54, n = 116. Reference ranges for the Freelite™ (3.3–19.4 mg/L) and N Latex FLC (6.7–22.4 mg/L) are indicated with dotted lines. Samples 1–6 are listed in Table 1
λ FLC scatter plot. N Latex FLC = 0.81 + 1.37 × Freelite™; 95% CI for offset −1.59 to 3.20 and 95% CI for slope 1.26–1.50, n = 116. Reference ranges for the Freelite™ (5.7–26.3 mg/L) and N Latex FLC (8.3–27.0 mg/L) are indicated with dotted lines. Samples 7–10 are listed in Table 1
Summary of samples with discrepant κ or λ free light chain results
BJP, Bence Jones protein
Results are presented as mg/L with the instrument dilution in brackets
Summary of samples with discordant κ/λ ratios
BJP, Bence Jones protein; MGUS, monoclonal gammopathy of uncertain significance; CMML, chronic myelomonocytic leukemia
Results are reported as κ/λ ratio followed by (κ mg/L; λ mg/L)
*Refers to samples identified in Figure 4
†Identical to sample 7 in Table 1
‡Identical to sample 8 in Table 1
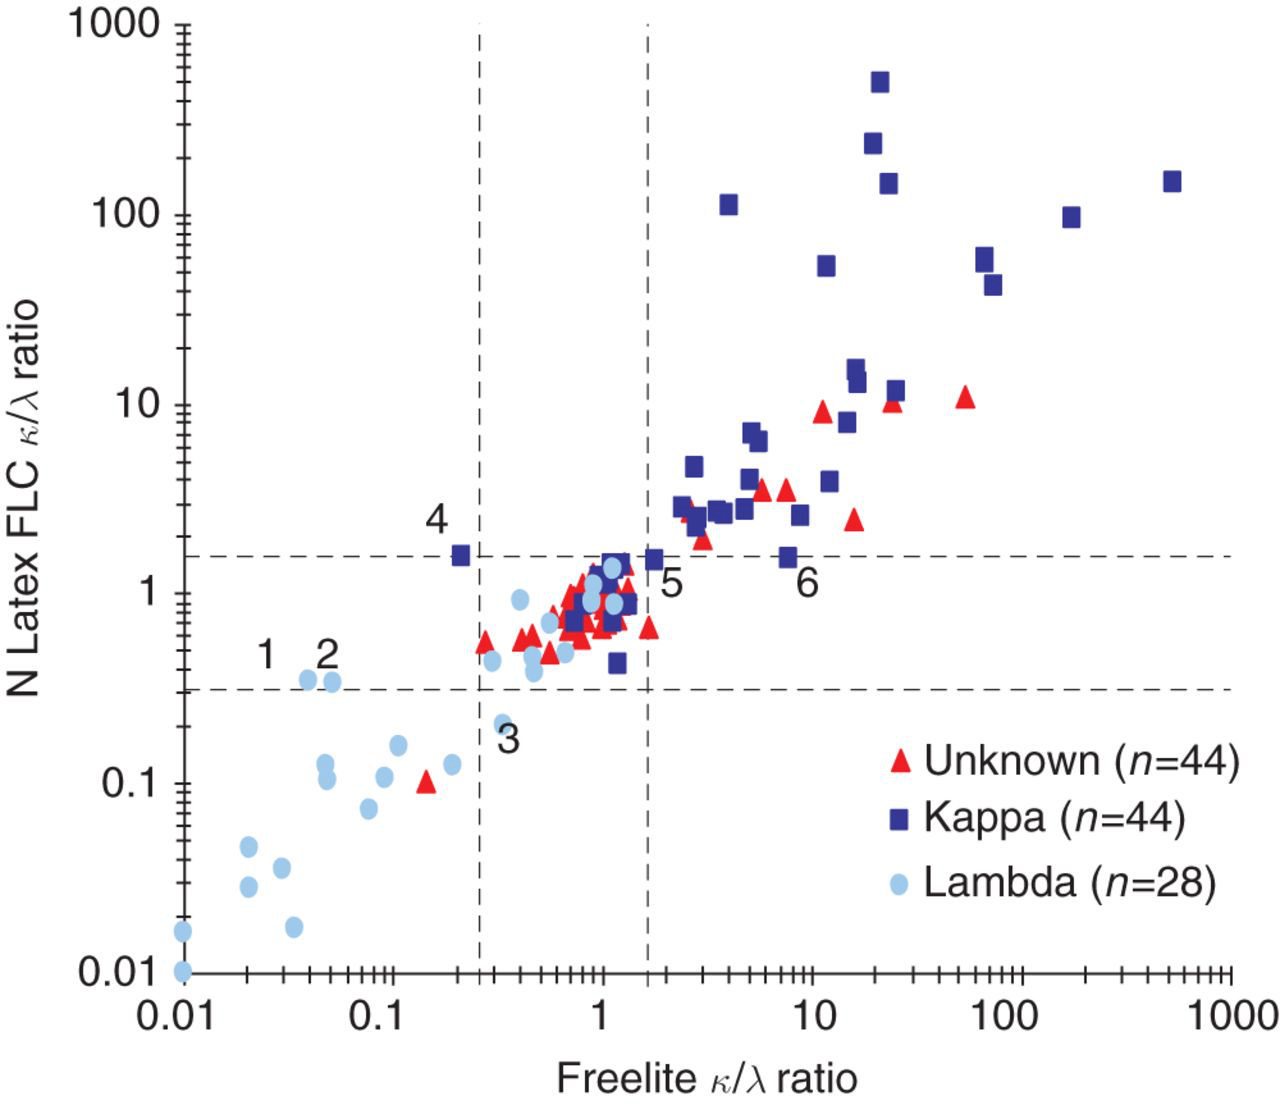
κ/λ ratio scatter plot. Reference ranges for the Freelite™ (0.26–1.65) and N Latex FLC (0.31–1.56) are indicated with dotted lines. The results of samples 1–6 are listed in Table 2. Unknown: cases where no additional clinical or laboratory information was available on the presence or type of monoclonal band. Kappa: cases known to have a monoclonal κ paraprotein. Lambda: cases known to have a monoclonal λ paraprotein
The results of the dilution studies are summarized in Figure 5. Results for two patients where clinically significant non-linearity was detected, as well as a representative selection of the balance of the linearity experiments, are shown for reasons of clarity. On the Freelite™ κ assay, one case of antigen excess was detected with the result obtained on the sample within the initial reportable range of the assay at 23.3 mg/L. Further dilution of this sample resulted in a final concentration of 1360 mg/L while the reported result on the N Latex FLC was 1140 mg/L. Clinically significant non-linearity was detected in another sample with the N Latex FLC κ assay with an initial result of 71 mg/L, a final concentration of 114 mg/L and a Freelite™ κ result of 254 mg/L. The findings in both samples were confirmed with a second independent sample from the respective patients. Statistically significant, but not clinically significant, non-linearity was detected in approximately 40% of both monoclonal and polyclonal samples, with both reagent providers and with both κ and λ assays.
Results of dilution experiments. Results from two patients with clinically significant non-linearity are shown: N Latex FLC κ final concentration 114 mg/L and Freelite™ κ final concentration 1360 mg/L. A representative sample of the dilution experiments are presented to demonstrate the observed degrees of non-linearity detected. Squares (open and filled) indicate N Latex FLC κ and Freelite™ κ and circles (open and filled) indicate N Latex FLC λ and Freelite™ λ. (a) Results standardized relative to the mean FLC concentration obtained from at least five dilutions. The clinically acceptable limits are indicated by the grey lines. (b) The FLC concentration in the dilute sample plotted relative to the sample dilution. (c) The calculated concentration of FLC in the reaction vessel plotted relative to the total dilution factor for the sample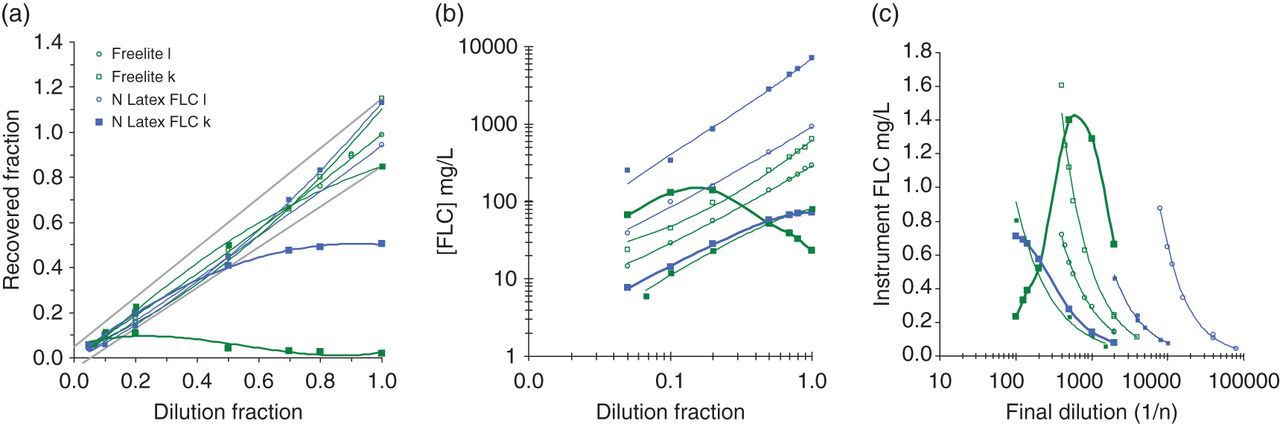
The results of the between-lot variation experiment on the N Latex FLC κ and λ assays are summarized in Figure 6. The κ assay demonstrated negligible bias (95% confidence interval [CI]) of −1.7% (−4.4% to 1.0%), while the variance between reagent lots was estimated at 7.5%. The λ assay demonstrated significant bias (95% CI) of −5.4% (−9.0% to −1.9%) which remained significant after exclusion of one extreme value. The variance between reagent lots for the λ assay was 10% and decreased marginally to 8.3% after exclusion of the one extreme value.
Difference plots of patient results obtained with two lots of N Latex FLC reagent. (a) κ FLC demonstrated negligible bias (95% CI) of −1.7% (−4.4% to 1.0%). The variance predicted from precision is indicated by the shaded area. The variance attributable to a change in reagent lot was estimated at 7.5%. n = 83. (b) λ FLC demonstrated significant bias (95% CI) of −5.4% (−9.0% to −1.9%) which remained significant at −3.7% (−6.9% to −0.5%) after exclusion of one extreme value. The variance predicted from precision is indicated by the shaded area. The variance attributable to a change in reagent lot was estimated at 10% and 8.3% after exclusion of one extreme value. n = 83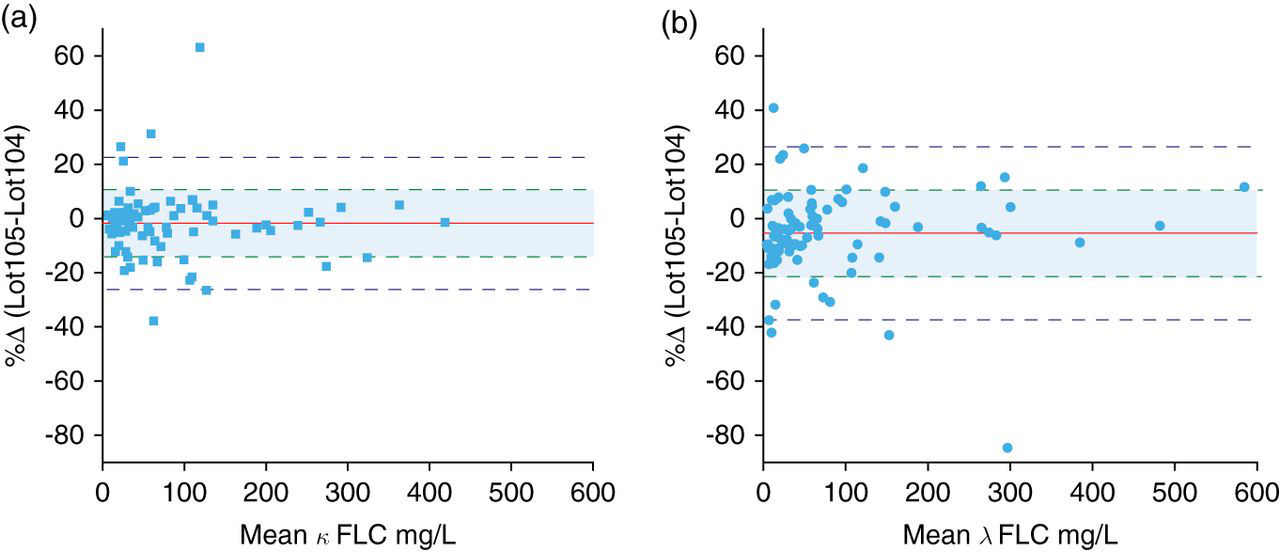
Discussion
The challenges of FLC testing such as non-linearity, antigen excess, between-lot variation and precision are well described. The large dynamic range, limited analytical range of assays that necessitates frequent dilutions, almost infinite molecular variability of the measurand and the monoclonal nature of the disease, as well as the lack of suitable reference material, makes for a particularly challenging assay design.
The proportional positive bias of the N Latex FLC κ and λ assays with slopes of approximately 1.35 suggested adjustment of the upper reference limits to 29 and 37 mg/L in order to achieve equivalence with the Freelite™ assays. A formal reference range study is planned to confirm or refute this observation. The higher values on the N Latex FLC method probably reflected differences in calibration due to a lack of suitable reference material. The large variances between the N Latex FLC and Freelite™ assays preclude interchange of results, even if adjustments for slopes and offsets are made. Longitudinal follow-up of patients should, thus, ideally be performed with the same assay. The good agreement in the binary classification of patient results with the κ and λ assays and the κ/λ ratios, even without adjusting reference intervals, suggested that the assays will perform similarly in the detection of monoclonality.
The N Latex FLC demonstrated good precision across the measuring range and was less prone to antigen excess, particularly with monoclonal κ samples. In comparison, our results show that the Freelite™ assay has poor precision at the lower end of the claimed measuring range, with a CV >20% below approximately 9 mg/L with an initial 1:100 dilution. This has implications for calculation of the κ/λ ratio, with less variation likely at low concentrations of uninvolved FLC. The Freelite™ assay demonstrated clinically important antigen excess with the κ assay in six patients (five with IgA myeloma) in the method comparison section of the study as well as in one case with the linearity protocol. These samples had final κ FLC concentrations 5- to 250-fold higher than the initial result. It should be noted that although the N Latex FLC κ results did not demonstrate gross antigen excess, further dilutions resulted in approximately a two-fold increase in some of these samples (Table 1).
Our results demonstrated that statistically significant non-linearity occurred in approximately half of the monoclonal and polyclonal samples with both κ and λ on the Freelite™ and N Latex FLC assays (data not shown). Our definition of what constitutes a clinically significant deviation from linearity is subjective and arbitrary and needs to be seen in context. In our opinion, the two results identified with clinically significant non-linearity may potentially have impacted on clinical care unless further dilutions were performed. These results may either have been interpreted as showing no monoclonal component or as showing a significant change from a previous measurement.
It is noteworthy that the non-linear sample on the N Latex FLC κ assay demonstrated non-linearity with a previous formulation of the Freelite™ κ assay. 3 The reason for the non-linearity on the N Latex FLC κ assay was not apparent, but antigen excess was unlikely as the final concentration did not appear sufficiently elevated to saturate the available antibody binding sites. Five of the six discrepant samples in Figure 2 originated from patients with IgAκ myeloma and we speculate that polymerization or complex formation between intact IgA and κ FLC that blocks the Freelite™ reaction may partly explain this observation. The data suggested that non-linearity of FLC assays was a property of the individual samples and not a method-specific phenomenon.
The four samples that demonstrated marked discrepancies between the Freelite™ λ and the N Latex FLC λ assay (Figure 3 and samples 7–10 in Table 1) did not show clear evidence of antigen excess or non-linearity as the levels did not increase further with additional dilutions. Although they were known to have monoclonal λ lymphoproliferative disease with an expected elevation of λ FLC, they did not have monoclonal λ bands in serum consistent with the Freelite™ λ levels of approximately 500–1000 mg/L. An overestimation of serum FLC with the Freelite™ compared with serum protein electrophoresis has been documented previously. 6,7 Prospective clinical data are required in this small subgroup of patients to determine which assay correlates best with the clinical findings.
The incorporation of monoclonal antibodies in the N Latex FLC κ and λ assays has the theoretical advantage of reduced variation between reagent lots. We investigated two reagent lots for bias and variance and observed significant bias for the N Latex FLC λ assay while the variances between lots with patient samples were 7.5% and 10%, respectively, for the N Latex FLC κ and λ assays. In view of the reported 20–45% CV between lots of Freelite™ reagent, this aspect of analytical performance needs to be monitored over a more extended period to determine if monoclonal antibodies do indeed increase the stability of FLC assays. 3
In conclusion, we validated the N Latex FLC κ and λ assays against the Freelite,™ and although the results were not directly interchangeable, there was good agreement in the binary classification of samples. The N Latex FLC assay has the advantages of superior precision across the measuring range, and although not immune to non-linearity, it did not exhibit gross antigen excess on the BNII analyser. The N Latex FLC κ and λ assays can be used in clinical practice based on their acceptable analytical performance characteristics.
DECLARATIONS