
Abstract
Background
Vitamin D deficiency appears to be widespread and associated with ethnicity and economic status. Geography is the key to virtually all national statistics. It provides a structure for collecting, processing, storing and aggregating data. Linking geographic data to laboratory data allows analysis of the association of laboratory data with economic indicators.
Methods
The laboratory information system was searched to create a data-set of total 25-OH vitamin D concentrations, which was then linked to economic (Indices of Multiple Deprivation [IMD]) and ethnicity data using postcodes geocoded to Lower Super Output Areas (LSOAs).
Results
A total of 12422 25-OH vitamin D requests were received during the time period searched. A total of 12167 of these had associated postcodes that would allow georeferencing to LSOAs. The median total 25-OH vitamin D was 24.5 nmol/L (5.3-99.0; 2.5-97.5th percentile). Statistically significant (Spearman rank) correlations were found between median 25-OH vitamin D (nmol/L) and percentage of non-White population and percentage of non-White population and IMD. No statistically significant correlation between median 25-OH vitamin D concentration and IMD was found; however, a statistically significant correlation between percentage of population classified as severely deficient and IMD was found.
Conclusions
In summary, vitamin D deficiency is widespread and is related to ethnicity; it does not appear to be related to economic status except in cases of severe vitamin D deficiency.
Introduction
The environment in which people live can potentially have a profound effect on their health.1–3 One possible contributory factor to this variability is economic status. 4 Data on people's environment are widely available from sources such as the census, 5 Office for National Statistics 6 and other data sources. 7 The challenge is the linking of this data to laboratory data to produce data-sets for analysis and study.
Geography is the key to virtually all national statistics as it provides a structure for collecting, processing and aggregating the data. A geographic reference is a piece of data that allows information to be linked to a specific geographical location. Referencing opens up greater opportunity for exploiting statistical data and allows data visualization. 8
Referencing can be achieved in a number of ways, the most common of which are postcode referencing and area referencing.
Area referencing
An area reference code is a code that identifies an observation with a defined geographical area.
8
Super Output Areas (SOAs) are a geography for the collection and publication of small area statistics. The SOA layers form a hierarchy based on aggregations of Output Areas (OAs). They are better for statistical comparison as they are of much more consistent size and each layer has a specified minimum population to avoid the risk of data disclosure. SOAs are not subjected to frequent boundary change and therefore allow statistical comparison over time. In addition, they build on the existing availability of data for OAs. Currently there are:
175,434 OAs in England and Wales (165,665 in England; 9769 in Wales); 34,378 Lower Layer SOAs (32,482 in England; 1896 in Wales); 7193 Middle Layer SOAs (6780 in England; 413 in Wales).
SOAs are intended as a purely statistical geography. They are based on the boundaries of the postcode-based OA geography from which they are constructed. OAs are based on postcodes as at Census Day (29 April 2001), and are constrained by the 2003 statistical ward and parish boundaries. 9
Postcodes
The postcode is a widely used and understood georeference and has a number of advantages because of this. It is freely available and is a critical part of any patient record. There are a number of disadvantages to postcodes in that postcodes were designed to allow the efficient delivery of mail, a postcode can straddle two or more other geographies and can change or be removed. In addition, their use could have potential privacy implications as they are related to individual or groups of houses and locations.
Indices of Multiple Deprivation
Since the 1970s, local measures of deprivation in England have been calculated and can have effects on health out-comes. 4 Deprivation covers a broad range of issues and refers to unmet needs caused by a lack of resources of all kinds, not just financial. The English Indices of Deprivation attempt to measure a broader concept of multiple deprivation.7,10 The model of multiple deprivation which underpins the Indices of Deprivation 2010 is based on the idea of distinct domains of deprivation which can be recognized and measured separately. These include Income Deprivation, Employment Deprivation, Health Deprivation and Disability, Education Skills and Training Deprivation, Barriers to Housing and Services, Living Environment Deprivation and Crime. The overall Index of Multiple Deprivation (IMD) is conceptualized as a weighted area level aggregation of these specific dimensions of deprivation. The Indices of Deprivation can be used for identifying areas with high levels of deprivation or areas with specific issues, such as health, that may not be considered deprived on the overall index. The indices are the current standard measure to allow comparison of areas across the country and are widely used by the UK Government as criteria for the allocation of resources to regeneration programmes and neighbourhood renewal initiatives.
Vitamin D deficiency
Vitamin D deficiency appears to be widespread and associated with ethnicity 11 and economic status. 12 In addition, a number of studies have looked at dietary intakes of other nutrients and found differences related to socioeconomic status.13–15 The aim of this study was to investigate the relationship of 25-OH vitamin D concentration to IMD. In addition, a methodology for the linking of various freely available geographic data-sets with laboratory data was developed.
Materials
Software used
QGIS (Quantum GIS Development Team [2011]. Quantum GIS Geographic Information System. Open Source Geospatial Foundation Project. http://qgis.osgeo.org);
Postgresql (http://www.postgresql.org/) 16 database;
Postgis (http://postgis.refractions.net/) 17 database extensions;
MySQL (www.mysql.com) database. 9
Data sources
Population data were obtained from the Office for National Statistics, 2001 Census: Standard Area Statistics (England and Wales) [computer file]. ESRC/ JISC Census Programme, Census Dissemination Unit, Mimas (University of Manchester); 5
The NHS postcode lookup table; 18
Indices of Multiple Deprivation 2010. 7
Methods
A search was conducted of the laboratory information system (LIMS) at Birmingham Heartlands Hospital for total 25-OH vitamin D results from the period of November 2011–March 2012. This period was chosen to minimize the effect of seasonal variation of results. Total 25-OH vitamin D concentrations were determined using an in-house liquid chromatographytandem mass spectrometry (LC/MS/MS) methodology that quantifies 25-OH vitamin D2 and 25-OH vitamin D3. The search parameters from this query also included the patients or general practitioner practice postcode. These data are provided by linking to the patient record via a patient administration link or booked in at the time of request in the LIMS.
Where multiple vitamin D requests were received, the average vitamin D concentration was calculated for the patient.
Each vitamin D result with a postcode was linked to the Lower Super Output Area (LSOA) using a structured query language (SQL) query in MySQL using the NHS postcode lookup table. An example of this type of query is below:
SELECT
tvitdn_gh_plus_heft_tvitdn_results_postcodes_ only.Result, tvitdn_gh_plus_heft_tvitdn_results_postcodes_ only.Req_Postcode, nhs_postcode_lookup.UnitPostCodeVar, nhs_postcode_lookup.LSOA
FROM
geocoding.tvitdn_gh_plus_heft_tvitdn_results_postco des_only tvitdn_gh_plus_heft_tvitdn_results_post codes_only, geocoding.nhs_postcode_lookup nhs_postcode_lookup
WHERE
tvitdn_gh_plus_heft_tvitdn_results_postcodes_ only.Req_Postcode = nhs_postcode_ lookup.UnitPostCodeVar
Where geocoding.tvitdn_gh_plus_heft_tvitdn_results_ postcodes_only is the table containing the vitamin D results from telepath and geocoding.nhs_postcode_lookup is the NHS postcode lookup table.
The ONS shape files were imported into a MySQL database using MySQL spatial extensions. The Esri (http://www.esri.com/) Shapefile (shapefile) is a popular geospatial vector data format for geographic information systems software. It is developed and regulated by Esri as an open specification for data interoperability.
The geography data and laboratory data were then linked using LSOA code. Median, 2.5 and 97.5th percentiles and interquartile range were calculated for each LSOA. Further data analysis was performed by linking data-sets on the basis of the LSOA code and if the number of 25-OH vitamin D results in the LSOA was >50.
The IMD scores were overlaid using the same methodology.
The ethnicity of each LSOA was determined using data from the 2001 Census and the percentage of non-White population was calculated using the ethnicity classifications in the census data.
Results
A total of 12422 total 25-OH vitamin D requests were received during the time period searched. Of these, 12167 had associated postcodes that would allow georeferencing to LSOAs. The median total 25-OH vitamin D was 24.5 nmol/L (5.3–99.0; 2.5–97.5th percentile). In the population where postcodes (n = 255, 1.7% of study population) were not available, the median total 25-OH vitamin D was 21.5 nmol/L (4.4–101.9; 2.5–97.5th percentile). A statistically significant difference (independent samples median test, P = 0.02) was found between the median total 25-OH vitamin D concentrations in the group of patients with postcodes and the group of patients without postcodes; however, due to the small numbers of records in this group, it was assumed that the results would not be biased by this finding.
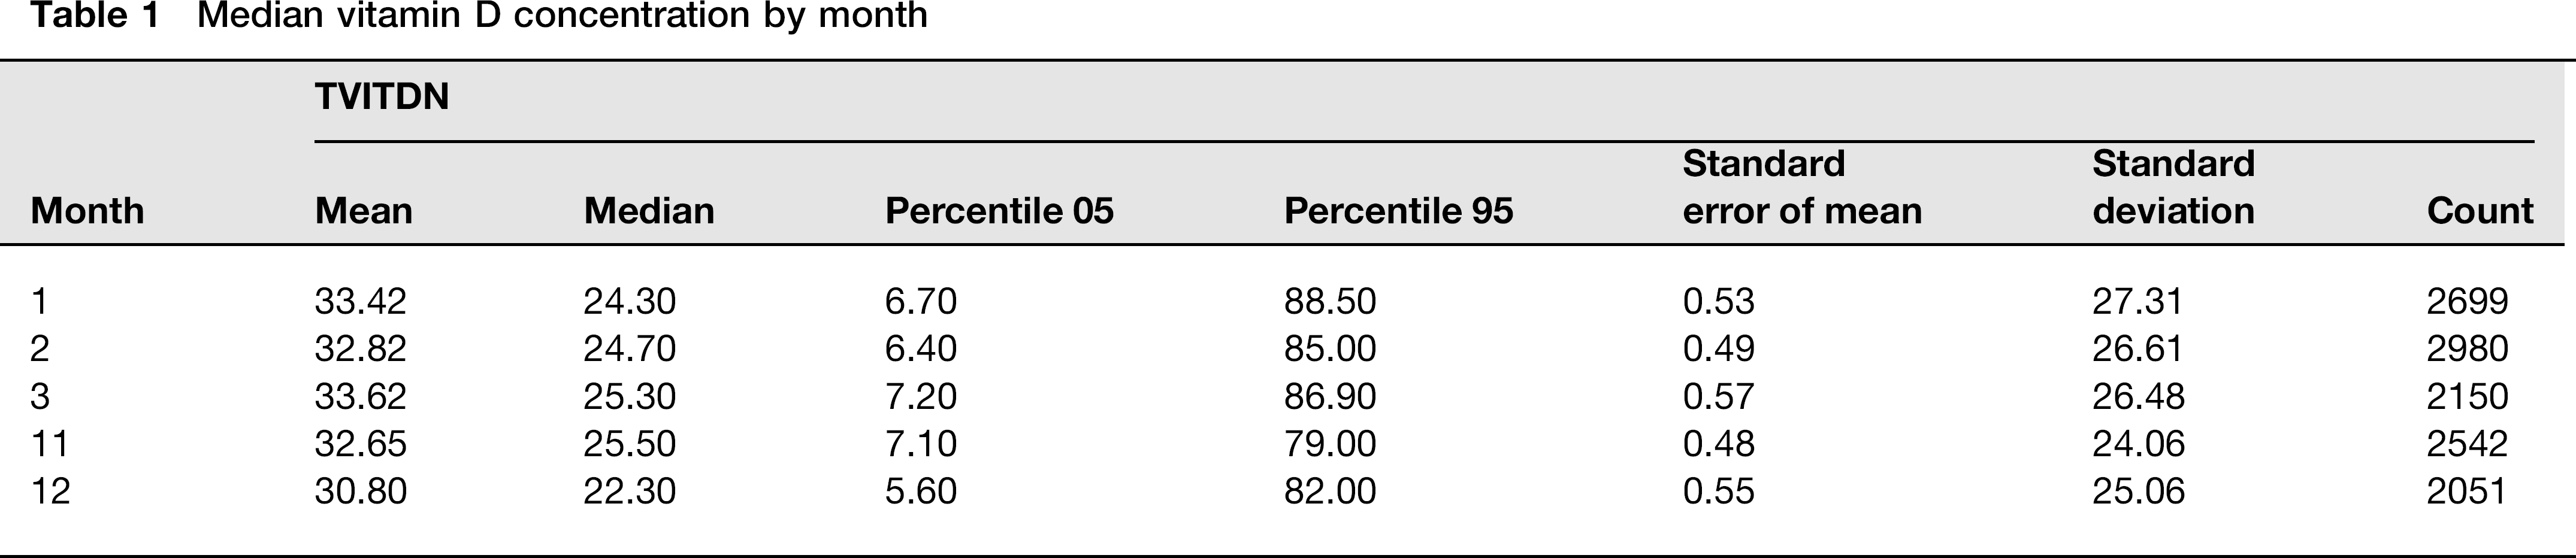
Previous audit data from this laboratory have shown that the seasonal variation of total 25-OH vitamin D in our population is minimal. 19 This is particularly apparent for non-Whites. The median 25-OH vitamin D concentrations over the months studied is illustrated in Table 1. Only December had a statistically significant change in median 25-OH vitamin D concentration when compared with other months.
Median vitamin D concentration by month
The numbers of patients with repeat tests was 0.6% of the study population. Previous audit data from this laboratory have shown that the incidence of repeat testing is of the order of 15% in a year. In 50% of patients who have had repeat testing, there is no change in total 25-OH vitamin D concentrations, possibly indicating that supplementation therapy has not commenced. In the remainder of repeat testing patients, the response can be variable with some patients’ total 25-OH vitamin D concentrations decreasing. It is assumed that this group of patients will have minimal effect on the overall analysis.
Patients with a 25-OH vitamin D2 concentration >10 nmol/L were assumed to be taking supplements and were excluded from the analysis.
When LSOA data were further filtered to include only LSOAs that had >50 total 25-OH vitamin D results, the median total 25-OH vitamin D concentration for all LSOAs was 24.5 nmol/L (5.4–99.26; 2.5–97.5th percentile). The median total 25-OH vitamin D for each LSOA is plotted on the map illustrated in Figure 1. LSOAs clustered in central Birmingham had the lowest median total 25-OH vitamin D concentrations while LSOAs clustered around Solihull had the highest median total 25-OH vitamin D concentrations.
Median total 25-OH vitamin D concentration (nmol/L) in Lower Super Output Areas (LSOAs)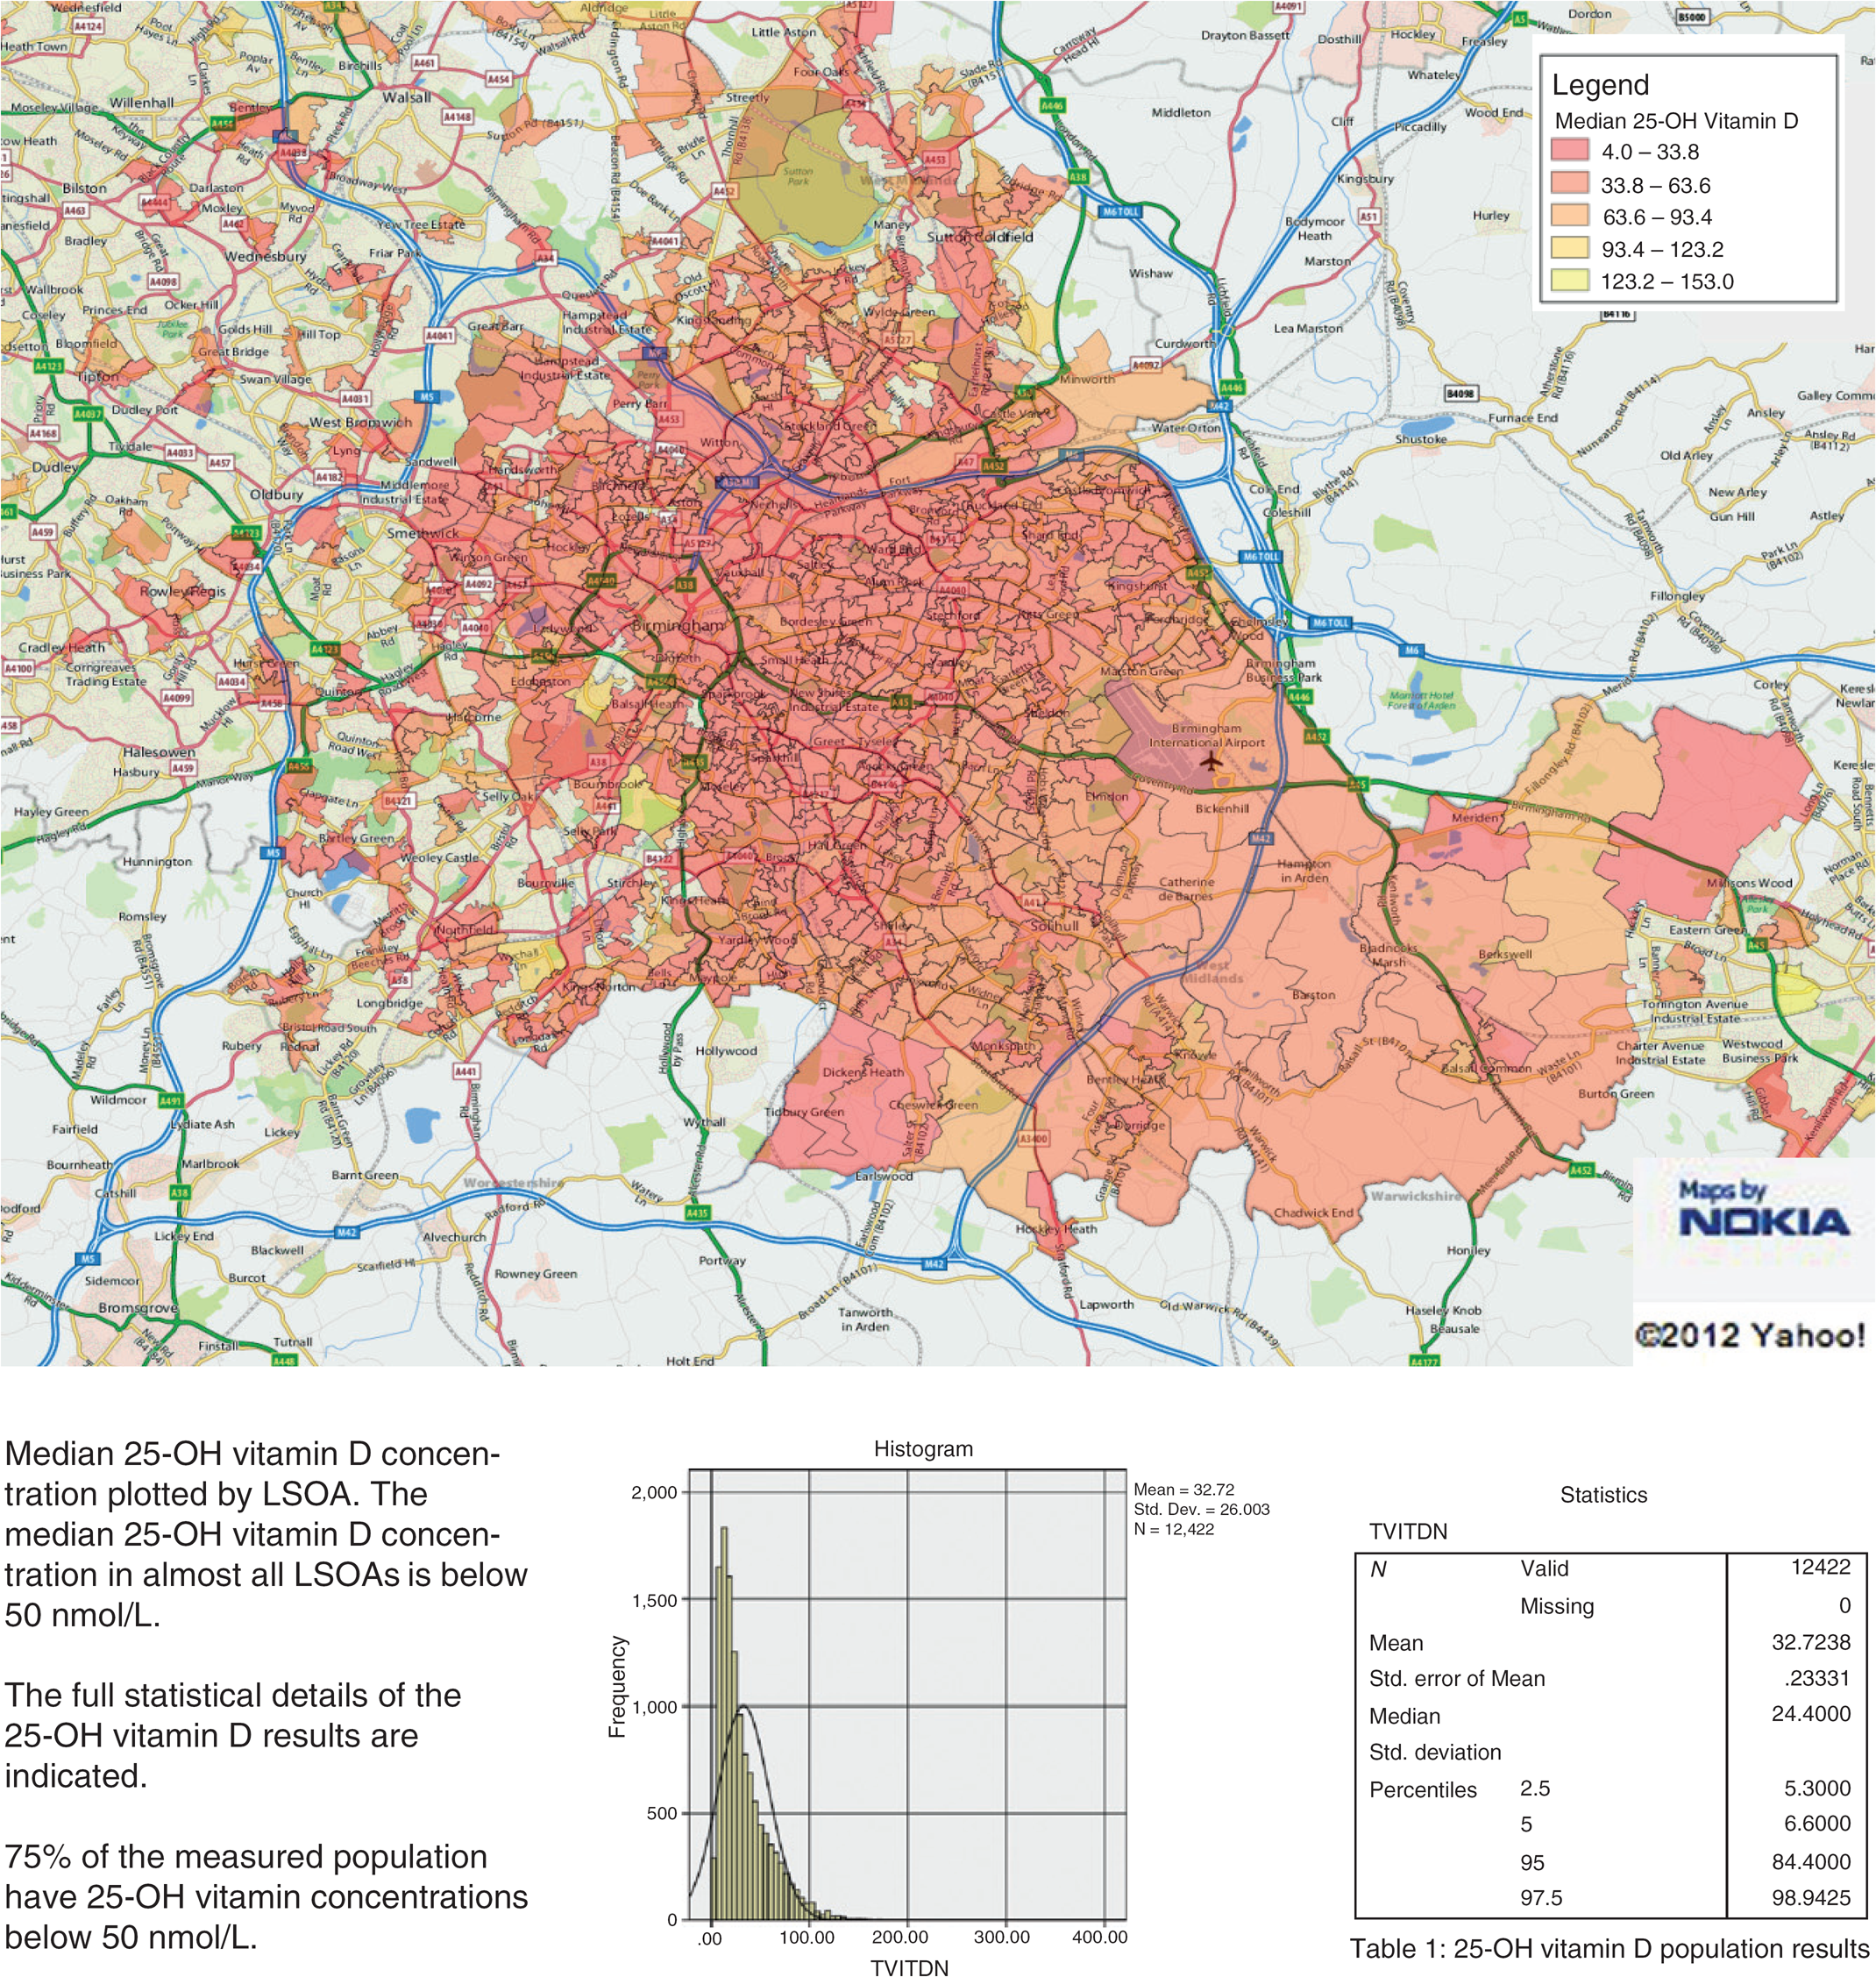
Supplementary Figure 1 (for all Supplementary Figures, please see http://acb.rsmjournals.com/lookup/suppl/ doi:10.1258/acb.2012.011249/-/DC1) indicates the IMD score in each of the LSOAs. The areas around central Birmingham had the highest IMD scores (and thus the most deprivation) while the areas around Solihull had the lowest IMD scores (and thus the least deprivation).
Supplementary Figure 2 illustrates the ethnic distribution in the areas studied as expressed as percentage of the non-White population. The areas around central Birmingham had the highest percenatge of non-White population. The areas around Solihull had the lowest percentage of non-White population.
Correlation of total 25-OH vitamin D concentration with percentage of non-White and Index of Multiple Deprivation (IMD)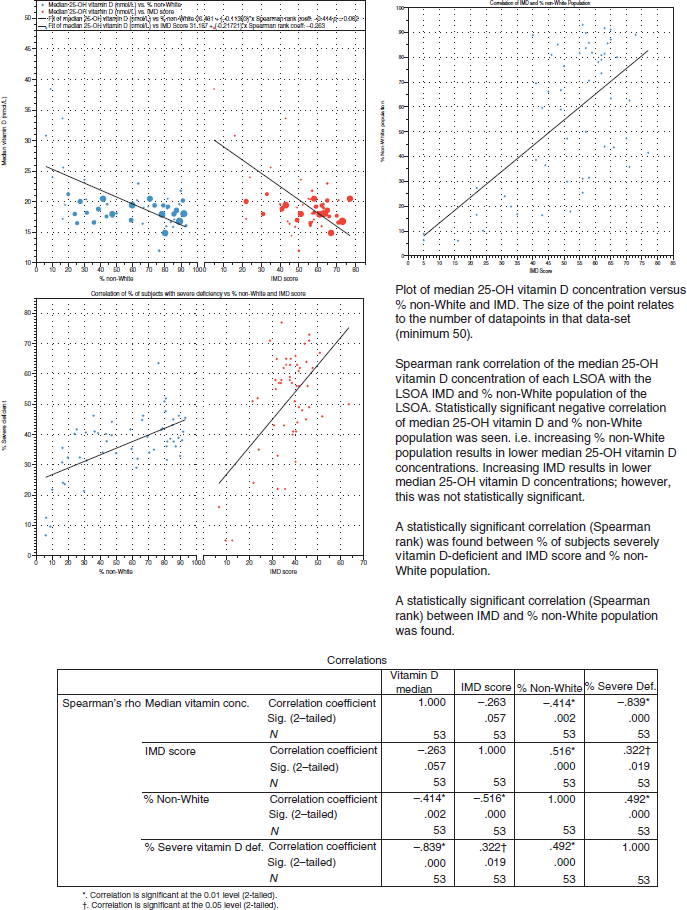
Figure 2 illustrates the correlation of median 25-OH vitamin D concentration versus percentage of non-White population and IMD score for each LSOA. Statistically significant (Spearman rank) correlations were found between median 25-OH vitamin D (nmol/L) and percentage of non-White population and percentage of non-White population and IMD. No statistically significant correlation between median 25-OH vitamin D concentration and IMD was found.
In contrast, a statistically significant correlation between IMD score and percentage of severe vitamin D deficiency was found. The percentage of severe vitamin D concentration also correlated with percentage of non-White population in the LSOA.
Figure 3 illustrates the size of the populations in each LSOA. The median number of people in each LSOA is 1564.
Difference between median total 25-OH vitamin D nmol/L in top 10 (more deprived) and bottom 10 (least deprived). No statistically significant difference between the median 25-OH vitamin D concentrations in the top 10 (more economically deprived and bottom 10 (least economically deprived) groups. Percentage of White population is indicated next to each point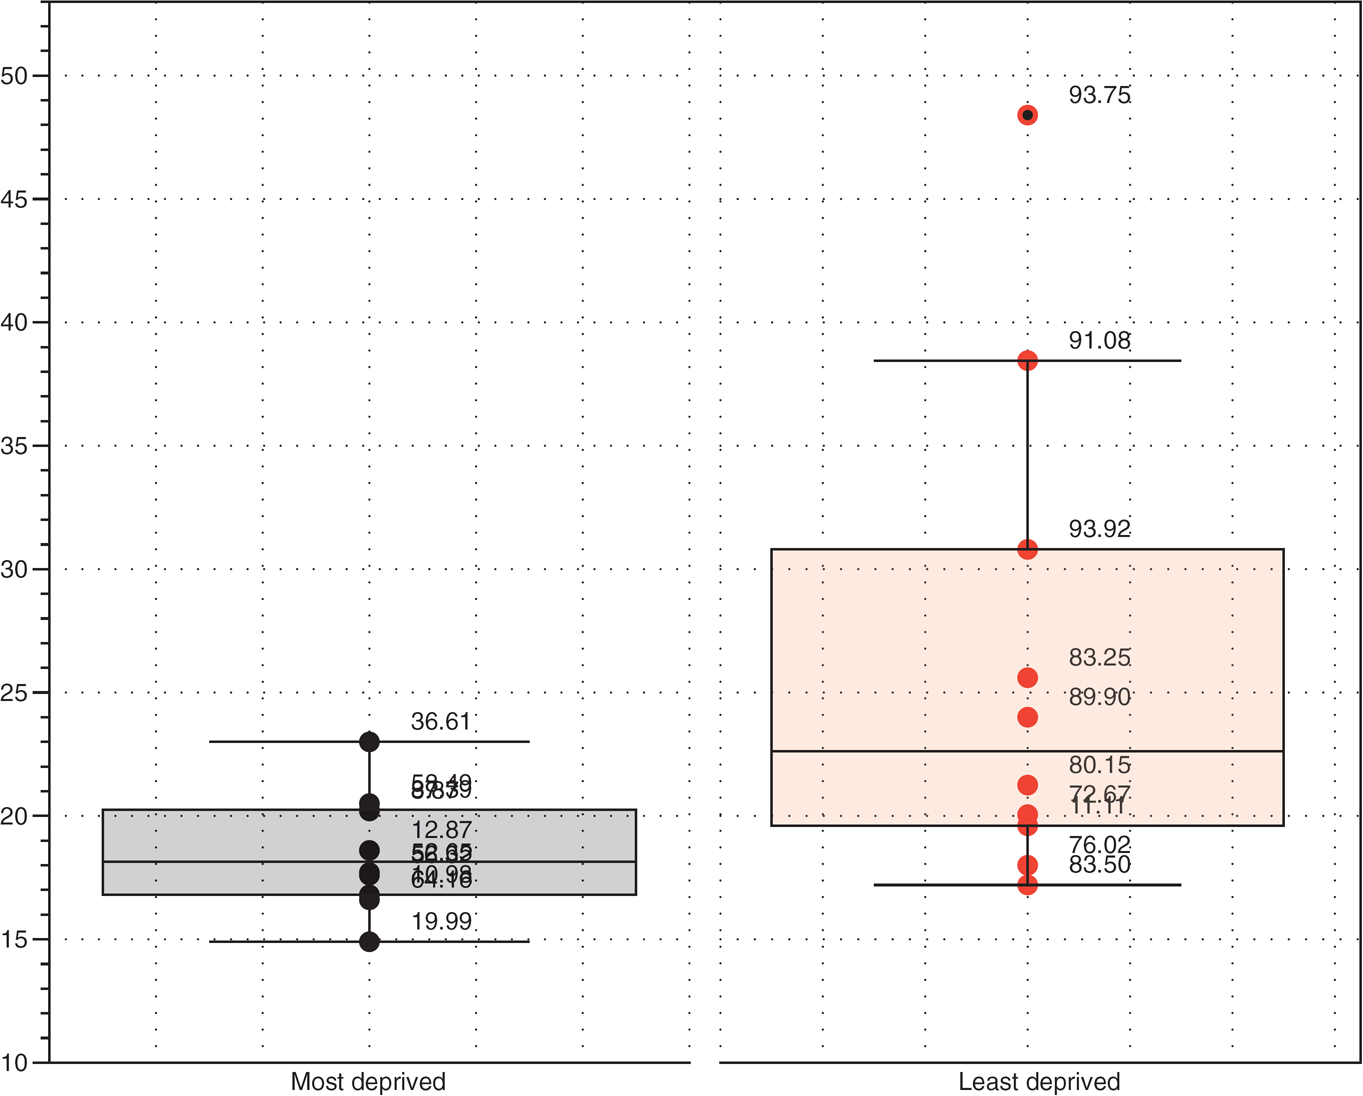
The difference between median 25-OH vitamin D nmol/L in the top 10 highest IMD scores (more deprived) and the 10 lowest IMD scores (least deprived) was determined (Supplementary Figure 3). No statistically significant difference in median 25-OH vitamin (nmol/L) was observed (Mann-Whitney U test).
Conclusions
Birmingham Heartlands Hospital uses the following criteria when interpreting vitamin D results. These criteria were validated on the LC/MS/MS method used and are on the basis of significant changes in parathyroid hormone, calcium and phosphate concentrations.
19
<15 nmol/L – severe vitamin D deficiency; 15–30 nmol/L – vitamin D deficiency; 30–50 nmol/L – vitamin D insufficiency; >50 nmol/L – adequate vitamin D status.
The 75th percentile of the population tested was 47 nmol/L, which indicates 75% of the population who had measured total 25-OH vitamin D, would be classified as insufficient or deficient. On visual inspection of the maps in Figure 1, Supplementary Figures 1 and 2, the lowest median total 25-OH vitamin D concentrations appear to be associated with the most deprived areas of Birmingham (as measured by IMD). However, the lowest median total 25-OH vitamin D concentrations were also associated with the areas with the highest percentage of non-White population. This is to be expected as the association of low total 25-OH vitamin D concentrations with ethnicity has been reported elsewhere.11,19,20
There is a statistically significant negative correlation between percentage of non-White population of an LSOA and median total 25-OH vitamin D. There is no statistically significant correlation between IMD and total 25-OH vitamin D, suggesting that the most important variable in determining total 25-OH vitamin D status is ethnicity and not economic status. This conclusion is further strengthened by the data presented in Supplementary Figure 3. There is no statistically significant difference between the highest 10 IMD median total 25-OH vitamin D concentrations and lowest 10 IMD total 25-OH vitamin D concentrations despite the statistically significant negative correlation seen for percentage of non-White population. Previous studies have also reported that there is no association between 25-OH vitamin D concentrations.21,22 This is in contrast to the findings that gender, lifestyle factors and socioeconomic status are predictors of calcium and vitamin D intake. 23
However, a significant association of IMD with severe vitamin D deficiency was found, potentially indicating that economic deprivation may have an association with the development of severe vitamin D deficiency. This has been reported elsewhere, whereby the percentage of unemployed subjects with 25-OH vitamin D concentrations <25 nmol/L was 26.6 nmol/L compared with on average 16 nmol/L for other socioeconomic groups. 2
The percentage of non-White population in an LSOA is correlated to IMD, with the most deprived areas having the larger percentage of non-White population.
The data used for population characterization were the 2001 Census data. This is the latest full data-set currently available. It is the most comprehensive data-set regarding ethnic grouping. The results from the 2011 Census are due to be published in 2012. Since 2001, there have been some changes in the population in Birmingham, in that the overall estimated population of Birmingham has increased from a low of approximately 985,000 to 1,040,000 (approximately 5%).
24
This has been largely due to an increased birth rate and increased international migration. In 2011, the National Statistics Office released 2008 and 2009 mid-year population estimates byethnic group for local authorities.
24
These estimates are still classified as experimental statistics, are therefore subject to review, and have yet to meet the quality standards for national statistics but can be used as a guide to estimate potential changes in population. These estimates have been used to update the 2009 population and ethnicity projections reported in reference.
25
The changes noted in this reported indicated that:
The numbers of Pakistani, White Irish and Black Caribbean residents decreased between 2001 and 2009; The Black African group increased by 14.3 thousand, making it the most rapidly growing ethnic group in Birmingham; The White ethnic group declined during this period.
Overall, the city average non-White population was 32% compared with 29.6% in the 2001 Census data used. It is therefore unlikely that these population changes will have a significant effect on the data presented in this paper, which utilized the validated 2001 Census data.
The method presented for analysis of data is relatively easy to perform once geocoding has been done. It is made easier by the use of standard coding across all data-sets used (LSOA). There are a number of other potential uses for this type of data analysis, which include analysis of access to health care and prediction of workload and case-mix. For example, despite the large numbers of total 25-OH vitamin D measurement requests, these data would suggest that we still have only measured total 25-OH vitamin D concentrations in a small percentage of the population in our service provision area.
The data here are not epidemiological data and as such, it can suffer from a number of potential biases. This could include overestimating the prevalence of total 25-OH vitamin D deficiency due to the population self-selecting for vitamin D deficiency. There has been no formal advice issued by our laboratory on whom vitamin D testing may be appropriate. Our previous audit data 19 have indicated that vitamin D deficiency is a widespread problem in the population served by the laboratory and that testing is justified in all ethnic and socioeconomic groups. The prevalence of total 25-OH vitamin D concentrations in Birmingham has previously been reported in 2006 and the data presented here are comparable with the previously published data. It appears that the prevalence of total 25-OH vitamin D deficiency has not decreased since 2006 despite a large increase in the number of tests performed.
In summary, vitamin D deficiency is widespread and is related to ethnicity; it does not appear to be related to economic status except in cases of severe vitamin D deficiency.
DECLARATIONS
Footnotes
Acknowledgements:
I would like to thank the Staff of the Department of Biochemistry and Immunology, Birmingham Heartlands Hospital for their dedication in providing 25-OH vitamin D analysis.