The COBAS 6000 system can be completed by a Modular Pre-Analytics (MPA), an integrated laboratory automation system that streamlines preanalysis. For an optimal throughput, the MPA centrifuges blood collection tubes for 5 min at 1885 × g – a centrifugation time that is not in concordance with the World Health Organization guidelines which suggest centrifugation for 10/15 min at 2000–3000 × g.
Methods
In this study, the analytical outcome of 50 serum and 50 plasma samples centrifuged for 5 or 10 min at 1885 × g was investigated. The study included routine chemistry and immunochemistry assays on the COBAS 6000 and the Minicap capillary electrophoresis.
Results
Deming-fit and Bland–Altman plots of the 5-min and 10-min centrifugation steps indicated a significant correlation in serum samples. The lipaemia index in plasma samples centrifuged for 5 min displayed a statistically significant variation when compared with the 10-min centrifugation.
Conclusions
Preanalytical centrifugation can be successfully down-scaled to a duration of 5 min for most routine chemistry and immunochemistry assays in serum and plasma samples. To prevent inaccurate results in plasma samples with an increased lipaemia index from being reported, the laboratory information system was programmed to withhold results above certain lipaemia indices. The presented data support the use of a 5-min centrifugation step to improve turnaround times, thereby meeting one of the desires of the requesting clinicians.
Introduction
The COBAS 6000 system is a random-access analyser that is fully automated for clinical chemistry and immunochemistry assays. The analytical performance of the COBAS 6000 system has been thoroughly evaluated and shown to have excellent precision and results equivalence for most assays.1 The COBAS 6000 system can be completed by a Modular Pre-Analytics (MPA), an integrated laboratory automation system that streamlines the preanalytical phase by automating centrifugation, decapping, online aliquotting, sorting/archiving and sample transportation. The increased use of preanalytical automation, as performed by the MPA, is driven by multiple factors, of which the major ones are the wish to reduce resources (specifically labour), human errors and intralaboratory turnaround time (TAT) on top of achieving standardization.
For the requesting clinician, intralaboratory TAT, as defined by the time of receiving the sample in the laboratory to the time the analysis is complete, should be as short as possible. Therefore, laboratories continuously strive to reduce the TAT while maintaining or improving sample quality. Reduction in the time consumed by centrifugation is one process that contributes to the improvement of the TAT. To this end, the MPA automatically centrifuges blood samples for 5 min at 1885 × g. This is in contradiction to the instructions of use for most brands of blood collection tubes. For instance, Becton, Dickinson and Company (BD), which has a widespread area of distribution, recommends blood collection tubes to be centrifuged for 10 min at 1300–2000 × g for an optimal separation of the plasma or serum.2 In addition, the World Health Organization (WHO) guidelines recommend blood collection tubes to be centrifuged for 10 min between 2000 and 3000 × g for serum and 15 min at 2000–3000 × g for plasma.3
This study evaluated if a reduced centrifugation step as performed by the MPA system produced optimal sample quality. To this end, either a manual centrifugation step in accordance with the instructions of use for the blood collection tubes (10 min at 1885 × g) or an automatic centrifugation step in accordance with the settings of the MPA (5 min at 1885 ×g) was carried out for plasma and serum samples. The analytical outcome of both settings was analysed by measuring a subset of routine chemistry and immunochemistry assays on the COBAS 6000 and the Minicap capillary electrophoresis system.
Methods
Subjects and samples
A single experienced phlebotomist collected the venous blood samples into BD Vacutainer LH 102 I.U. (REF 368886) and BD vacutainer SST advance (REF 367955) blood collection tubes (BD, Plymouth, UK) for routine laboratory analysis. Blood samples were collected with consent from 100 voluntary inpatients during a routine phlebotomy. Two blood collection tubes for serum or plasma were collected and immediately anonymised after phlebotomy. Of the two collected tubes, manual centrifugation was carried out for one tube according to the instructions of BD (10 min at 1885 × g). The other tube was centrifuged by the MPA (5 min at 1885 × g) (Roche Diagnostics, Mannheim, Germany). Centrifugation was performed within one hour after venous blood sampling. The described study did not require the permission of the Medical Ethics Review Board, but was performed according to normative guidelines.4
Methods of analysis
Immediately after centrifugation, both tubes were processed by the MPA including automatic destopping, aliquoting, bar coding, restopping, sorting and sample transfer. The prepared aliquots were directly analysed on a COBAS 6000 system (Roche Diagnostics) for a subset of chemistry and immunochemistry assays (as shown in Table 1) on a c501 and e601 module. Capillary zone electrophoresis (Minicap, Sebia, Norcross, USA) was performed on an additional aliquot in order to analyse the different protein fractions (viz albumin, α1, α2, β and γ fraction). The subset of chemistry and immunochemistry assays was selected based on several aspects, including the concentration in erythrocytes, molecular mass and involvement in haemostasis. All analysis was completed within four hours.
Analytical VC of chemistry and immunochemistry assays according to internal quality measurements
Analyte
Abbreviation
VCa (%)
Alanine aminotransferase
ALAT
3.5
Albumine
ALB
2.5
Aspartate aminotransferase
ASAT
3.5
Bilirubin
BIL
3.5
Calcium
CA
2.0
Chlorine
CL
1.5
Creatine kinase
CK
3.5
D-Dimer*
DD
5.0
Ferritin
FER
5.0
Folic acid
FOL
5.0
Glucose
GLUC
3.0
Haemolysis index
HEM
5.0
Icterus index
ICT
5.0
Lactate dehydrogenase
LDH
3.0
Lipaemia index
LIP
5.0
Magnesium
MG
4.0
Phosphate
PHOS
2.0
Potassium
K
1.5
Protein spectrum
PS
5.0
Sodium
NA
1.5
Total protein
TP
2.0
Thyrotropin
TSH
5.0
VCa, analytical variation as deduced from internal quality control measurements
*According to the instructions for D-Dimer on the COBAS C6000 system, D-Dimer is only measured in plasma
Statistics
Analyte concentrations derived from manually centrifuged samples were compared with their respective concentration in samples automatically centrifuged by plotting the data in an EP Evaluator (Data Innovations, South Burlington, USA). Using a Deming-fit, the slopes, intercepts and correlation coefficients (R) obtained were used to deduce a proportional and constant bias between the two settings (Bland–Altman plot). Allowable error margins set for the regression line were defined by the analytical variation (as depicted in Table 1). The analytical variation coefficient (VC) was deduced from internal quality control measurements. The correlation was approved when a P value >0.05 was obtained using a two sided T-test.
The haemolysis and lipaemia index in serum and the haemolysis index in plasma were excluded from statistical analysis because a significant number of measured values were below the lowest detection limit of the assay (five and ten monoclonal antibodies for haemolysis index and lipaemia index, respectively). The plotted data were unreliable and the correlation could neither be accepted nor rejected. Statistical analysis was performed for the lipaemia index in plasma because all measurements were above the lowest detection limit of ten monoclonal antibodies.
Results
Serum samples
Analyte concentrations measured after a centrifugation step of 5 or 10 min were compared in an EP evaluator with Deming-fit regression analysis to deduce the slope, intercept and correlation coefficient (Table 2). A P value >0.05 was considered as a non-significant difference between the two data sets and, hence, the correlation was approved, otherwise the correlation was rejected.
Method comparison of chemistry and immunochemistry assays in serum after an automatic centrifugation step of 5 min or a manual centrifugation step of 10 min
Analyte
Slope (95% CI)
Intercept (95% CI)
Correlation coefficient (AL)
Correlation
ALAT
0.989 (0.983 to 0.994)
0.40 (0.0 to 0.8)
0.998 (>0.9)
Acceptable
ALB
0.994 (0.938 to 1.049)
0.27 (−1.7 to 2.2)
0.981 (>0.9)
Acceptable
ASAT
1.017 (1.008 to 1.027)
−0.70 (−1.3 to −0.1)
0.999 (>0.9)
Acceptable
BIL
1.013 (1.005 to 1.021)
−0.06 (−0.2 to 0.1)
0.999 (>0.9)
Acceptable
CA
0.981 (0.906 to 1.056)
0.05 (−0.1 to 0.2)
0.965 (>0.9)
Acceptable
CL
1.014 (0.951 to 1.077)
−1.21 (−7.7 to 5.3)
0.977 (>0.9)
Acceptable
CK
1.030 (1.018 to 1.042)
−1.00 (−1.8 to −0.2)
0.999 (>0.9)
Acceptable
FER
1.006 (0.979 to 1.032)
−3.50 (−19.1 to 12.1)
0.996 (>0.9)
Acceptable
FOL
0.985 (0.956 to 1.014)
0.18 (−0.1 to 0.8)
0.995 (>0.9)
Acceptable
GLUC
0.986 (0.964 to 1.008)
0.18 (0.1 to 0.3)
0.997 (>0.9)
Acceptable
HEM
1.113 (0.844 to 1.421)
−0.30 (−1.3 to 0.8)
0.597 (>0.9)
NI*
ICT
1.015 (1.011 to 1.018)
−0.10 (−0.3 to 0.2)
0.999 (>0.9)
Acceptable
LDH
1.018 (0.982 to 1.054)
−2.00 (−9.9 to 5.9)
0.993 (>0.9)
Acceptable
LIP
0.899 (0.800 to 0.998)
0.10 (−0.8 to 1.0)
0.929 (>0.9)
NI*
MG
0.957 (0.865 to 1.050)
0.03 (0.0 to 0.1)
0.942 (>0.9)
Acceptable
PHOS
1.031 (0.993 to 1.069)
−0.03 (−0.1 to 0.0)
0.991 (>0.9)
Acceptable
K
1.071 (0.962 to 1.178)
−0.29 (−0.7 to 0.2)
0.936 (>0.9)
Acceptable
PS
1.005 (1.002 to 1.008)
−0.09 (−0.2 to 0)
0.999 (>0.9)
Acceptable
NA
1.127 (1.015 to 1.238)
−16.9 (−32.4 to −1.5)
0.938 (>0.9)
Acceptable
TP
0.976 (0.90 to 1.042)
2.01 (−2.0 to 6.0)
0.971 (>0.9)
Acceptable
TSH
1.106 (1.006 to 1.026)
−0.02 (−0.1 to 0.1)
0.999 (>0.9)
Acceptable
NI, not interpretable; ALAT, alanine aminotransferase; ALB, albumine; ASAT, aspartate aminotransferase; BIL, bilirubin; CA, calcium; CL, chlorine; CK, creatine kinase; FER, ferritin; FOL, folic acid; GLUC, glucose; HEM, haemolysis index; ICT, icterus index; TSH, thyrotropin; TP, total protein; NA, sodium; PS, protein spectrum; LIP, lipaemia index; LDH, lactate dehydrogenase
For the slope and intercept, the 95% confidence interval (95% CI) is depicted within parentheses. For the correlation coefficient, the acceptable limit (AL) is depicted within parentheses
*Results cannot be interpreted because most measured values are below the lowest detection limit of the assay
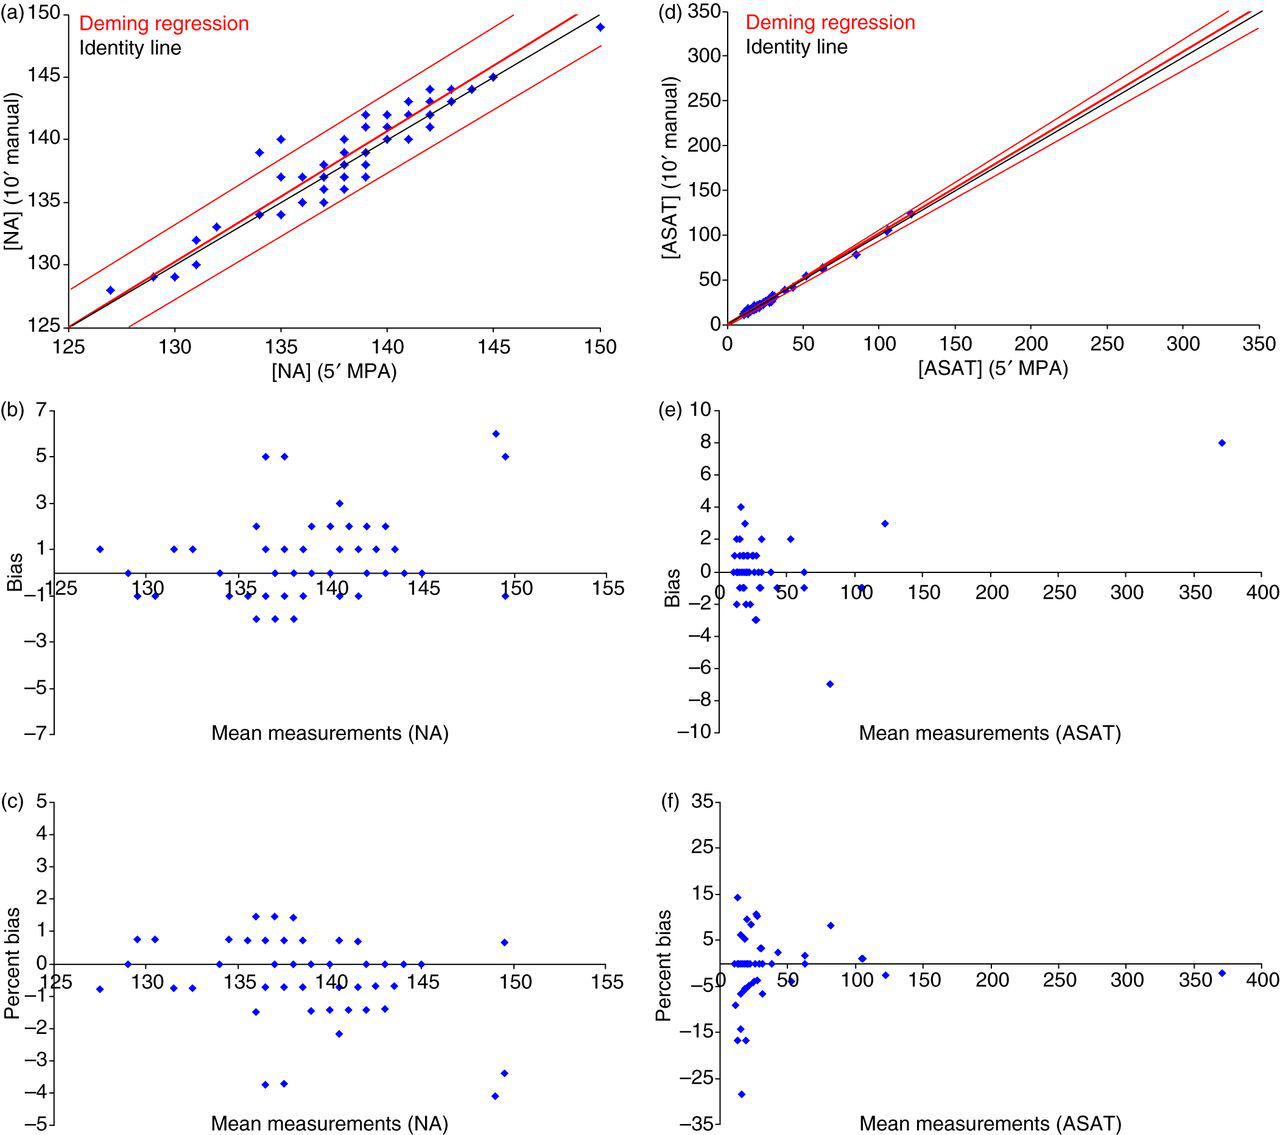
Ideally, the slope should randomly vary around 1.00 and the intercept around 0.00. As can be seen in Table 2, most analytes displayed slopes and intercepts around these ideal targets of 1.00 and 0.00, respectively. Aberrations from these ideal targets were due to relatively large variations at low to low normal values (Figures 1a and d). The Bland–Altman plot indicated that the data points were, with a considerable variation, centred around the zero line, indicating no constant or proportional bias that was caused by the preanalytical variation in centrifugation time (Figures 1b,c and e,f). This conclusion was endorsed by the fact that the P value was >0.05, meaning that a centrifugation step of 5 or 10 min did not lead to a significantly different analytical outcome.
Deming-fit alanine aminotransferase (ALAT) and sodium (NA) (serum). In the scatter plot for NA (a) and aspartate aminotransferase (ASAT) (d), the regression line with the allowable error margins is depicted in red, data points in blue and the identity line in black. As can be seen from the bias plot, the regression line is slightly divergent from the identity line, although the discrepancy is well within the allowable error margins set by the analytical variation coefficient. The bias (b and e for NA and ASAT, respectively) and percent bias plot (c and f for NA and ASAT, respectively) shows that the data points are centered around the zero line, indicating no constant or proportional bias. (A colour version of this figure is available in the online journal)
Plasma samples
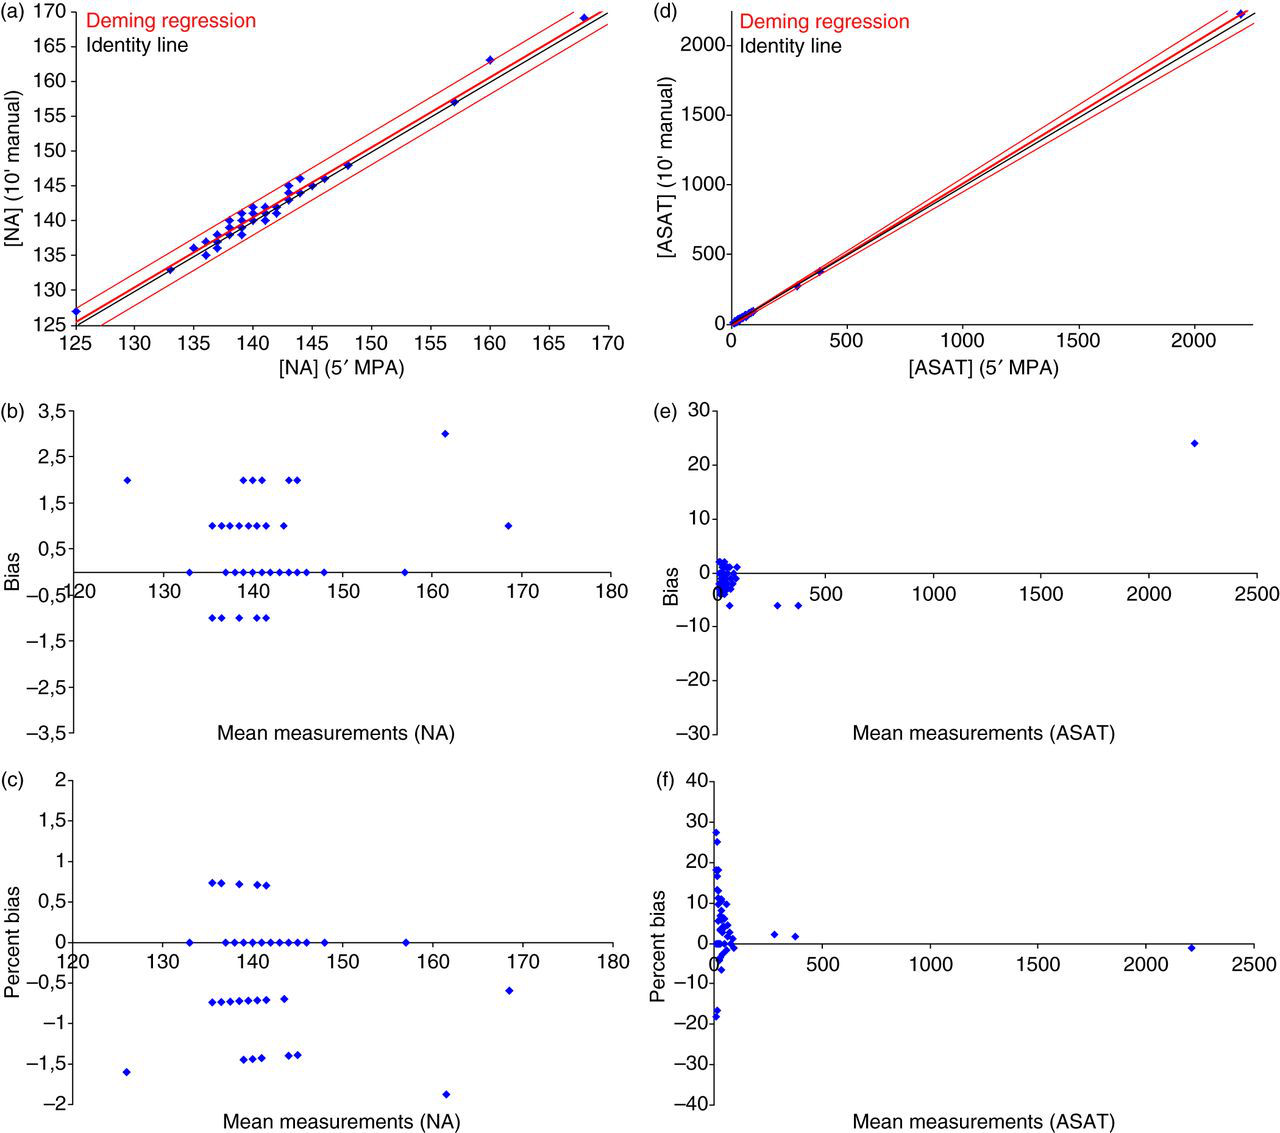
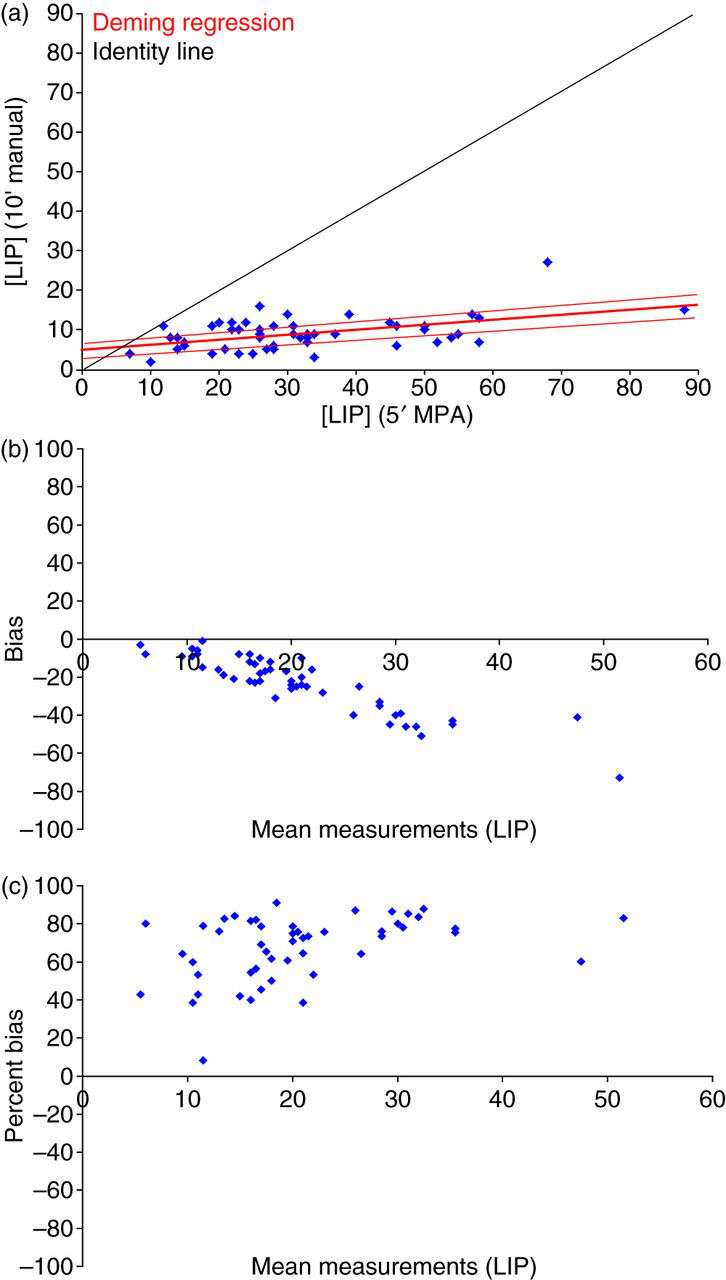
As can be seen from Table 3, the slope and intercept for most measured analytes varies around 1.00 and 0.00, respectively. As described above, aberrations from this ideal value were caused by assay variation and not by the preanalytical variation in centrifugation time (P > 0.05) (Figure 2). The lipaemia index was an exception to this, and the slope and intercept were aberrant from the ideal value due to a proportional bias of 50–100% (Bland–Altman plot depicted in Figure 3). This meant that the lipaemia index, after a 10-min centrifugation step, was 50–100% lower compared with a centrifugation step of 5 min. Statistics indicated that the correlation between a 5- or 10-min centrifugation step was significantly different for the lipaemia index (P = 1.10E-16). The higher lipaemia index after a 5-min centrifugation step is due to turbidity of the plasma by incomplete removal of circulating chylomicrons.
Method comparison of chemistry and immunochemistry assays in plasma after an automatic centrifugation step of 5 min or a manual centrifugation step of 10 min
Analyte
Slope (95% CI)
Intercept (95% CI)
Correlation coefficient (AL)
Correlation
ALAT
1.024 (1.102 to 1.030)
0.40 (−0.2 to 1.0)
0.999 (>0.9)
Acceptable
ALB
0.993 (0.936 to 1.049)
0.11 (−1.9 to 2.1)
0.981 (>0.9)
Acceptable
ASAT
0.985 (0.977 to 0.994)
−0.60 (−1.3 to 0.0)
0.999 (>0.9)
Acceptable
BIL
1.002 (0.993 to 1.010)
−0.08 (−0.2 to 0.1)
0.999 (>0.9)
Acceptable
CA
1.005 (0.936 to 1.075)
−0.03 (−0.2 to 0.1)
0.972 (>0.9)
Acceptable
CL
0.990 (0.965 to 1.014)
1.70 (−0.9 to 4.3)
0.996 (>0.9)
Acceptable
CK
0.998 (0.994 to 1.001)
0.30 (−0.3 to 1.0)
0.999 (>0.9)
Acceptable
DD
1.008 (0.999 to 1.018)
10.0 (−29.6 to 49.6)
0.999 (>0.9)
Acceptable
FER
0.992 (0.985 to 0.999)
−1.20 (−6.5 to 2.5)
0.999 (>0.9)
Acceptable
FOL
0.995 (0.930 to 1.060)
−0.31 (−1.9 to 1.3)
0.975 (>0.9)
Acceptable
GLUC
1.092 (0.992 to 1.066)
0.14 (−0.1 to 0.4)
0.992 (>0.9)
Acceptable
HEM
0.080 (−0.063 to 0.223)
0.70 (0.4 to 1.1)
0.123 (>0.9)
NI*
ICT
0.991 (0.970 to 1.011)
1.40 (0.9 to 1.9)
0.997 (>0.9)
Acceptable
LDH
0.978 (0.970 to 0.985)
1.70 (−3.l to 6.7)
0.999 (>0.9)
Acceptable
LIP
0.136 (0.071 to 0.202)
4.60 (2.2 to 7.0)
0.498 (>0.9)
Rejected
MG
1.016 (0.971 to 1.062)
−0.01 (−0.1 to 0.1)
0.988 (>0.9)
Acceptable
PHOS
1.007 (0.980 to 1.033)
0.00 (−0.1 to 0.1)
0.996 (>0.9)
Acceptable
K
0.969 (0.920 to 1.019)
0.08 (−0.1 to 0.3)
0.984 (>0.9)
Acceptable
PS
0.997 (0.994 to 1.001)
0.05 (−0.1 to 0.2)
0.999 (>0.9)
Acceptable
NA
1.046 (1.005 to 1.087)
−6.20 (−12.0 to −0.3)
0.991 (>0.9)
Acceptable
TP
1.018 (0.969 to 1.067)
−1.20 (−4.4 to 2.0)
0.987 (>0.9)
Acceptable
TSH
0.997 (0.983 to 1.012)
0.01 (−0.1 to 0.1)
0.999 (>0.9)
Acceptable
NI, not interpretable; ALAT, alanine aminotransferase; ALB, albumine; ASAT, aspartate aminotransferase; BIL, bilirubin; CA, calcium; CL, chlorine; CK, creatine kinase; FER, ferritin; FOL, folic acid; GLUC, glucose; HEM, haemolysis index; ICT, icterus index; TSH, thyrotropin; TP, total protein; NA, sodium; PS, protein spectrum; LIP, lipaemia index; LDH, lactate dehydrogenase
For the slope and intercept, the 95% confidence interval (95% CI) is depicted within parentheses. For the correlation coefficient, the acceptable limit (AL) is depicted within parentheses
*Results cannot be interpreted because most measured values are below the lowest detection limit of the assay
Deming-fit alanine aminotransferase (ALAT) and sodium (NA) (plasma). In the scatter plot for NA (a) and aspartate aminotransferase (ASAT), the regression line with the allowable error margins is depicted in red, data points in blue and the identity line in black. As can be seen from the bias plot, the regression line is slightly divergent from the identity line, although the discrepancy is well within the allowable error margins set by the analytical variation coefficient. The bias (b and e for NA and ASAT, respectively) and percent bias plot (c and f for NA and ASAT, respectively) shows that the data points are centered around the zero line, indicating no constant or proportional bias. (A colour version of this figure is available in the online journal)
Deming-fit lipaemia index (LIP) (plasma). In the scatter plot for LIP (a), the regression line with the allowable error margins is depicted in red, data points in blue and the identity line in black. As can be seen from the bias plot, the regression line is significantly deviant from the identity line. The bias (b) and percent bias plot (c) indicate a proportional bias of 50–100%. (A colour version of this figure is available in the online journal)
Discussion
Traditionally, laboratories have focused on improving analytical quality (e.g. precision and accuracy). A clinician's definition of quality encompasses not just a reliable result, but a rapid and reliable result at low cost.5,6 Therefore, laboratories continuously strive to reduce the intralaboratory TAT without compromising the analytical quality. A rate-limiting process in the intralaboratory TAT is the centrifugation step that separates the serum or plasma from the more dense residual blood constituents (red blood cells, white blood cells and platelets). Centrifugation can take as much as 20 min when queuing, loading, balancing, centrifuging, slowing down to a stop and unloading of the centrifuge are taken into account. Despite this, the influence of a shorter centrifugation time has been scantly investigated.7–10 Recently, Minder et al.11 reported on the effect of different centrifugation conditions on a broad range of chemistry and immunochemistry assays in human plasma. No significant difference was observed in the analytical outcome after whole blood was centrifuged according to the WHO guidelines (15 min at 2180 × g3) or for 10 min at 2180 × g or 7 min at 1870 × g. The data by Minder et al. suggest that centrifugation time can be reduced from 15 to 7 min, a 47% decrease that, according to the authors, leads to a significantly faster intralaboratory TAT. The data presented here corroborate the results by Minder et al. and show convincing data to further minimize the centrifugation time to 5 min, a conclusive 66% decrease compared with the WHO guidelines. This report also studies the influence of a shorter centrifugation time on 50 serum samples, as a substantial amount of laboratories use serum samples for their routine chemistry and immunochemistry assays.
Studying a large subset of chemistry and immunochemistry assays in serum samples, we observed no significant difference when the preanalytical centrifugation time was minimized from 10 to 5 min at 1885 × g. This suggests that the centrifugation time can be minimized by at least 50% without affecting the analytical outcome in serum samples. In plasma samples, the reduction in centrifugation time led to a proportional bias of 50–100% for the lipaemia index. This means that the lipaemia index, after a 10-min centrifugation step, is 50–100% lower compared with a centrifugation step of 5 min. The question arises if the higher lipaemia index, after a 5-min centrifugation, affects the accuracy of the reported results. Lipaemia results in a turbid plasma that interferes with the assay by light scattering or volume displacement.12 According to the package insert for the COBAS 6000, lipaemia either has a positive or negative interference for alanine aminotransferase, aspartate aminotransferase bilirubin (total and conjugated), creatine kinase, C-reactive protein, glucose, creatinin (Jaffé-based assay), urea and latent iron-binding capacity. Except progesterone, the immunoassays analysed on the COBAS 6000 are not significantly influenced by the presence of lipaemia. This is expected since immunoassays use a sandwich chemiluminescent assay with two monoclonal antibodies, extensive washing and a final measurement by electrical methods.13 To circumvent interference by lipaemia, the laboratory has taken precautionary measures for every assay by defining a maximal acceptable lipaemia index up to which the assay is not significantly interfered by lipaemia. If this maximum index is overrun, the affected results are withheld by the laboratory information system (LIS) and not reported. As described by the authors, a 5-min preanalytical centrifugation step of 1885 × g performed by the MPA results in increased values for the lipaemia index. In theory, this could lead to an extensional increase in the amount of samples that overrun the maximal lipaemia index set in the LIS. The result would be blocked and not reported to the requesting clinician. However, in the laboratory, which predominantly uses serum samples for routine analysis, ≤≤1% of the measured lipaemia indices in plasma and serum samples are above the maximum index set in the LIS. Therefore, a shorter centrifugation time will neither affect the quality of the reported result nor the quality in service.
Conclusion
The data presented in this study provide convincing evidence that the centrifugation time in serum samples can be down-scaled from 10 to 5 min without affecting the analytical result that is reported to the clinicians. For plasma samples, the centrifugation time can be successfully down-scaled to 5 min if precautionary measures, like programming the LIS, are taken to overcome analytical interference by an increased lipaemia index.
Automation of centrifugation by the MPA allows for standardization of pre- and post-centrifugation, thereby decreasing the time it takes to complete the process of loading, balancing, slowing down to a stop and unloading of the centrifuge. Therefore, a reduction in centrifugation time will ultimately fasten the intralaboratory TAT more than the mere saved 5 min. To be more specific, calculations with a simulation programme indicated that saving 5 min on centrifugation time will reduce the intralaboratory TAT by a conclusive 11 min. In an attempt to improve the intralaboratory TAT, sample quality should not be compromised. In this light, this study sets an example that shows that improving intralaboratory TAT and analytical quality can go hand in hand.
DECLARATIONS
Competing interests: GvdL is an employee of Roche Diagnostics Nederland BV.
Funding: None to disclose.
Ethical approval: Not necessary for this type of study.
Guarantor: BWJJMW.
Contributorship: MMJFK and BWJJMW conceived the study. MMJFK and GvdL set-up the experimental work which was performed by MEJFvH and MG-VZ. MMJFK wrote the first draft of the manuscript. All the authors reviewed and edited the manuscript and approved the final version of the manuscript.
Acknowledgements: None.
References
1.
van GammerenAJ, vanGN, de GrootMJ, CobbaertCM. Analytical performance evaluation of the Cobas 6000 analyzer – special emphasis on trueness verification. Clin Chem Lab Med2008;46:863–71
2.
Product information BD. How to prepare a quality sample using BD vacutainer SST tubes (V55177). See www.bd.com (last checked 15 May 2012)
3.
WHO. Use of anticoagulants in diagnostic laboratory investigations. WHO/DIL/LAB/99.1/Rev2.2002. Geneva: WHO
4.
English version of the ‘Code for proper secondary use of human tissue. The Federation of Biomedical Scientific Societies. See www.fmwv.nl (last checked 15 May 2012)
5.
NeubergerJ, PetersM. The clinical interface – a British physician's view. Clin Chim Acta1996;248:11–8
6.
WattsNB. Reproducibility (precision) in alternate site testing. A clinician's perspective. Arch Pathol Lab Med1995;119:914–7
7.
FosterK, DattaP, OrswellM, TasaicoK, AlpertA, BluesteinB. Evaluation of a centrifuge with rapid turnaround time for the preparation of plasma samples for measurement of common STAT markers on the ACS: 180 system. Clin Lab2000;46:157–60
8.
MenselB, WenzelU, RoserM, LudemannJ, NauckM. Considerably reduced centrifugation time without increased hemolysis: evaluation of the new BD Vacutainer SSTTMII Advance. Clin Chem2007;53:794–5
9.
LippiG, SalvagnoG, MontagnanaM, GuidiG. Preparation of a quality sample: effect of centrifugation time on stat clinical chemistry testing. Labmed2007;38:172–6
10.
DimeskiG, SolanoC, PteroffMK, HyndM. Centrifugation protocols: tests to determine optimal lithium heparin and citrate plasma sample quality. Ann Clin Biochem2011;48:218–22
11.
MinderEI, SchibliA, MahrerD, NesicP, PluerK. Effects of different centrifugation conditions on clinical chemistry and Immunology test results. BMC Clin Pathol2011;11:6
12.
KrollMH, EllinRJ. Interference with clinical laboratory analyses. Clin Chem1994;40:1996–2005
13.
JiJZ, MengQH. Evaluation of the interference of hemoglobin, bilirubin, and lipids on Roche Cobas 6000 assays. Clin Chim Acta2011;412:1550–3