
Abstract
Lipoprotein metabolism is dependent on apolipoproteins, multifunctional proteins that serve as templates for the assembly of lipoprotein particles, maintain their structure and direct their metabolism through binding to membrane receptors and regulation of enzyme activity. The three principal functions of lipoproteins are contribution to interorgan fuel (triglyceride) distribution (by means of the fuel transport pathway), to the maintenance of the extracellular cholesterol pool (by means of the overflow pathway) and reverse cholesterol transport. The most important clinical application of apolipoprotein measurements in the plasma is in the assessment of cardiovascular risk. Concentrations of apolipoprotein B and apolipoprotein AI (and their ratio) seem to be better markers of cardiovascular risk than conventional markers such as total cholesterol and LDL-cholesterol. Apolipoprotein measurements are also better standardized than the conventional tests. We suggest that measurements of apolipoprotein AI and apolipoprotein B are included as a part of the specialist lipid profile. We also suggest that lipoprotein (a) should be measured as part of the initial assessment of dyslipidaemias because of its consistent association with cardiovascular risk. Genotyping of apolipoprotein E isoforms remains useful in the investigation of mixed dyslipidaemias. Lastly, the role of postprandial metabolism is increasingly recognized in the context of atherogenesis, obesity and diabetes. This requires better markers of chylomicrons, very-low-density lipoproteins and remnant particles. Measurements of apolipoprotein B48 and remnant lipoprotein cholesterol are currently the key tests in this emerging field.
Introduction
Abnormalities in lipoprotein metabolism are important in atherogenesis, obesity, insulin resistance and diabetes; all being major areas of concern for public health, individual wellbeing and research. Control of lipoprotein metabolism through lifestyle measures and medication has become an essential part of cardiovascular prevention.
This paper aims to provide a perspective on apolipoproteins and their measurement in the context of lipid metabolism and associated clinical disorders.
First, lipid metabolism is briefly reviewed, with an emphasis on the role of apolipoproteins as markers of lipoprotein particles and as metabolic agents. The apolipoproteins are then discussed under the three headings: structure and function, clinical significance and methodology.
Lipoprotein metabolism
Lipoproteins are lipidated protein particles that carry hydrophobic substances in the hydrophilic environment of plasma. They are classified on the basis of their hydrated density – in an ascending order – into chylomicrons, very-low-density lipoproteins (VLDL), intermediate-density lipoproteins (IDL), low-density lipoproteins (LDL) and high-density lipoproteins (HDL). The term IDL is often used interchangeably with ‘remnant particles’. However, because the VLDL remnants may distribute both in the IDL fraction (1.006–1019 kg/L) and the VLDL fraction (<1.006 kg/L), the equivalence is not complete. For a general outline of lipid metabolism, the reader is referred to a current textbook, 1 and literature on earlier lipid research can be found in a number of previous reviews. 2–6
The surface of a lipoprotein particle consists of either hydrophilic or amphipathic substances such as phospholipids and cholesterol as well as apolipoproteins, which serve as receptor-binding and regulatory proteins. The cores of these particles contain hydrophobic molecules such as triglycerides (TG) and cholesteryl esters.
Lipoproteins differ in size, lipid composition and apolipoprotein content. These characteristics change as a result of action of enzymes such as lipoprotein lipase (LPL), 7 hepatic triglyceride lipase (HTGL), 8 lecithin-cholesterol acyltransferase (LCAT) 9,10 and cholesteryl ester transfer protein (CETP). 11 Apolipoproteins regulate the activities of these enzymes, and can transfer between different lipoprotein classes. Lipoprotein assembly and metabolism are affected both by apolipoprotein content and by their conformation. Apolipoproteins control cellular uptake of lipoproteins through binding to membrane lipoprotein receptors. Apolipoprotein B100 (apoB100) and apolipoprotein E (apoE) bind to the apoB/E (LDL) receptor. 12 Apolipoprotein E (apoE) also binds to the LDL receptor-related protein (LRP). 13 Apolipoproteins A bind to the scavenger receptor BI. 14
Lipoproteins contribute to body fuel metabolism by enabling TG distribution between tissues. They also serve as an extracellular reservoir, and a vehicle for transport, of cholesterol. Plasma TG measurements reflect the first, and measurements of total cholesterol (TC) and LDL-cholesterol (LDL-C) the second and third function. Clinical disorders may result from both defects in fuel transport and in cholesterol homeostasis. Often a defect in one process will secondarily affect the other.
Abnormalities in fuel metabolism are present in cardiovascular disease (CVD), obesity and diabetes mellitus – conditions representing the three major contemporary epidemics. Hypercholesterolaemia is related to the entry of cholesterol-containing lipoprotein particles into vascular intima and thus atherogenesis, 15 while hypertriglyceridaemia, apart from its association with cardiovascular disease, leads to steatosis and may precipitate pancreatitis. Discussion of atherogenesis is beyond the scope of this article but it has been extensively reviewed elsewhere. 16,17
Pathways of lipoprotein metabolism
To describe lipoprotein metabolism, this paper employs the conceptual framework of the fuel transport pathway (metabolism of chylomicrons, VLDL and remnant particles), the overflow pathway (the metabolism of LDL) and reverse cholesterol transport (the metabolism of HDL). 18 We believe that this approach facilitates understanding of the pathogenesis of lipid disorders and relevant therapeutic interventions.
The fuel transport pathway
The fuel transport pathway delivers TG to peripheral tissues. The TG transport function is shared by chylomicrons and VLDL. While chylomicrons are assembled during the absorptive phase of the feed-fast cycle, VLDL can be present in plasma at any time.
TG are incorporated into chylomicrons in the enterocytes, on the template of apoB48 and are secreted into the lymph (Figure 1). 19 Nascent chylomicrons contain apoB48, apolipoprotein AIV (apoAIV) and apolipoprotein AV (apoAV). Later, they acquire (probably from HDL) apoAI and apoAII and apolipoproteins C (apoCI, CII, CIII) as well as apoE. ApoAIV is released into plasma.
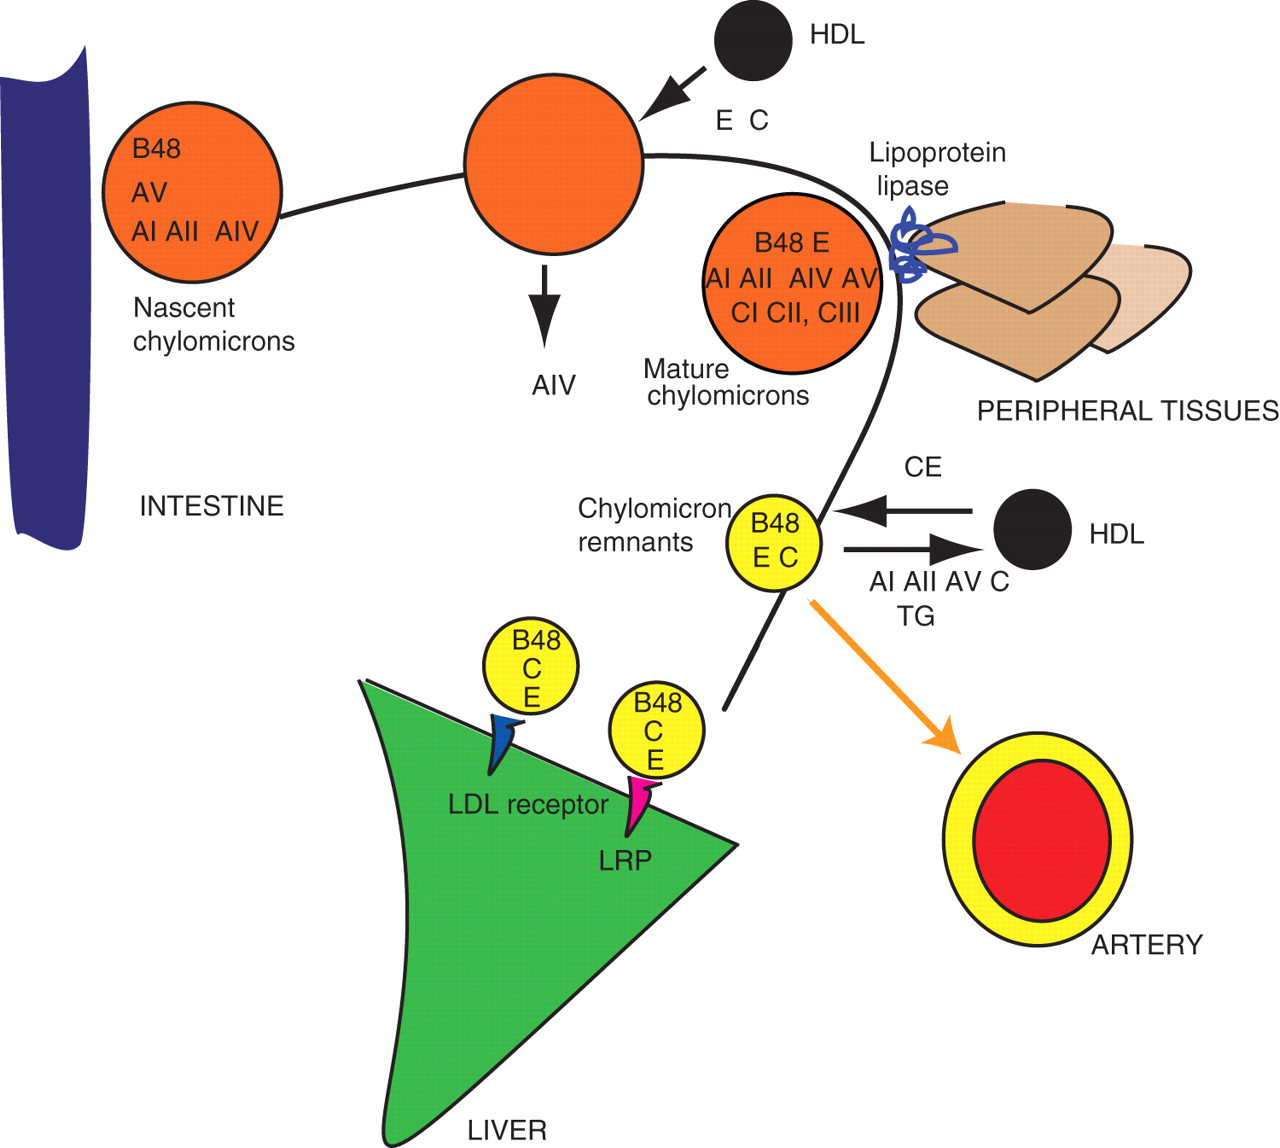
Apolipoproteins in the fuel transport pathway of lipoprotein metabolism: the chylomicrons. Chylomicrons transport triglycerides from the intestine to the peripheral tissues. Apolipoprotein B48 (present in the concentration of one molecule per particle) tracks a particle from a nascent chylomicron to a chylomicron remnant and is the most important marker of chylomicron metabolism. Note extensive apolipoprotein exchanges between different particles. The measurement of apolipoprotein B48 reflects both nascent chylomicrons and chylomicron remnants. On the other hand, the measurement of remnant lipoprotein cholesterol (RLP-C) reflects the sum of chylomicron remnants and VLDL remnants (compare Figure 2) but excludes nascent or mature chylomicrons. AI, apolipoprotein AI; AII, apolipoprotein AII; AIV, apolipoprotein AIV; AV, apolipoprotein AV; B48, apolipoprotein B48; CI, apolipoprotein CI; CII, apolipoprotein CII; CIII, apolipoprotein CIII; E, apolipoprotein E; CE, cholesteryl esters; LRP, LDL receptor-like protein; TG, triglycerides
In the periphery, chylomicron TG are digested by LPL, an enzyme present in the vascular endothelium. Fatty acids are released to cells. Chylomicrons decrease in size and become chylomicron remnants. Now apoA, most apoC, and probably apoAV, are returned to the HDL. The remnants are internalized in the liver after binding to the LRP and to the LDL receptor, mediated by apoE.
In contrast to TG absorbed from the intestine, endogenous TG are secreted from the liver in VLDL particles (Figure 2). Nascent VLDL contain apoB100 as a sole apolipoprotein. They subsequently acquire (mostly from HDL) apoA (AI, AII, AIV), apoC (CI, CII and CIII) and apoE. VLDL TG are, analogously to the chylomicrons, partially digested by LPL. This transforms VLDL particles into VLDL remnants. 20,21 VLDL remnants are internalized through the LDL receptor, to which they bind through apoE but not apoB. Note that the TG-rich particles in the fuel transport pathway lose some TG to HDL, in exchange for cholesteryl esters, 22 in a process mediated by the CETP. 23,24
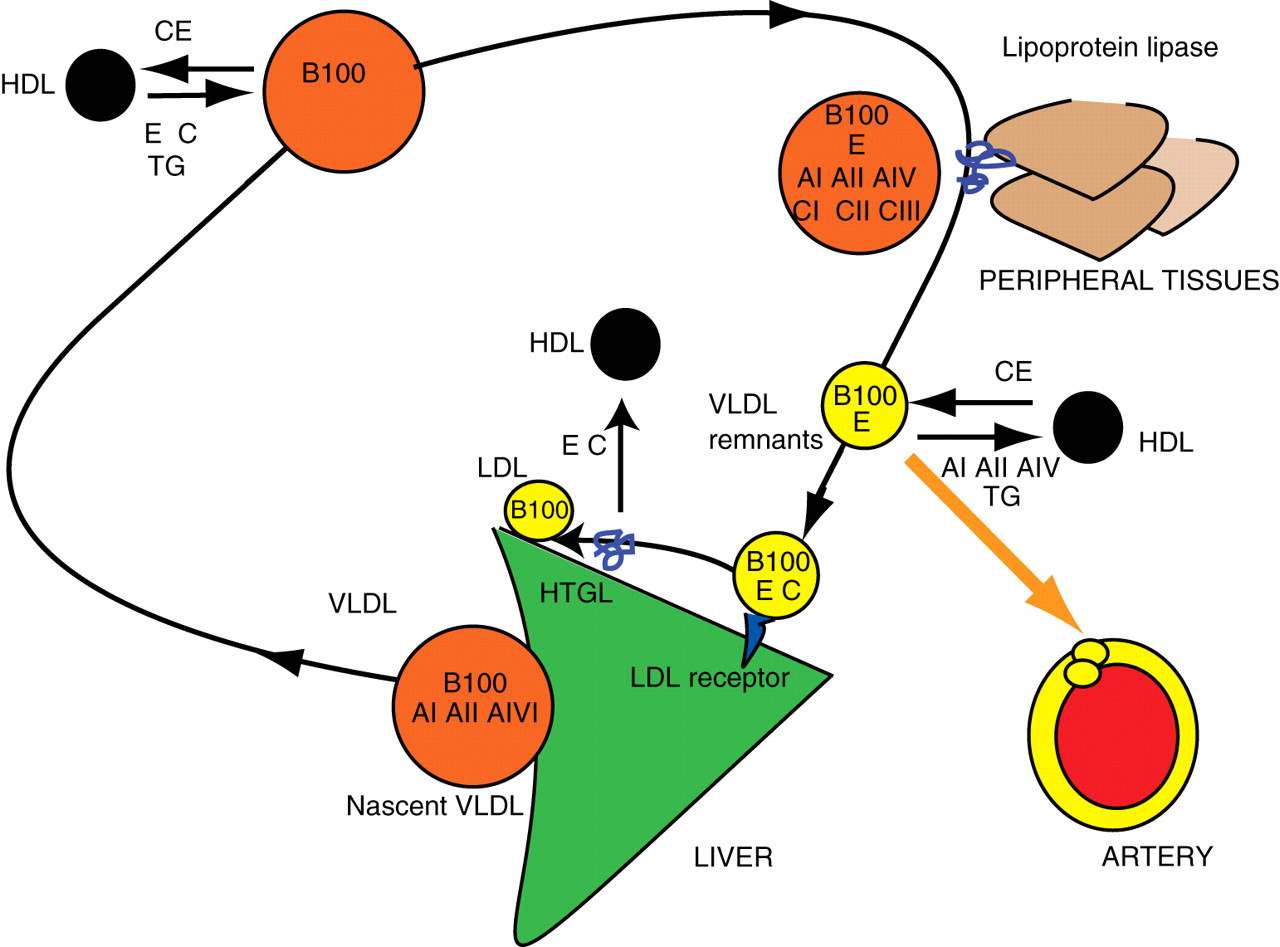
Apolipoproteins in the fuel transport pathway of lipoprotein metabolism: the VLDL. Apolipoprotein B100 tracks the metabolism of VLDL. It is present in the concentration of one molecule per particle. Note the parallels with chylomicron metabolism (compare Figure 1) in particular with regard to apolipoprotein exchanges with HDL. The fuel transport pathway generates LDL through the action of HTGL. The measurement of apoB100 includes all the particles in this pathway together with all LDL particles in the overflow pathway (compare Figure 3). AI, apolipoprotein AI; AII, apolipoprotein AII; AIV, apolipoprotein AIV; AV, apolipoprotein AV; B100, apolipoprotein B100; CI, apolipoprotein CI; CII, apolipoprotein CII; CIII, apolipoprotein CIII; E, apolipoprotein E; CE, cholesteryl esters; HTGL, hepatic triglyceride lipase
The overflow pathway
Internalization of the remnants returns these particles to the liver. This would neatly complete the fuel transport pathway, if not for the fact that the internalization occurs in parallel to further lipolysis, this time by the HTGL, which is bound to endothelium in the hepatic microvasculature. During this process, the remnants lose apoC, and apoE (which are transferred to HDL), decrease in size, and become LDL. 25 Thus the LDL particles are generated as a result of ‘overflow’ from the fuel transport pathway. This process is clinically important, because when remnant supply from the fuel transport pathway is excessive – due to oversupply or inefficient removal – more LDL particles are generated.
The overflow pathway involves further metabolism of LDL (Figure 3). ApoB100, the main apolipoprotein of the LDL, controls their internalization by binding to the apoB/E (LDL) receptor. It has lesser affinity to the LDL receptor than apoE in the remnants, and the LDL residence time in the circulation exceeds that of the remnants.
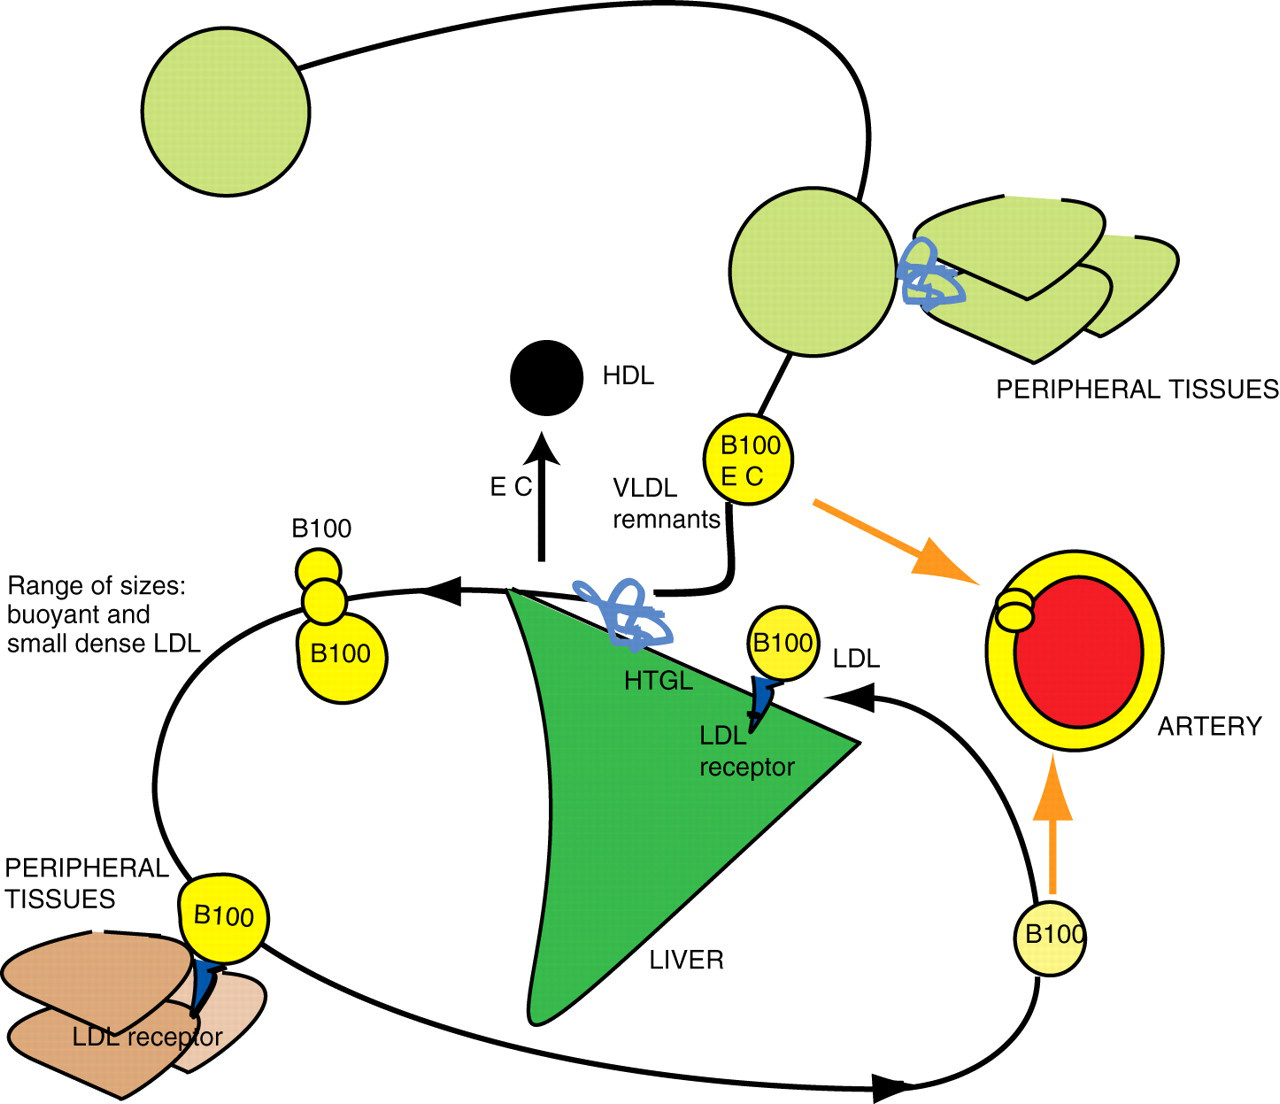
Apolipoproteins in the overflow pathway of lipoprotein metabolism: the LDL. The name overflow pathway reflects the fact that LDL are generated from the fuel transport pathway. The oversupply of remnants would increase the number of generated LDL. The predominant lipoprotein of LDL is B100, present in the concentration of one molecule per particle. The measurement of apoprotein B100 reflects the sum of LDL particles, the VLDL and the VLDL remnants. Note that LDL is generated in a range of sizes. The main determinant of their plasma concentration is the activity of the LDL receptor and the rate of cellular uptake. B100, apoprotein B100; HTGL, hepatic triglyceride lipase. Note: the empty circles in the upper part of the figure represent lipoproteins in the fuel transport pathway (refer to Figures 1 and 2)
The LDL serve as an extracellular cholesterol depot: their cellular uptake increases when LDL receptor expression increases as a result of a decrease in the intracellular cholesterol concentration.
Reverse cholesterol transport and cholesterol recycling
Metabolism of HDL, known as reverse cholesterol transport (RCT), is a pathway of removal of cholesterol from peripheral cells to the liver (Figure 4). 26–28 This view is now being challenged, since HDL also remove cholesterol from the liver inserting it back into the VLDL and remnant particles, 26 through the exchange mechanism mentioned above. Transport of cholesterol from macrophages to the liver (macrophage RCT: the central concept in atherogenesis) involves only a small fraction of circulating HDL. It seems therefore that HDL, similarly to LDL, contribute to the maintenance of the extracellular cholesterol pool.
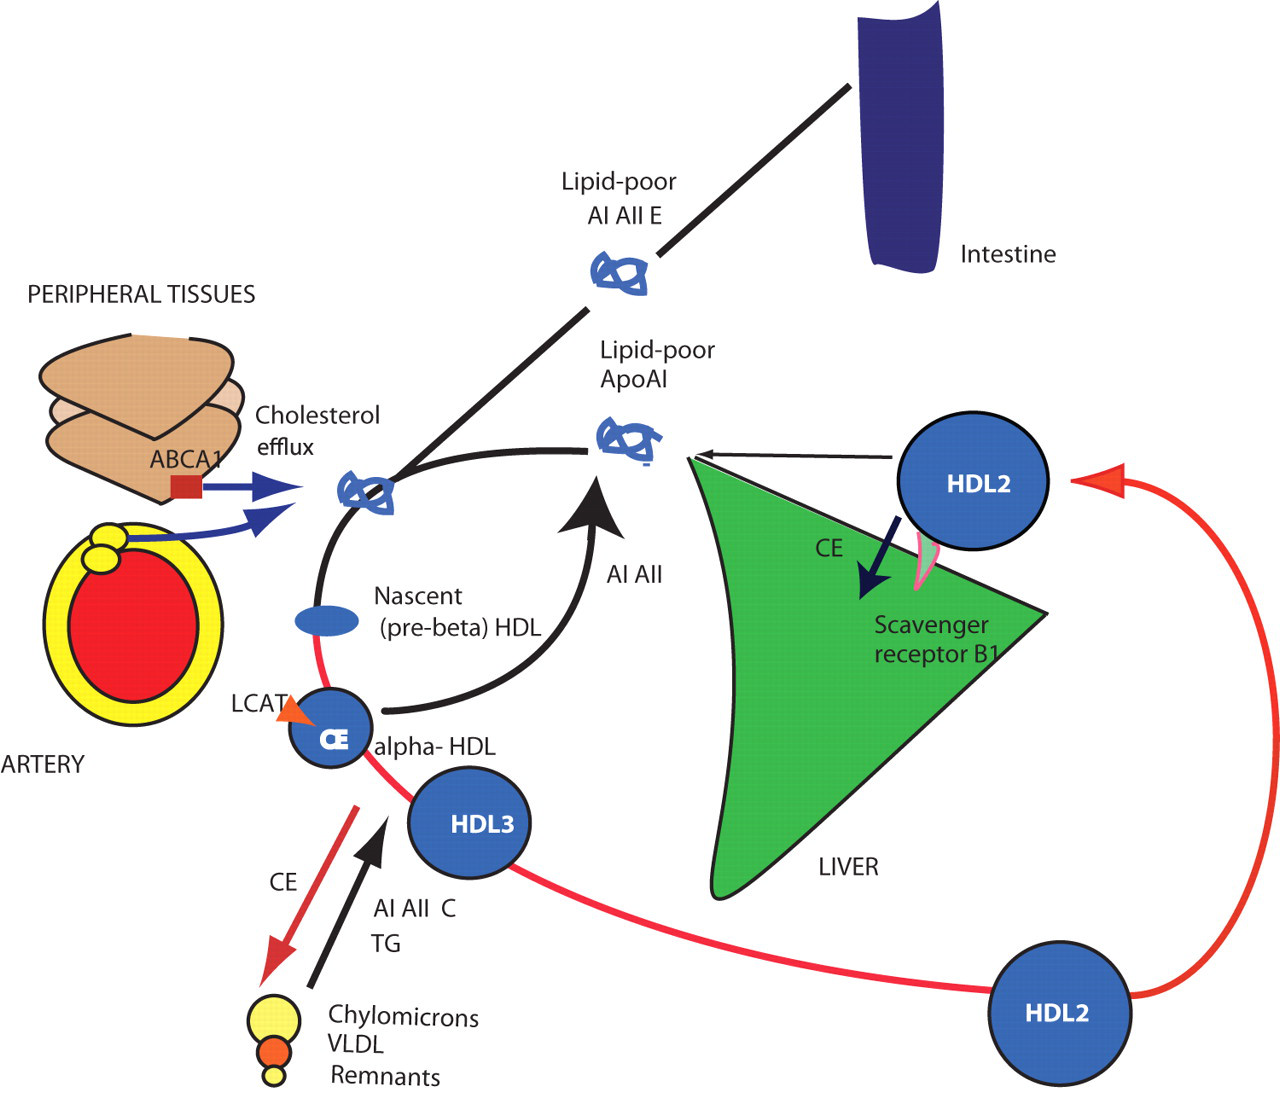
Apolipoproteins in reverse cholesterol transport: the HDL. HDL particles transport cholesterol from peripheral cells and macrophages (macrophage RCT) to the liver but also insert cholesteryl esters into the fuel transport pathway by exchanging them for TG with TG-rich proteins. In this way, HDL contributes to the maintenance of the extracellular cholesterol pool. The measurement of ApoAI is the most important marker of the activity of reverse cholesterol transport. AI, apolipoprotein AI; AII, apolipoprotein AII; AIV, apolipoprotein AIV; AV, apolipoprotein AV; CI, apolipoprotein CI; CII, apolipoprotein CII; CIII, apolipoprotein CIII; E, apolipoprotein E; CE, cholesteryl esters; B48, apolipoprotein B48; LCAT, lecithin cholesteryl-ester transferase; CE, cholesteryl-esters; ABCA1, ATP-binding cassette transporter A1; RCT, reverse cholesterol transport; TG, triglycerides
HDL are assembled on the matrix of the apoA. ApoA is secreted by the liver and intestine and is lipidated extracellularly, transforming into nascent (pre-beta) HDL, phospholipid-rich, discoid particles. They acquire cholesterol by binding to the membrane ATP-binding cassette transporter A1 (ABCA1) that controls efflux of free cholesterol from cells. Cholesterol is subsequently esterified by LCAT. Accumulation of cholesteryl esters changes the particle to spherical HDL3. HDL3 transfer cholesteryl esters, apoA, apoC and apoE to TG-rich lipoproteins in exchange for TG (see above). This process enlarges the HDL particles which became HDL2. HDL2 subsequently offload cholesteryl esters by docking into the scavenger receptor BI (there is no particle internalization).
Conventional markers of lipoprotein metabolism
The conventional ‘routine’ markers of lipoprotein metabolism include TC, LDL-cholesterol (LDL-C), HDL-cholesterol (HDL-C) and plasma TG. More detailed assessment of a lipid profile includes ultracentrifugation-based analysis. Since lipoprotein components such as cholesterol or TG are present in more that one lipoprotein class, neither of them can serve as an absolute marker of a particular class. Moreover, LDL, similarly to VLDL, are heterogeneous in size. 29,30 All this means that measurement of LDL-C is not a good indicator of the number of LDL particles.
The most commonly measured substance, cholesterol, is measured either in the plasma (TC) 31 or in lipoprotein fractions (LDL-C, HDL-C). TC predominantly reflects the concentration of LDL particles. HDL-C constitutes around 25% of TC. VLDL normally constitute only approximately 15% of the total. Measuring HDL-C together with TC enables computing the TC/HDL-C ratio, assumed to reflect the balance between transport of cholesterol to the periphery and its return to the liver.
The measurement of TG, the third component of the traditional ‘fasting lipid profile’, reflects the concentration of VLDL and remnant particles, and, postprandially, chylomicrons and their remnants. In routine practice, measurements of TC, HDL-C and TG allow calculation of LDL-C by the Friedewald formula:
32

Thus LDL-C is estimated by taking into account the HDL-C and TG concentration. LDL-C calculated in this way in fact includes VLDL-C, IDL-cholesterol (IDL-C) and lipoprotein (a) (Lp(a))-cholesterol. Naturally, this calculation incorporates the errors of TC, HDL-C and TG measurements. The formula is not applicable at TG concentrations above 4.5 mmol/L. In spite of these limitations, the formula has been commonly used for the assessment of cardiovascular risk and particularly for the monitoring of lipid-lowering treatment.
More recent is the calculation of non-HDL cholesterol (NHDL-C). This is calculated as:

The ‘gold standard’ method of measuring lipids and lipoproteins (the so-called beta-quantification) employs ultracentrifugation to partially separate lipoproteins.
37
After removal of VLDL by ultracentrifugation, the other apoB-containing lipoproteins in the infranatant are precipitated using heparin and manganese chloride, leaving HDL in solution for cholesterol measurement. LDL-C is calculated as:

Note that here the calculated LDL-C value also includes IDL-C and Lp(a) cholesterol. This method is available in the UK in specialized lipid laboratories.
As already mentioned, the LDL-C measurement reflects just one component of LDL particles and cannot provide precise estimation of the LDL particle number, an important parameter relating to LDL atherogenecity.
In Friedewald's paper, the differences between calculated and measured LDL, after exclusion of patients with TG above 4.5 mmol/L (400 mg/dL), were 4.8–9.8% depending on the type of dyslipidaemia. 32 When Friedewald-formula-derived LDL-C and LDL-C obtained through beta-quantification were compared across five categories of LDL-C concentration, the misclassification rates (instances where a result obtained by each method would fall into a different category) were 20–30%. On the other hand, using standardized methodology of apolipoprotein measurement and reference material SP-07, the between-laboratory coefficient of variation for apoA was 2.1–5.6% and for apoB 3.1–6.7%. 38
Thus there are both technical inadequacies and scientific limitations inherent in ‘conventional’ methods of lipid and lipoproteins assessment. For a more detailed account of the conventional tests, the reader is referred to other reviews. 31,39
Structure and function of apolipoproteins
Please refer to Table 1 throughout this section.
Structure and function of apolipoproteins
CHO, carbohydrates; AA, aminoacids; RCT, reverse cholesterol transport; LRP, LDL receptor-like protein
Please see text for references
Apolipoprotein B100
ApoB100 consists of 4536 amino acids and has a molecular mass of 550,000 Da. After cleavage of 27 amino acids from the N-terminal end, the molecular mass decreases to 513,000 Da. 40,41 It possesses a globular amino-terminal domain, which reacts with microsomal TG transfer proteins. 42 The gene for apoB is located on the short arm of chromosome 2. One hundred and twenty-three genetic variants in the apoB gene were identified in the Copenhagen City Heart Study. ApoB polymorphisms include T2488T and E4154K, 43 which are signal peptide insertion/deletion polymorphisms. Mutation of apoB100 at amino acid residue 3500 affects its receptor-binding and leads to a disorder known as familial defective ApoB (FDB). 44 ApoB100 is synthesized in the hepatocytes and its excess is degraded within cells. It resides in the VLDL, LDL and LDL particles at a ratio of one molecule per lipoprotein particle. Thus, it is a marker of the number of these particles.
Apolipoprotein B48
ApoB48 has 2152 amino acids and a molecular mass of 264,000 Da. It is a truncated form (amino-terminal 40%) of apoB100. 45 ApoB100 and apoB48 are produced from a single gene. During the editing process of the apoB mRNA, deamination of a cytidine nucleotide 6666 to uridine converts that codon to a stop codon. This results in synthesis of apoB48. ApoB48 is synthesized by enterocytes and secreted in chylomicrons, and is retained in chylomicron remnants. Since one molecule of apoB48 is present in each chylomicron particle, it serves as a marker of the number of chylomicrons and their remnants. ApoB48 does not possess the LDL-receptor binding domain: the remnants are internalized by the apoE-binding LRP and also to a degree by the LDL receptor, to which they also bind through apoE. 46
Particles smaller than 70–80 nm can penetrate the vascular wall. Therefore, chylomicron remnants, but not nascent chylomicrons, are regarded as atherogenic. Chylomicron remnants are enriched in cholesteryl esters through exchange with HDL (see above). 47
Apolipoprotein AI
ApoAI is a protein of 243 amino acids. The apoA gene is located on chromosome 11, and is part of the APOA1/C3/A4/A5 gene cluster. 48 It is synthesized in the liver and intestine. 49 The concentration of apoAI is controlled by its degradation rate: apoAI that cannot acquire lipids is rapidly degraded. ApoAI constitutes 70% of HDL apolipoproteins. It activates LCAT and is also an anti-inflammatory molecule and an antioxidant. 50 Plasma levels of apoAI vary and depend on method of measurement and population.
Apolipoprotein AII
ApoAII is a 77-amino acid homodimer with molecular mass of 17,400 Da. It is predominantly expressed in the liver. ApoAII accounts for approximately 20% of HDL protein. HDL particles contain just apoAI (these are designated as LpAI) or both apoAI and apoAII (LpAI/AII). 51 ApoAII concentration is determined by its production rate. It inhibits LPL activity (and may also inhibit HTGL), and serves as a co-factor for LCAT and CETP. It may replace apoCII (a LPL activator) in the VLDL, or directly inhibit the LPL. LPL activation by the HDL particles was impaired in transgenic mice expressing human apoAII. 52 Experiments in transgenic mice also demonstrated that apoAII is associated with obesity and insulin resistance. In contrast to the results of mouse studies, 53 it seems that it may be inversely associated with the risk of coronary disease in humans. 54 ApoAII has been reviewed by Tailleux et al. 55
Apolipoprotein AIV
ApoAIV is a glycoprotein with molecular weight of 46,000 Da. It is synthesized in the intestine and is incorporated into nascent chylomicrons. It is also present in HDL. Because it is relatively hydrophilic, it may be displaced from lipoproteins by apoCII and apoE and circulates predominantly as lipid-free protein. It participates in intestinal lipid absorption, in the assembly of chylomicrons and affects various aspects of lipoprotein response to diet. Its polymorphism Q360H leads to an increased postprandial TG concentration, a reduced LDL response to dietary cholesterol and an increased HDL response to dietary fat. The effects of T347S polymorphism are opposite to Q360H. ApoAIV also modulates the activity of LPL and activates LCAT. 56
Apolipoprotein AV
ApoAV modulates hepatic VLDL synthesis and secretion. The gene coding for apoAV (APOA5) has been strongly associated with TG concentration. ApoAV deficiency leads to type V dyslipidaemia and to reduced post-heparin LPL activity. On the other hand, its overexpression leads to a decreased TG concentration. ApoAV is synthesized in the liver. 57 In the Australian Genetic Epidemiology of Metabolic Syndrome (GEMS) family network study, the most common haplotype was associated with low TG and high HDL-C. 58 Two other haplotypes were associated with an opposite profile.
The recent large-scale Mendelian randomization experiment has confirmed the association of −1131T > C APOA5 gene promoter with lipid values and CHD risk. 59 Each C allele was associated with a 16% increase in TG compared with common homozygotes.
Apolipoproteins C
ApoCIII is an 8800-Da glycopeptide synthesized mostly in the liver and also in the intestine. There are three isoforms of apoCIII characterized by a different degree of sialylation: 0, 1 and 2. ApoCIII-1 and -2 comprise 90% of apoCIII in the plasma. APOC3 gene is part of the APOA1/C3/A4/A5 gene cluster. 60,61
Apolipoproteins C participate in the assembly of VLDL and chylomicrons.
ApoCI is present in TG-rich lipoproteins and displaces apoE in lipid emulsions. ApoCII, on the other hand, activates LPL and therefore contributes to VLDL lipolysis. ApoCIII cycles between lipoproteins: chylomicrons acquire apoC and apoE from other lipoproteins. ApoCI and apoCIII inhibit LPL, and probably also HTGL. They may also inhibit the uptake of remnant particles by inhibiting apoE binding to receptors. ApoAV may counteract the effects of apoCIII.
Apolipoprotein E
ApoE is a single-chain glycoprotein of 299 amino acids with a molecular weight of 34,200 Da. 62,63 It is widely distributed across lipoprotein classes: it is present in chylomicron remnants, mature VLDL, VLDL remnants, LDL and HDL. It binds with a high affinity to the LDL-receptor as well as to the LRP (the binding is mediated by apoCI). It facilitates clearance of chylomicron and VLDL remnants. Approximately 60% of plasma apoE is present in the HDL, which exchange it with other lipoproteins. It is also synthesized by macrophages (including macrophages present in atherosclerotic lesions) 63 and by brain astrocytes. 64,65 ApoE controls cholesterol efflux from cells together with apoAI. 66 It also has antioxidant properties and plays a role in the regulation of inflammatory response.
ApoE exists in three isoforms, E2, E3 and E4, coded by alleles ϵ2, ϵ3 and ϵ4. 67 The differences between the isoforms are due to amino acids at positions 112 and 158. ApoE3 (frequency 60–70% in the general population) has cysteine at position 112 and arginine at position 158, apoE4 (frequency 15–20%) has arginine 112 and arginine 158, and apoE2 (frequency 5–10%) has cysteine at both 112 and 158. Individuals with ϵ4 allele have higher plasma cholesterol concentration than those with ϵ2. 68 Such individuals are also characterized by more efficient cholesterol absorption and increased apoB synthesis. Their apoB100 metabolism is slower. ApoE activates LPL, HTGL and LCAT. ApoE3 and apoE4 have similar affinity to the LDL receptor, while apoE2 has lower affinity. ApoE-deficient mice show increased plasma cholesterol concentration, and over-expression of apoE in transgenic rabbits and mice decreases plasma cholesterol. The ϵ2/2 genotype is associated with familial dysbetalipoproteinaemia (also known as type III hyperlipidaemia). However, although one per cent of the population possess this genotype, dysbetalipoproteinaemia is present in only one person in 10,000. 69 On the other hand, more than 90% of patients with dysbetalipoproteinaemia have ϵ2/2 genotype, and genotyping is used as a confirmation of diagnosis (see below).
Plasma apoE explains 20–40% of the variability of TG concentrations in humans. Overexpression of apoE leads to hypertriglyceridaemia through stimulation of VLDL production and decrease in its clearance (for a review see Huang). 70
Apolipoprotein (a) and lipoprotein (a)
Lp(a) consists of apolipoprotein (a) (apo(a)) attached to apoB100 by a disulphide linkage. 71 An important characteristics of the apo(a) is its structural polymorphism. 72 Apo(a) contains multiple kringles (kinks in the polypeptide chain), and the so-called kringle 4 is the most polymorphic one of these. Apo(a) is synthesized in the liver and it may undergo post-translational modifications. Its molecular mass ranges between 187,000 and 800,000 Da and its plasma concentration ranges from 0.1 to 1000 mg/dL. Its synthesis is controlled by a series of autosomal alleles. The rate of synthesis is the main determinant of its concentration in plasma.
Lp(a) binds to the LDL receptor. It is removed by the liver in rodents but in humans it is also partly cleared by the kidney. Thus, Lp(a) concentration is elevated in renal failure. CVD risk associated with Lp(a) is also associated with high concentrations of LDL-C. Lp(a), similarly to the LDL, can penetrate vascular walls and associate with intimal proteoglycans. 73 Lp(a) is structurally related to plasminogen and potentially can interfere with its action. 74,75 Although its protease activity appears to be minimal, it might influence the activation of plasminogen and thus affect fibrinolysis. Lp(a) has been shown to inhibit tissue plasminogen activator. 76 Its concentration in plasma correlates with concentrations of fibrinogen and D-dimer.
Clinical applications of apolipoprotein measurements
Apolipoproteins A and B and cardiovascular risk
The plasma concentration of apoB is positively associated, and that of apoAI inversely associated, with cardiovascular risk. 77 The apoB/apoAI ratio has been interpreted, similarly to the TC/HDL-C ratio, as a reflection of the balance between the atherogenic potential of the VLDL, IDL and LDL, and the antiatherogenic effect of HDL. Current debate focuses on whether the measurements of apoB and apoAI should complement (or substitute) measurements of TC, LDL-C and HDL-C as markers of cardiovascular risk. There is ample, although not completely uniform, evidence that apoB concentration is a better marker of cardiovascular risk than TC or LDL-C. 78 A major piece of evidence was provided by the Apolipoprotein-Related Mortality Risk Study (AMORIS), 79,80 which included 175,553 individuals followed up for approximately 65 months. The relative risk (RR) of fatal myocardial infarction (MI) associated with 1 standard deviation (SD) increase in apoB concentration was about 2.7. This increased to 3.6 in individuals younger than 70 years. The apoB/AI ratio was associated with an even higher RR of almost 4. ApoB/AI ratio, but not TC or TG, retained predictive power after the age of 70 years. Particularly interesting was the observation of a high predictive power of the ratio in women older than 70 years, where RR reached values between 8.0 and 9.1.
Another major study, INTERHEART, was based on 12,461 cases and 14,637 controls from 52 countries. It showed that apoB/A1 ratio was related to the incidence of MI 81 with RR 1.59 (95% CI 1.53–1.64) per 1 SD increase. Results were consistent across age, gender and ethnicity. In this study, TC lost its predictive power in patients aged 70 and older, whereas apoAI, apoB and apoB/A1 remained predictive. The RR was also consistently higher for the apoB/AI than for TC/HDL-C ratio. The RR for MI associated with 1 SD change in each of the parameters was 1.16 for TC, 0.85 for HDL-C, 1.21 for non-HDL-C, 0.67 for apoAI, 1.32 for apoB, 1.17 for TC/HDL-C and 1.59 for apoB/apoAI. Importantly, a high apoB/AI was associated with the highest risk, even if TC/HDL-C ratio was relatively low.
The results of the Copenhagen City Heart Study also suggest that apoB predicts ischaemic cardiovascular disease better than LDL-C. 82 The study involved 9231 asymptomatic women and men followed prospectively for eight years. For apoB, the upper versus the lower tertile hazard ratios (HR) for CHD were 1.8 (1.2–2.5), for MI 2.6 (1.4–4.7) and for any ischaemic cardiovascular event 1.8 (1.3–2.3). ApoB showed higher predictive ability than LDL-C for CHD, MI or any ischaemic event as well as any non-fatal ischaemic event.
In the earlier Quebec Cardiovascular Study, 83 after five years follow-up, the RR of CHD associated with a 1 SD increase in apoB concentration was 1.4. The RR associated with apoAI was 0.85 but adjustment for selected lipids and lipoproteins eliminated this association. In that study, the apolipoproteins were measured using the now largely abandoned Rocket immunoelectrophoresis method.
In the Third National Health and Nutrition Examination Survey Mortality Study (NHANES III) involving 7594 American men and women (mean age 45, followed up on average by 124 person–months), the apoB measurements predicted death (HR 1.98, CI 1.09–3.61). 84 ApoAI was negatively associated with risk (HR 0.48 [CI 0.27–0.85]). TC was associated with mortality to a lesser extent (HR 1.17 [CI 1.02–1.34]). HDL-C showed a HR of 0.68 (CI 0.45–1.05), which was borderline-significant. ApoB/AI ratio showed a HR of 2.14 (CI 1.11–4.10) and TC/HDL-C ratio demonstrated a HR 1.10 (CI 1.04–1.16). After adjustment for other risk factors, only apoB with HR 2.01 (CI 1.05–3.86) and apoB/AI ratio with HR 2.09 (CI 1.04–4.19) remained significant predictors of CHD death.
On the other hand, in the MONICA/KORA Augsburg study of men and women followed up for 13 y, the predictive power of apoB/AI and TC/HDL-C was similar. 85
In 2009, the Emerging Risk Factor Collaboration (ERFC), a group of investigators with access to data from 122 previously conducted prospective studies, performed a meta-analysis comparing the value of NHDL-C and HDL-C testing with measurements of apoAI and apoB in the assessment of vascular risk. 86 They analysed population-based studies of persons with no history of cardiovascular events. However, they excluded AMORIS because of the lack of baseline data on several risk factors. This meta-analysis combined studies that measured apolipoproteins using different methodologies (Table 2). The mean age of participants was 58 years, 40% were women and 60% men, and a median of 6.1 years elapsed to the first outcome. Associations with risk were similar for NHDL-C and apoB, and for HDL-C and apoAI. The HR was 1.50 (1.38–1.62) for the NHDL-C/HDL-C ratio (taken as a ‘statistical’ equivalent of TC/HDL-C) and 1.49 (1.39–1.60) for 1 SD increase in apoB/AI. The median NHDL-C and HDL-C values in analysed studies would correspond roughly to TC concentrations of 6–6.8 mmol/L (taking into account the lowest and highest reported HDL-C concentrations). The ERFC authors concluded that there is ‘epidemiological equivalence’ of cholesterol and apolipoprotein ratios. As far as population-wide assessment of cardiovascular risk is concerned, they concluded that ‘lipid assessment in vascular disease can be simplified by measurement of either cholesterol levels or apolipoproteins without the need to fast and without regard to triglyceride’. They suggested that judgements regarding apolipoprotein measurements in clinical practice should be made on the basis of factors such as cost or methodological aspects.
Methods of measurement of apolipoprotein A and B used in clinical studies analysed by the Emerging Risk Factors Collaboration consortium 62
Apolipoprotein concentrations were also shown to predict cardiovascular risk in patients treated with statins. In the Air Force/Texas Coronary Prevention Study (AFCAPS/TEXCAPS; 6605 participants with average initial TC concentration but low HDL-C), apolipoproteins, but not LDL-C, were predictive of the first acute event. 87 Moreover, only apoB/AI and apoB predicted subsequent risk on treatment. The American Diabetes Association and American College of Cardiology now recommend apolipoproteins as a best choice to assess statin treatment. 88
On the other hand, in the Veterans Affairs High-Density Lipoprotein Intervention Trial (VAHIT) of fibrate treatment, where the LDL-C was relatively low, neither LDL-C nor apoB predicted CVD risk. 89 Interestingly, however, in that study the number of LDL particles was better associated with cardiovascular risk than the LDL-C.
Apolipoproteins A, B and the metabolic syndrome
The measurements of apoAI and apoB proved useful in assessing CVD risk in patients with metabolic syndrome – an entity primarily associated with abnormalities in the fuel transport pathway. 90 In the Attica Study of 1514 men and 528 women, 91 the apoB/A1 ratio was the best diagnostic marker of the metabolic syndrome as defined by the National Cholesterol Education Program Adult Treatment Panel III (NCEP ATPIII) criteria. The RR for metabolic syndrome in individuals with apoB/A1 greater than 0.74 was 3.21 (CI 2.56–4.21). Similar results were obtained by Onat et al., 92 during prospective evaluation of 1125 men and 1123 women (age 28–74 years), followed up for 5.9 years. ApoB predicted dyslipidaemia, metabolic syndrome and, in women, hypertension and diabetes. This was independent of markers of central obesity and inflammation. Individuals in the top tertile of apoB concentrations had a RR of developing the metabolic syndrome about two-fold that of those in the bottom tertile.
Apolipoproteins A and B in the diagnosis of specific disorders of lipoprotein metabolism
Abnormalities in apolipoprotein concentrations define specific disorders of lipid metabolism. Hyperapobetalipo-proteinaemia is a condition characterized by an increased concentration of apoB and normal TC and variable TG concentrations. 93 De Graaf et al. 94 have developed a diagnostic algorithm to use apoB measurements in the diagnosis of dyslipidaemias. Sniderman and Faraj 95 also reviewed data concerning apoA and apoB and cardiovascular risk in relation to metabolic syndrome, insulin resistance and abdominal obesity.
Clinical utility of apoB and apoAI measurements has been comprehensively discussed in a Special Report from the Working Group of the Lipoproteins and Vascular Diseases Division of the American Association for Clinical Chemistry. 96 The Group suggested the use of apoB measurement along with LDL-C to assess the LDL-related risk. American Diabetic Association and American College of Cardiology consensus also suggests that apolipoprotein measurements are important in the metabolic syndrome. 97 In a recently published roundtable discussion, there was agreement that apoB assessments should be used by clinical lipidologists and be incorporated into guidelines. 98
Apolipoprotein B48 as a marker of postprandial metabolism and its relation to cardiovascular risk
Humans spend a substantial proportion of their time in the postprandial state. Zilversmit 99 in 1979 suggested involvement of postprandial metabolism in atherogenesis. Later, Patsch 100 demonstrated that individuals with CHD present with more prolonged postprandial lipaemia. Postprandial lipaemia can predict atherosclerosis. 101 Non-fasting TG were also a significant predictor of CVD. 102,103 Plasma concentration of apoB48 correlated with postprandial lipaemia. 104 Importantly, postprandial elevation of TG, chylomicrons and chylomicron remnants, and also of apoB48, occurs in obesity, insulin resistance and diabetes mellitus. This further emphasizes clinical relevance of the fuel transport pathway and its potential markers.
Apolipoprotein CIII and cardiovascular risk
ApoCIII was found to predict cardiovascular risk. In the Turkish population, total apoCIII, as well as non-HDL-apoCIII and HDL-apoCIII, predicted the metabolic syndrome with a RR of 2.5. In that study, the total apoCIII and non-HDL-apoCIII were also predictive of the incident CHD. 105 Evidence linking apoCIII measurement with cardiovascular risk has recently been reviewed by Chan et al. 61
Apolipoprotein E and cardiovascular risk
Bennet et al. 68 reviewed studies on apoE and CVD risk conducted between years 1970 and 2007, analysing data from 86,067 healthy participants and using the ϵ3/ϵ3 genotype as a reference point. Individuals with ϵ2/ϵ3 genotype compared with ϵ3/ϵ4 had cholesterol lower by 6–9%. Individuals with ϵ2/ϵ2, compared with ϵ4/ϵ4, had approximately 14% lower cholesterol concentration. The differences in HDL-C between genotypes (both between ϵ2/ϵ3 and ϵ3/ϵ4, and between ϵ2/ϵ2 and ϵ4/ϵ4) were approximately 5%. There was a non-linear association between the ϵ2 genotype and plasma TG, with the highest levels in ϵ2/ϵ2 and lowest in ϵ3/ϵ3. When the ϵ3/ϵ3 genotype was used as a reference, ϵ2/ϵ2 showed odds ratio (OR) for coronary risk of 0.83, ϵ2/ϵ3 0.82, ϵ2/ϵ4 0.93, ϵ3/ϵ4 1.05 and ϵ4/ϵ4 1.22.
Apolipoprotein E and obesity
The Atherosclerosis Risk in Communities (ARIC) study demonstrated that the body mass index progressively increased in persons with isoforms E4 to E3 to E2. 106 Also, in obese men, apoE4 isoform was associated with higher plasma insulin and glucose concentrations. 107,108 On the other hand, apoE-deficient mice had reduced body weight and impaired adipose tissue TG and lipid clearance. 85,109,110 In other strains of mice, apoE expression worsened glucose tolerance and decreased insulin sensitivity and facilitated obesity. 111 Inactivation of the LRP resulted in a reduction in body weight parallel to the decreased postprandial lipid clearance. 112 ApoE, because of its role in the metabolism of chylomicron remnants, may be particularly important in diet-induced weight gain. Little is known about the mechanisms linking apoE expression and weight gain in humans. It may participate in the differentiation of preadipocytes. Animal studies suggest that the most important candidate mechanism is the facilitation of delivery of dietary lipids to the adipose tissue, a process that may be impaired in either the absence of apoE expression or defects in relevant receptors. Thus apoE, which is recognized to be atheroprotective, might be a molecule that facilitates obesity (for a review see Kypreos et al.). 62
Apolipoprotein E in the brain
ApoE concentration in the brain is secondary only to that in the liver. It is synthesized by astrocytes and microglia, and to a lesser extent by neurones. Its cellular uptake in the central nervous system (CNS) is mediated by the LDL receptor and by LRP. It affects growth and repair of CNS cells, is involved in anti-inflammatory response and is an antioxidant. Individuals of ϵ4/ϵ4 genotype are at a greater risk of developing a sporadic form of Alzheimer's disease (AD). 113 The ϵ4 isoform is also a risk factor for mortality from intracerebral haemorrhage. 114
Lipoprotein (a) and cardiovascular risk
Lp(a) concentration is almost entirely genetically determined. Lifestyle factors have virtually no influence, with the exception of alcohol intake (heavy alcohol intake lowers Lp(a) concentration). Catena et al. 115 reviewed Lp(a) and cardiovascular risk in the context of hypertension. Interestingly, Lp(a) was the best discriminator of the presence of hypertensive organ damage. 116 This was related to low molecular weight apo(a) isoforms. 115
Meta-analysis by Danesh et al. 117 and by the ERFC 118 also confirmed the association between Lp(a) and CVD risk. There was a continuous, independent, modest association of Lp(a) with risk of CVD and stroke. On the other hand, studies where such association was not observed include the Physicians' Health Study, the Helsinki Heart Study and the Quebec Cardiovascular study. The discrepancies have been ascribed to collection and sample storage problems as well as to the lack of assay standardization.
The recent Reykjavik study included 8888 male and 9681 female participants with no previous history of MI. 119 The nested controls were matched by recruitment year, sex and age. Lp(a) was measured using a monoclonal anti-Lp(a) antibody for capture and polyclonal anti-apoB antibody for detection, and was not sensitive to Lp(a) isoforms. An increase in Lp(a) was associated with the risk of CHD (OR 1.6–1.7; comparison between the bottom and top tertiles of distribution): this was a lower odds ratio than that observed for TC but higher than that for high-sensitivity C-reactive protein or TG concentrations. Importantly, the RR increased with increasing Lp(a) concentrations. The authors also performed a valuable meta-analysis of 31 previous studies, with 14 of them performed after completion of the earlier meta-analysis by Danesh et al. The reported mean concentrations of Lp(a) varied from 1 to 30 mg/dL. There was a consistent association of Lp(a) with CHD risk (OR between 1.25 and 2.5 between bottom and top third of Lp(a) concentrations). In five studies it was between 1 and 1.25, and in three studies there was no association.
Another systematic review of 40 studies involving 58,000 participants concluded that people with smaller apo(a) isoforms have an approximately two-fold higher risk of CHD or ischaemic stroke than those with larger ones. 120 Further studies are needed to determine whether the impact of smaller apo(a) isoforms is independent from Lp(a) concentration and other risk factors.
During the European Atherosclerosis Society (EAS) Congress in 2010, the EAS Consensus Panel reported key points of the forthcoming scientific consensus statement on Lp(a). They recommend that patients with moderate or high CVD risk should be screened for Lp(a) and that there should be a treatment goal of Lp(a) concentration below 50 mg/dL. 121 This approach has been recently criticized. 122
In view of the consistency of data linking Lp(a) with CVD risk, and the long-term stability of Lp(a) concentrations, we recommend that Lp(a) measurement should be part of the initial assessment of the CVD risk in clinical practice.
Table 3 summarizes changes in the concentrations of plasma apolipoproteins seen in different types of dyslipidaemia.
Apolipoproteins in hypercholesterolaemia, hypertriglyceridaemia and in mixed dyslipidaemia
FH, familial hypercholesterolaemia; FDB, familial defective apoB; TC, total cholesterol; FCHL, familial combined hyperlipidaemia; CVD, cardiovascular disease
Please see text for references
Methodology of apolipoprotein measurements
ApoAI and apoB measurements are carried out by immunological techniques using antibodies raised against specific epitopes. In early years, techniques included radial immunodiffusion, radioimmunoassay and electroimmunoassay. With the emergence of automation and advances in the production of monospecific and monoclonal antibodies, techniques used today include enzyme-linked immunosorbent assays (ELISA), immunonephelometry and imunoturbidimetry. About 20 years ago, the International Federation of Chemistry and Laboratory Medicine (IFCC) initiated a programme to develop suitable reference material for apoAI and B. This resulted in World Health Organization (WHO) International Reference Materials for apoAI and apoB. 123,124 Today all instruments and assay kits should have calibrators that can be traced to the WHO-IFCC Reference Material. The between-assay precision on human samples in the IFCC standardization project was 4.0–6.7% for apoAI and 4.8–8.7% for apoB. 123
Individual commercial reagent kits may show interference with lipaemia and hyperbilirubinaemia: these interferences are noted in the technical data sheets. It is general practice for upper limits to be quoted, e.g. it is common to see interference at TG > 800 mg/dL (approx 9 mmol/L). Although the precision of currently available apolipoprotein measurements is usually below 5%, values still vary between laboratories, and external quality assurance systems show coefficient of variation of up to 10%. This is due to bias in different methodologies such as nephelometry or immunoturbidimetry, and the use of different clinical chemistry analysers. With advances in standardization, precision and automation, it is viable for all clinical biochemistry laboratories to measure apoAI and apoB routinely. We, however, recommend that each laboratory establishes individual reference ranges specific for the instrument, assay kits and population served by the laboratory. This may be difficult to do in practice for individual laboratories, but is possible with the help of specialist lipid laboratories. In the UK, there is a network of six laboratories in the Supra-Regional Assay Service for Cardiovascular Biomarkers (
Similarly to apoAI and apoB, apoAII, apoCII, apoCIII and apoE (see below) were historically measured by radial immunodiffusion, radioimmunoassay and electroimmunoassay. 125 Today, measurements of these apolipoproteins are mostly used for research purposes. Many research laboratories use sodium dodecyl sulphate-polyacrylamide gel electrophoresis (SDS-PAGE). However, for quantitation, ELISA, immunonephelometry and imunoturbidimetry are the methods of choice. Turbidimetric assay of apoCIII is affected by storage (freezing). There are currently no reference methods or standards available; therefore, it is difficult to compare values between different populations and studies. Again, it is important that every laboratory establishes its own reference ranges, as those quoted in the technical data sheet may refer to a different population.
Methods of assessment of postprandial metabolism
The difficulty in the assessment of postprandial metabolism has been a relatively complex methodology. Measurement of chylomicrons has been notoriously difficult because of their short lifespan and necessity to differentiate them from the VLDL particles. Differentiating between chylomicron remnants and VLDL remnants is also difficult. Two methodologies can be considered here: measurements of apoB48 and of the remnant-like particles (RLP).
Conventional methods of chylomicron assessment involve ultracentrifugation: they are separated as particles with density below 1.006 kg/L. This can be combined with separation of apoB48 by PAGE. Chylomicrons can also be measured (without ultracentrifugation) in whole plasma by SDS-PAGE, followed by measurement of apoB48 using immunoblotting with anti-apoB48 antiserum and ELISA assays. 126 There are, however, problems with sample stability and preparation, and the method is technically difficult and time-consuming. 127 In the last few years, highly sensitive ELISA assays became commercially available for accurate measures of apoB48. 128 However, these assays have not been standardized.
Methods of measurement of the remnant particles
Remnant lipoproteins include chylomicron and VLDL remnants. 129 It is generally accepted that remnant lipoproteins are an apoE-rich fraction within TG-rich lipoproteins. Their short half-life has hampered the development of detection methods.
Currently, two commercially available assays are available. Both isolate lipoprotein fractions that are cholesteryl ester- and apoE-rich, and are sensitive to freeze-thawing and long-term storage. The assay for RLP-cholesterol (RLP-C) has been in use in the USA since 1993. In this assay, two monospecific monoclonal antibodies to apoB100 and apoAI are coupled to Sepharose 4B. These antibodies do not recognize apoE. After the non-remnant fraction is bound by the immunoaffinity gel, the fractions are separated either by low speed ultracentrifugation or by shaking, and RLP-C (or TG) can be measured in the unbound fraction. 130–132 Cholesterol can be measured by conventional means in a clinical chemistry analyser. Using this assay, RLP-C has been reported to be an independent risk factor in the Framingham Study. 133 RLP were also elevated in obesity, 134 insulin resistance, 135 and in patients with diabetes and CVD. 136
However, it has not been adopted widely into routine clinical biochemistry laboratories due to the manipulations required for the affinity gel pretreatment.
A homogeneous assay for remnant lipoprotein cholesterol (RemL-C) has been developed. The method uses a detergent (polyoxyethylene-polyoxybutylene block co-polymer, POE- POB) which specifically modifies VLDL remnants and IDL, and phospholipase D which modifies chylomicron remnants. This treatment makes cholesterol contained in these lipoproteins (but not in other lipoprotein particles) available to cholesterol esterase and cholesterol oxidase.
The assay allowed the measurements of cholesterol in chylomicron remnants, VLDL remnants and IDL with no sample pretreatment. 137 Within the last few years, an automated RemL-C assay has become available, which may be used in routine clinical chemical analysers. 138
The two assays have been compared and show significant correlations, although RemL-C values tend to be higher than RLP-C. The RemL-C assay was found to be more closely associated with VLDL2 and IDL than the immunoseparation RLP assay. 138,139 It has been suggested that the discrepancies arise because RLP values poorly reflect the smaller size remnants (IDL). Significantly higher correlations have been observed between plasma TG and RLP postprandially, when compared with the fasting state. 140 This has not been shown yet for RemL-C. Schaeffer 141 recently commented on limitations of the RemL-C assay. He reported that RemL-C was not a predictor of CHD risk in the Framingham Offspring Study cohort, either prospectively or on a case-control basis. Furthermore, there was a strong correlation with TG (r = 0.93, P < 0.001). The correlation between RLP-C and TG was lower (r = 0.79, P < 0.001) and RLP-C was found to be an independent risk factor. 133 On the other hand, the Rem-L assay may be useful in identifying patients with increased IDL concentrations. More studies need to be carried out to establish the association of RemL-C with CHD risk.
The methods for assessment of postprandial metabolism were reviewed by Su et al. 46 They also include the measurements of retinyl esters, kinetic studies using chylomicron-like emulsions and 13C breath tests. The authors suggested that postprandial lipaemia might be best assessed using a combination of either serial TG measurements in response to a standard fat load or day-long capillary TG measurements, with apoB48 quantitation by the ELISA method.
Apolipoprotein E isoforms: phenotyping and genotyping
Phenotyping
Initially, detection of apoE polymorphisms was performed by measuring relevant proteins. 142 The three isoforms were separated by isoelectric focusing, followed by transfer to nitrocellulose by Western blotting. The individual apoE bands were visualized using monoclonal or polyclonal antibodies to apoE, 143 or direct immunofixation. 144
The separation patterns are attributable to the variations in charge. Usually migration toward the anode is faster for the E2 isoform (Cys112/Cys158) than the E3 (Cys112/Arg158) and E4 isoforms (Arg112/Arg158) because arginine has a positive charge and cysteine is uncharged. However, factors such as post-translational modifications can affect the results of apoE phenotyping. A typical Western blot showing common ApoE isoforms is shown in Figure 5.
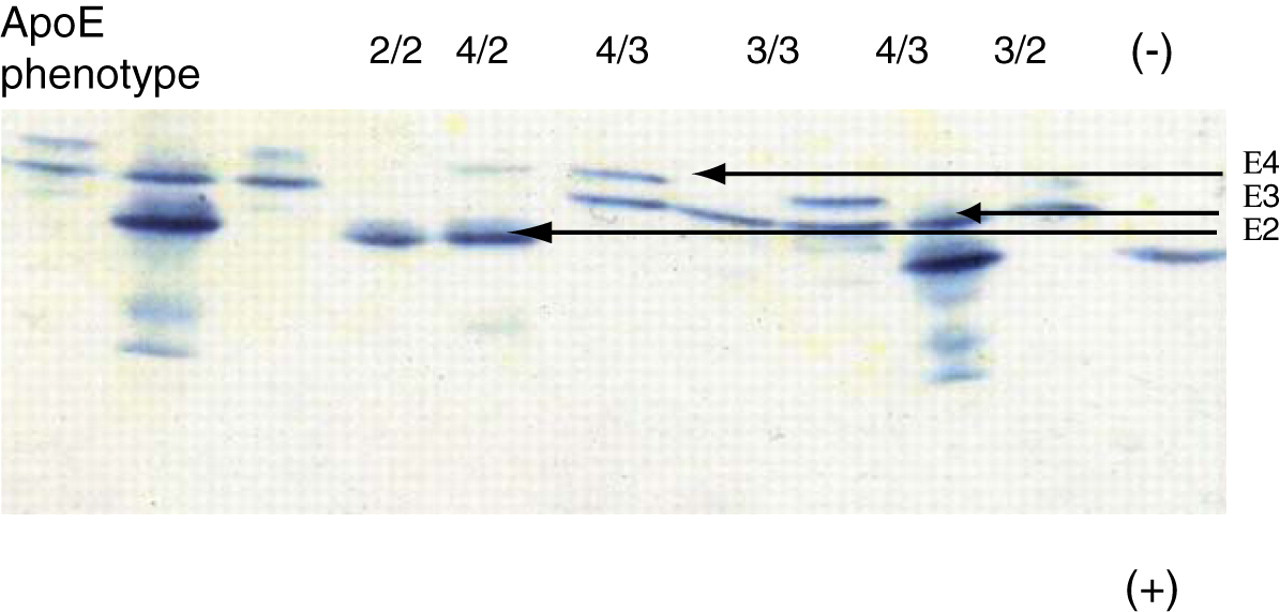
Typical Western blot showing common apoE isoforms. The order of migration towards the anode is E2 > E3 > E4
Genotyping
Today, as most laboratories have access to molecular techniques and automated equipment, apoE isoforms are detected by genotyping. DNA is subjected to polymerase chain reaction using apoE primers. After digestion by nucleases (HhaI endonuclease), 145 fragments are separated on polyacrylamide gels. Genotyping can be performed on whole blood. Capillary gel electrophoresis can also be used. 146
There are ethical issues associated with detection of the ϵ4/ϵ4 genotype due to its association with AD. Arguably, the result of genotyping by a lipid laboratory should be reported as ‘consistent (or not consistent) with familial dyslipidaemia’. 2,147
Phenotype–genotype non-concordance has been repeatedly reported. This could be a result of post-translational modification of the protein, such as glycation in subjects with diabetes, or could be due to mutations in the apoE gene resulting in protein variants, which affect the charge of amino acids, and thus migration on the isofocusing gel. However, not all mutations would lead to functional differences in apoE. It is important to remember that the reaction of apoE with the LDL receptor family is dependent on a positive charge at apoE residues 130–150, and that interaction with arterial wall proteoglycans depends on the alpha-helical character of the carboxy-terminal of apoE, which contains the heparin-binding domain. We suggest that apoE phenotyping still has a role to play in the identification of individuals at risk for dyslipidaemia when mutations in the apoE gene are identified. 148
Measurement of apolipoprotein E in plasma
To date, research into apoE has concentrated on the investigation of isoforms rather than plasma concentration of apoE. Variation in the plasma concentration of apoE is to a large extent genetically determined. 70 ApoE2 individuals have higher plasma levels due to slower clearance of lipoprotein particles, and apoE concentrations in E4 individuals are lower as a result of more efficient clearance. However, within each genotype there is individual variation in apoE concentration. Plasma apoE concentrations are also affected by diet. Plasma apoE can be measured by sandwich ELISA assay, 149 and by more labour-intensive electroimmunoassay. 150
Schiele et al. 150 developed extensive reference ranges for plasma apoE, studying the French Stanislas Cohort. In this study, apoE was measured by electroimmunoassay. Total plasma apoE concentration, as well as its concentrations in non-apoB and apoB-containing fractions, were affected by age, gender, the common apoE polymorphisms, puberty, serum lipid concentrations and alcohol consumption. It was suggested that the concentration of apoE in apoB-containing lipoproteins (remnants) is more informative than the total plasma apoE.
Interesting data on plasma concentration of apoE came from research on AD. Van Vliet et al. 151 assessed the risk of late-onset AD in a study of middle aged children of persons with AD (mean age 49.8 and 51.6 years in the AD group and control group, respectively). They found, not surprisingly, that individuals with parental history of AD were more likely to be ε4 allele carriers. Interestingly, mean plasma apoE concentration decreased from ϵ2 to ϵ3ϵ3 to ϵ4 carriers. Individuals with parental history of AD had lower plasma apoE concentrations than individuals without such history.
There is no clear evidence at present to suggest that apoE concentration should be measured routinely, although it may have a place in the elderly. Whereas the association between the apoE genotype and CVD is well documented, the risk associated with circulating apoE concentration is not known. In a study of 85-year-old individuals, it was observed that those with high levels of apoE were at an increased risk of cardiovascular death, independent of their apoE genotype. 149
The reason for limited use of plasma measurements might be the distribution of apoE across lipoprotein subfractions, including HDL. Consequently, it is relatively difficult to explain changes in its total plasma concentration, although the decreased clearance of TG-rich lipoproteins remains a dominant cause of increased concentration.
Measurement of lipoprotein (a)
The size variation of the number of apo(a) kringles challenges the measurement of Lp(a) by immunochemical methods. Problems arise in the choice of apo(a) size as the assay calibrator and the reactivity of antibodies directed to different kringle sizes. As a result, assays either underestimate or overestimate the quantity of circulating Lp(a).
The IFCC led the development of an international reference material intended for the transfer of an Lp(a) concentration to manufacturers' master calibrators (IFCC Standard Reference Material, SRM2B). The assigned value is traceable to the consensus reference method for Lp(a). The proposed reference material was tested in the year 2000. When used as a calibrator, no uniformity of results was achieved for isoform-sensitive methods. 152 Currently, the only commercially available assay that is not affected by kringle IV type-2 repeats is the one used to measure Lp(a) in the Women's Health Study. 74,153 The authors recommend that this be the assay of choice.
Concentration of apolipoproteins in different lipoprotein subfractions
Apolipoprotein concentration in specific lipoprotein fractions might be a good marker of CVD risk, although such measurements are not suitable for routine use. Combining lipoprotein separation and apolipoprotein measurements yielded particularly interesting results in the Cholesterol and Recurrent Events (CARE) trial. 154 CARE was a study of pravastatin treatment in 4159 patients with a history of acute MI and a five-year follow-up. VLDL-apoB, VLDL-C and VLDL-TG were identified as predictors of recurrent coronary events. VLDL-apoB (but not VLDL-C) was a strong predictor (with RR 3.2 between the lowest and highest quintile). The RR for LDL-C was 1.7 and HDL-C and plasma TG were not significant predictors. ApoCII in VLDL-plus-LDL was a strong predictor with RR 2.25, as was the apoE in HDL, with univariate RR 2.05. Risk associated with TG was explained by VLDL-apoB and the sum of apoCIII concentrations in VLDL and LDL. In other studies, the sum of apoCIII in VLDL and LDL was also increased in survivors of MI. 155
ApoE in the plasma or its concentration in VLDL-plus-LDL was associated with atherosclerosis – maybe only as a marker of apoCIII. HDL-apoE identified patients who underwent coronary artery bypass grafting. 156
The measurements of apolipoproteins in lipid subfractions emphasize one important point: the relative crudeness of routinely used tests such as TC and in particular TG in relation to CVD risk. Measurement of apolipoproteins in lipid subfractions appears to be a more specific marker of risk. However, there is a major methodological barrier – the extra step of lipoprotein separation. It is therefore unlikely that such methods will be used outside research laboratories.
The future
In the era of the ‘omics’, rapid advances are being made in the detection and quantitation of biomarkers. Mass spectrometry has the potential to detect multiple proteins in a small volume of sample at a high throughput rate. Such an application for apolipoproteins has been reported using ultra-performance liquid chromatography/tandem mass spectrometry. 157 This showed results for apoAI that were comparable with those obtained in a clinical analyser and were generated in a fraction of the time. There are hurdles to overcome such as standardization, but this technique has the potential to revolutionize the future analysis of apolipoproteins. Superko 158 and Mora 159 have recently discussed, in an interesting format, the potential applications of a wide range of biomarkers of lipid metabolism.
Conclusions: apolipoprotein measurements in the clinical biochemistry laboratories
The most important use of apolipoprotein measurements in clinical biochemistry is as markers of cardiovascular risk. The inclusion of apoB and apoAI measurements in the assessment of risk along with LDL-C has been recommended by a number of professional bodies. We therefore suggest that specialist laboratories introduce apoAI and apoB measurements, and lead the introduction of these assays to a wider routine service. Delaying this may create a knowledge gap between day-to-day clinical practice and international consensus.
Measurement of Lp(a) is also an important adjunct to risk assessment. Because of the stability of its concentration over time, its measurement can be limited to the initial assessment of risk.
Genotyping of apolipoprotein E is important in the diagnosis of familial dyslipidaemia.
There is increasing recognition that postprandial metabolism is important in atherogenesis, particularly in the context of obesity, insulin resistance and diabetes.
This is probably the most important emerging area in the field of lipoprotein metabolism, and it increases the need for better markers of the fuel transport pathway. Currently, the measurements of apoB48 and measurements of remnant particle cholesterol have been the most promising markers.
Finally, the assessment of cardiovascular risk is by definition multifactorial. Assessments of both lipid and non-lipid CVD risk factors carry a degree of uncertainty. This is due to methodological issues, to difficulties in precise definition of a given risk factor's severity (e.g. family history) or to the application of binary assessments to continuous variables (diabetes, blood pressure, smoking, definition of metabolic syndrome). Therefore, the compilation of a multifactorial risk profile remains essential.
DECLARATIONS