
Abstract
Background
Diagnosis of subarachnoid haemorrhage (SAH) is firstly based on imaging and secondly on spectrophotometry. Bilirubin may be detected in the cerebrospinal fluid (CSF) for up to two weeks after SAH. CSF pigment analysis is commonly performed according to the Chalmers manual technique but may be prone to operator error. We propose an online software solution, based on the United Kingdom National External Quality Assessment Service (UKNEQAS) recommendations, to support the interpretation of CSF pigment analysis.
Methods
Based on the manual Chalmers technique, we have developed a web application (in Personal Home Page language including JpGraph module and an Oracle database®) that enables the calculation of net oxyhaemoglobin absorbance and net bilirubin absorbance. It uses data from the CSF spectrophotometry, CSF and serum protein concentrations, and serum bilirubin concentration to provide an interpretation based on the NEQAS decision tree. The application was retrospectively validated using the spectra from 350 patients, previously analysed by the manual method.
Results
In total, 91.1% interpretations from spectra analysed with the web application were in accordance with the results obtained manually. The 8.9% discordant results were mostly related to an incorrect interpretation using the manual technique.
Conclusions
The software developed in our laboratory to interpret CSF pigment analysis results is a precise, robust and useful tool that allows reproducible conclusions to be drawn. This software is available through a web interface.
Introduction
For patients presenting to the Emergency Department with symptoms suggestive of subarachnoid haemorrhage (SAH), it is crucially important to detect evidence of the bleed. If the diagnosis is initially missed, patients who have bled will often present with a further bleed, the outcome of which may be dramatically worse than for patients in whom a prompt and correct diagnosis has been made. 1
This diagnosis is based firstly on imaging: computed tomography (CT) scan or magnetic resonance imaging (MRI) and secondly on cerebrospinal fluid (CSF) pigment detection. 2 CT scan is the most useful tool in the very early hours following the event for the detection of haemorrhage; within the first 10 h, it has a sensitivity close to 100%, 3,4 especially with modern CT scan techniques. CT sensitivity remains excellent during the first two days after the bleed but decreases to 50% after one week and to less than 10% after two weeks. 5 CSF pigment analysis, on the other hand, is highly sensitive for the detection of bilirubin (70%) for up to two weeks, although it may not be detected in the first 10 h following a bleed. 6
In the 10 h following the bleed, rapid red blood cell lysis (a consequence of the low CSF osmolarity) leads to the appearance in the CSF of oxyhaemoglobin (OHb), which is then converted in vivo into bilirubin and methaemoglobin. Bilirubin is the pigment of interest because it is the only one produced by the in vivo degradation of haemoglobin. 7 A traumatic lumbar puncture may result in contamination of CSF with erythrocytes and their subsequent lysis will result in the presence of haemoglobin (but not bilirubin) in the sample. This underlines the overriding importance of preanalytical considerations. 8 Some authors have suggested the direct measurement of total bilirubin in CSF. 9,10 However, the presence or absence of visible xanthochromia has also long been used to detect bilirubin in CSF and remains in standard use in North American countries, 11 but it has been demonstrated that the human eye is neither very reliable nor very sensitive for its detection. 12,13
United Kingdom National External Quality Assessment Service (UKNEQAS) guidelines 8,14 propose spectrophotometry as the standard method of CSF analysis in a suspected SAH, even though some authors consider that visual evaluation of xanthochromia is useful or even better than spectrophotometry because of the false-positive rate of the latter. 15,16
Chalmers and Kiley 17 proposed a manual technique, revised in 2001, 18 to analyse the CSF spectrum obtained by visible spectrophotometry between 360 and 800 nm with computation of net oxyhaemoglobin absorbance (NOA) at 415 nm and net bilirubin absorbance (NBA) at 476 nm above the tangential baseline. Measurement of CSF protein concentration, serum total protein and serum bilirubin is also required. 8 These parameters allow calculation of the predicted absorbance (PA) of the CSF in the event of elevated serum bilirubin that might otherwise give a false-positive result.
When drawn manually, the slope of the tangent line to the spectrum may vary with operator experience. Indeed, within-operator imprecision has been demonstrated to be important for NBA values around the decision threshold. 19 As the absorbance thresholds established for interpretation of 0.02 absorbance units (AU) for OHb and 0.007 AU for bilirubin are quite low, 14 false-positive or false-negative conclusions may be inferred from manual drawing. Furthermore, manual drawing is relatively time-consuming. The use of an automated, software tool based on UKNEQAS guidelines might offer a more rapid and robust analysis and interpretation.
The purpose of this study was to develop a software application to analyse the spectrophotometric profiles of CSF pigments, to replace manual drawing and analysis in order to minimize variability between operators and to compare its performance to the manual method. The software will produce an interpretation of the findings based on the UKNEQAS (2008) decision algorithm. 14 Finally, this tool was designed on a web interface so that it could be available to laboratory scientists outside the host institution.
Materials and methods
Hitachi UV solutions 2.0 software connected to a Hitachi U-1800 spectrophotometer (Hitachi High-Technologies Corporation, Tokyo, Japan) was used to produce the spectra between 600 and 350 nm (data interval: 1 nm). Small volume glass absorption cuvettes (path length: 10 mm) were filled with a minimum of 400 μL of CSF sample after centrifugation (5 min, 8000 rpm). The data obtained were recorded in ‘.uds’ files, then uploaded to the web application in ‘.txt’ format.
The web application was developed for data processing, using Personal Home Page (PHP) tools as dynamic web language including the JpGraph library (Asial Corporation, Tokyo, Japan) and an Oracle Database® (Oracle Corporation Redwood Shores, CA, USA). This application is accessible on the Internet (
This application contains three modules, input module, calculation module and output module, described below:
The input module allows the end-users to upload input data through an online form or use default values if necessary (0.3 g/L for CSF protein, 9 μmol/L for serum bilirubin and 70 g/L for serum protein). Input data are:
Data imported from the spectrophotometer software; CSF protein (pyrogallol red); Serum bilirubin (diazo) and protein (Biuret) from a simultaneously drawn blood sample. The calculation algorithm is based on the Chalmers method.
18
The different steps are:
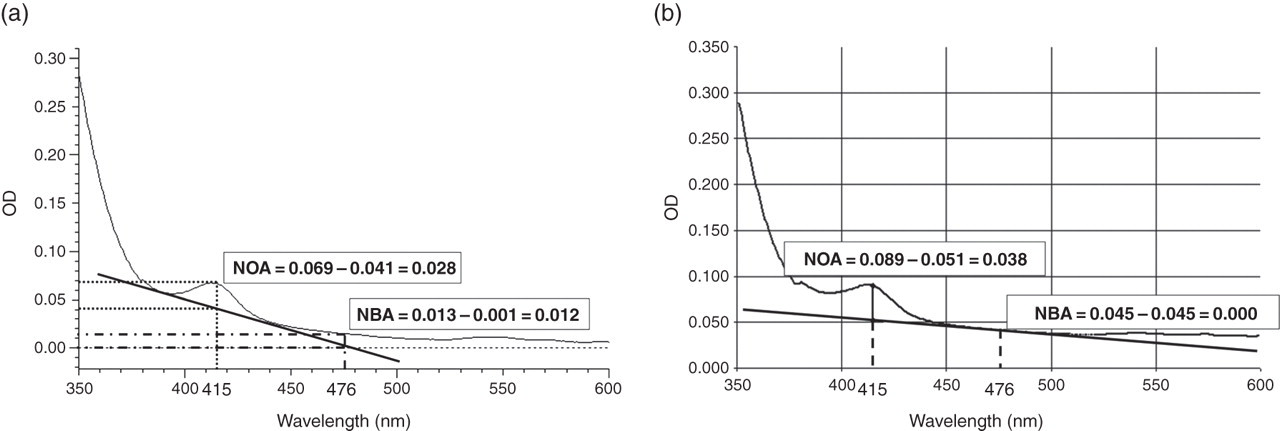
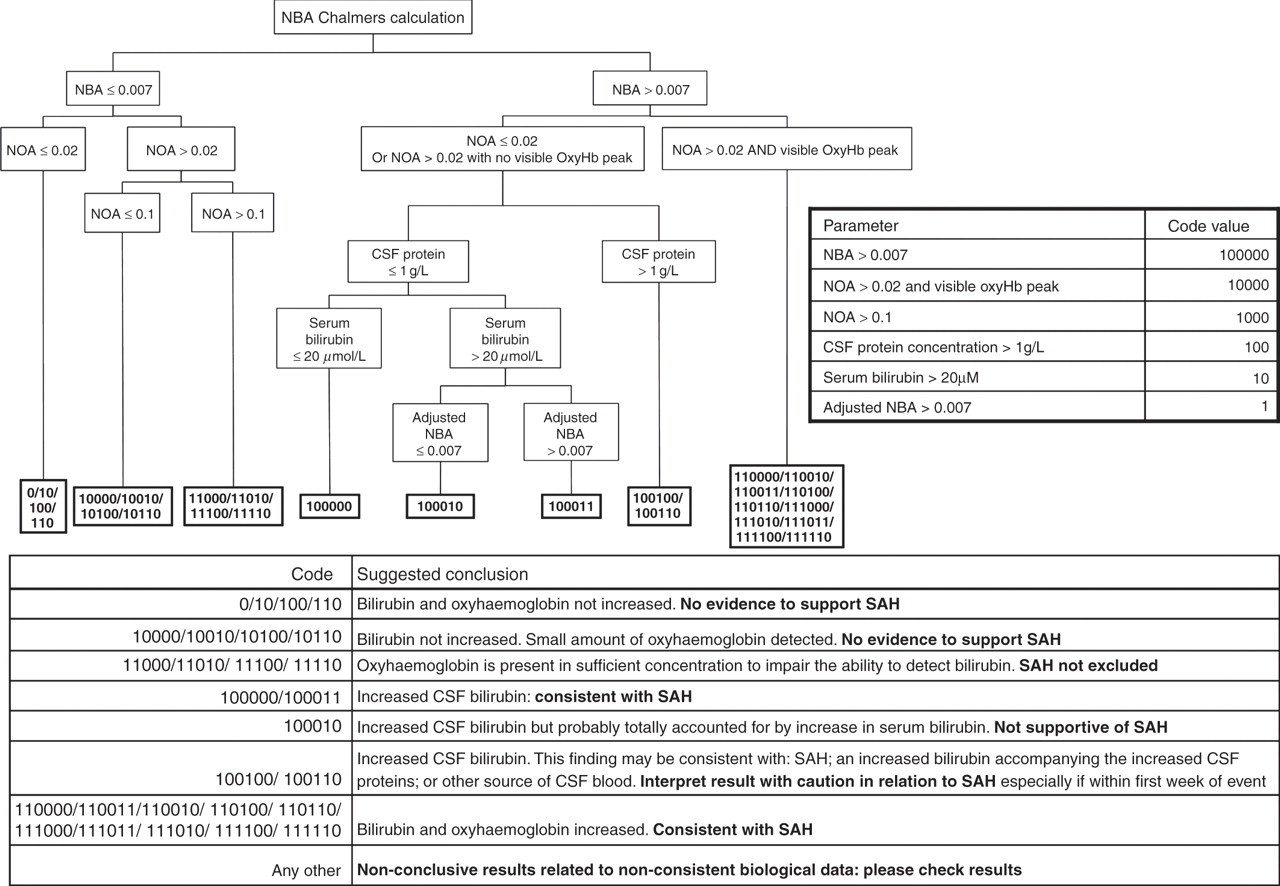
Calculation of the average absorbance data on three consecutive wavelengths of the spectrum; Calculation of the tangent line equation from the two inflexion points of the spectrum. According to the Chalmers method, the first inflexion point should be located between 353 and 400 nm; the second between 450 and 550 nm. To avoid false-positives, it was necessary to extend the search for inflexion points on both sides of 476 nm. For this, we extended the first interval (353–400 nm) up to 353–473 nm so that the first inflexion point can be found even with normal profiles (Figure 1), without generating false-positive NBA. The second interval was moved from 479 nm to 550 nm; Determination of the net absorbance at 415 and 476 nm by subtracting the tangent line absorbance from the spectrum averaged absorbance; Integration of all parameter values comprising the decision-making algorithm. A binary ‘barcode’ was then established based on six different parameters: NBA > 0.007 AU, NOA > 0.02 AU or visible NOA peak, NOA > 0.1 AU, CSF protein > 1 g/L, serum bilirubin > 20 µmol/L and adjusted NBA > 0.007 AU (if the parameter condition is true, a ‘1’ score is given, ‘0’ if not) allowing 64 possible combinations; The ‘visible’ NOA peak corresponds mathematically to both a positive secondary derivative of the CSF spectrum between 405 and 435 nm and to an NOA (415 nm) value above 0.02 AU. Effectively, the NOA > 0.02 AU alone is not sufficiently specific to characterize an OHb peak: for example, significant amounts of bilirubin could create a large peak that would increase the NBA and also the NOA without a real OHb peak. As the CSF profile slope is increased by the presence of OHb, the secondary derivative should turn positive in this interval for at least one or more consecutive dots. Consequently, we added this secondary derivative parameter to the NOA in the OHb peak detection; As some combinations are not logical or not possible in physiological conditions (for example, NOA > 0.1 with NOA < 0.02, code 001000), only 27 combinations remained. Among these 27 remaining combinations, some were redundant, resulting in only seven real possible conclusions. Regarding the combination attributed to the tested sample, a suggested interpretation is given, based on the UKNEQAS decision tree (Figure 2). An eighth conclusion is of course available (‘inconclusive results related to inconsistent biological data: please check results’) when sample analysis results do not meet any possible combination of the algorithm. The output module provides a graphic display reproducing the patient spectrum and other biological data with the interpretation generated by the algorithm. Determination of the tangent line and net bilirubin absorbance (NBA) and net oxyhaemoglobin absorbance (NOA) calculation. (a) In the example below, according to the former technique, the first inflexion point of the spectrum was chosen between 353 and 400 nm and the second between 450 and 550 nm. Consequently, NBA calculation was higher than the 0.007 threshold, leading to a false-positive conclusion. (b) In our software, we enlarged the first interval from 353 to 473 nm and moved the second from 479 to 550 nm, allowing an adjustment around NBA and avoiding false-positive conclusions (the NBA for same sample is calculated at 0.000, negative) Decision tree for the interpretation of cerebrospinal fluid (CSF) pigment analysis. A six-number binary ‘barcode’ is established with six different parameters: net bilirubin absorbance (NBA) > 0.007, net oxyhaemoglobin absorbance (NOA) > 0.02 or visible NOA peak, NOA > 0.1, CSF protein concentration > 1 g/L, serum bilirubin > 20 µmol/L and adjusted NBA > 0.007. If the parameter value is true, a score of ‘1’ is given, ‘0’ if not. There are 27 possible codes, leading to seven possible conclusions that are listed in the table below the figure. SAH, subarachnoid haemorrhage
Software validation was tested retrospectively in CSF spectrophotometric scans from 350 patients (mean age: 44 ± 19 y) obtained between 2007 and 2010 which had previously been analysed routinely using the manual method. The data from a further 99 patient spectrophotometry scans which were not available in electronic format were not included in the study.
Of the 350 spectrophotometric scans studied, the same data on CSF total protein, serum bilirubin and protein, if available, were used in both manual and software methods. In the case of missing data for CSF protein and serum bilirubin/protein, the same default values were assigned in both manual and software methods. Results and interpretations obtained by the manual and automated software methods were compared. In the case of discordant results, the clinical diagnosis was obtained from the patient's clinical file.
We prepared a control material with an expected NBA value of 0.008 AU at 476 nm and assessed spectrophotometer imprecision by measuring the absorbance of 20 replicates of this material. The purpose was to define the imprecision of the spectrophotometer used in validating the software and therefore allow external users of the interface to compare the imprecision of their own instruments.
Results
Our spectrophotometer (Hitachi U-1800) imprecision (coefficient of variation) was calculated at 5.7% for an expected NBA value of 0.008 AU at 476 nm.
The results obtained using the automated software on 350 spectrophotmetric scans were compared with those obtained by manual analysis (Figure 3). For 319 of the 350 scans (91.1%), there was complete concordance in results between the two methods.
Comparison of the results obtained with the software and the manual technique on the 350 spectrophotmetric scans. NBA, net bilirubin absorbance; NOA, net oxyhaemoglobin absorbance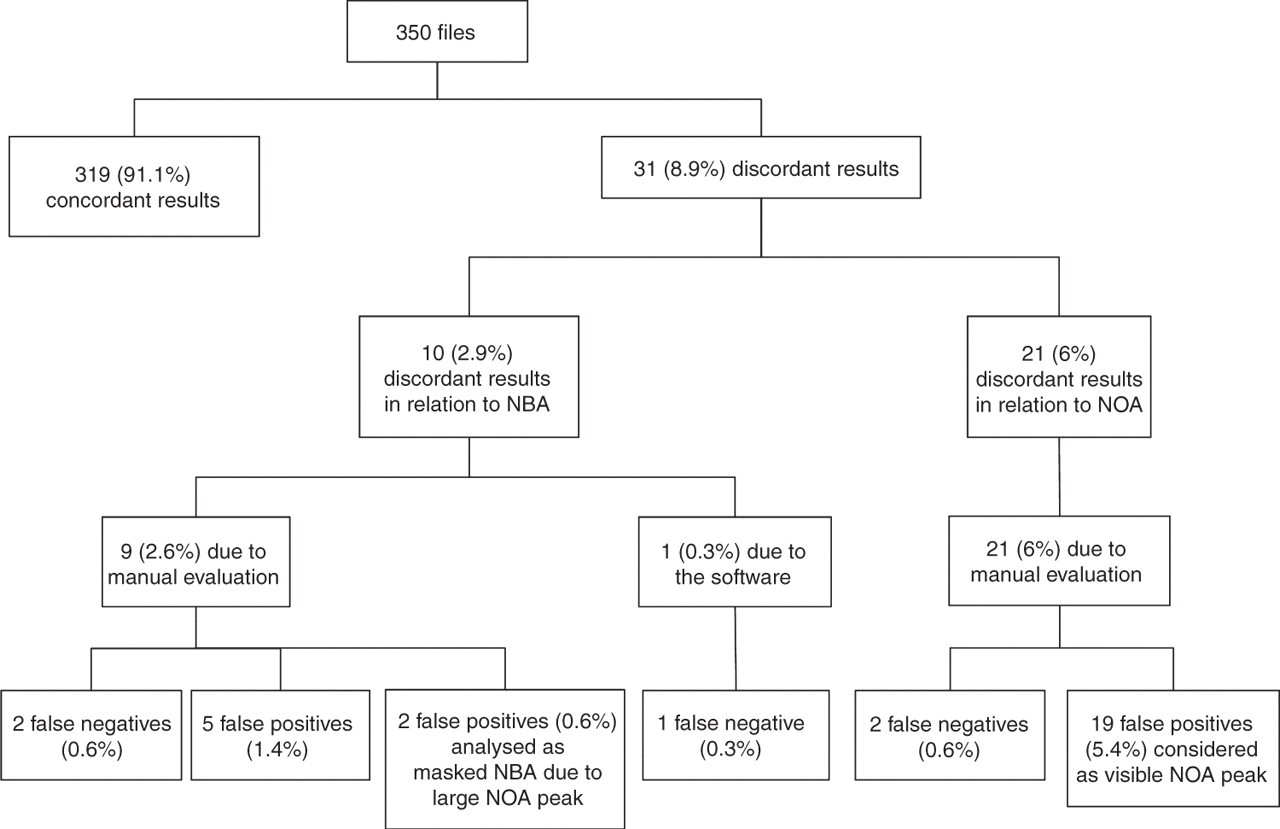
For the 31 (8.9%) spectrophotometric scans giving discordant results, 30 were related to incorrect results or interpretation obtained by the manual analysis. In only one case (0.3%) did the automated software give an incorrect interpretation, but this case was atypical in that it yielded a false-negative NBA result (0.0068 AU) in a sample obtained three weeks after the bleed, which had been diagnosed on the initial CT scan (the manual drawing method gave an NBA result above the threshold at 0.008 AU).
The automated software provided correct results as compared with manual analysis in nine (2.6%) scans relating to the presence or absence of bilirubin (seven false-positive and two false-negative). The ‘true’ result was assigned on the basis of visual re-assessment of the spectrophotometric results and review of the clinical file.
In addition, the automated software provided correct results as compared with manual analysis in 21 (6%) of scans relating to the presence or absence of OHb. The false-positive results for OHb obtained by manual analysis are explained by the fact that manual analysis used a 0.1 AU NOA threshold for the presence of an OHb peak in line with the UKNEQAS 2003 guidelines 8 However, some OHb peaks clearly visible on the spectrum but below 0.1 AU were reported as being present. The automated software used the 0.02 and 0.1 AU NOA thresholds proposed by the UKNEQAS 2008 guidelines 14 that categorize more clearly the amount of OHb present.
Discussion
Methods for CSF pigment analysis in suspected SAH have gradually evolved over the last 10 y. Chalmers and Kiley 17 and Chalmers 18 introduced CSF spectrum analysis, allowing an improved interpretation in comparison to the isolated measurement of spectrophotometric bilirubin absorbance.
When analysing CSF pigments manually, errors may occur, due to the drawing of the tangent line (operator variability), 19 particularly because of the very sensitive thresholds used for the detection of bilirubin. For this reason, diazo reagents were developed 9 to find an alternative automated method for bilirubin measurement. However, even though these simpler techniques are employed in some laboratories, they are not yet in widespread use and require further validation. Other markers (S100beta protein, 20 arginine vasopressin, 21 tumour necrosis factor alpha in interstitial brain fluid 22 ) have recently been developed but do not appear to be helpful in the diagnosis of SAH in emergency units, although they may have a prognostic role. CSF spectrophotometry therefore remains the most commonly used diagnostic laboratory test for SAH in the UK.
Guidelines produced by a UKNEQAS working group in 2003 and updated in 2008 advocate the use of CSF spectrophotometry (in conjunction with CSF protein concentration, serum bilirubin and protein concentrations) and provide recommendations for the reporting and interpretation of results. 8,14,23–25 These guidelines have helped considerably in CSF analysis.
Nevertheless, to apply these UKNEQAS recommendations in our laboratory and to try to avoid any additional mistakes arising from the manual technique, we developed a bioinformatics solution, based on the UKNEQAS 2008 guidelines to allow automation of CSF pigment analysis and to minimize errors related to manual analysis. This software (which is coupled with a web interface) uses data from the patient's CSF spectrophotometric scan along with the CSF protein concentration and the serum bilirubin and protein concentrations.
In line with the UKNEQAS recommendations and starting from raw data, we designed a PHP algorithm to draw automatically the tangent line and to calculate NBA and NOA from raw data. This means that interoperator variability eliminated, the only remaining variability is that related to spectrophotometer imprecision, assessed at 5.7% for our instrument. This imprecision will need to be assessed by each laboratory wishing to use our software and the most relevant target is the imprecision at the NBA cut-off of 0.007 AU at 476 nm.
This algorithm also produces an output figure listing all the relevant analyte values and the corresponding interpretation established from a six-parameter decision tree (Figure 4). Consequently, the operator can review how the algorithm arrived at the suggested interpretation.
Example of results generated by the software for cerebrospinal fluid (CSF) pigment analysis. The corresponding pdf file can be downloaded with the branch of the decision tree leading to the suggested interpretation highlighted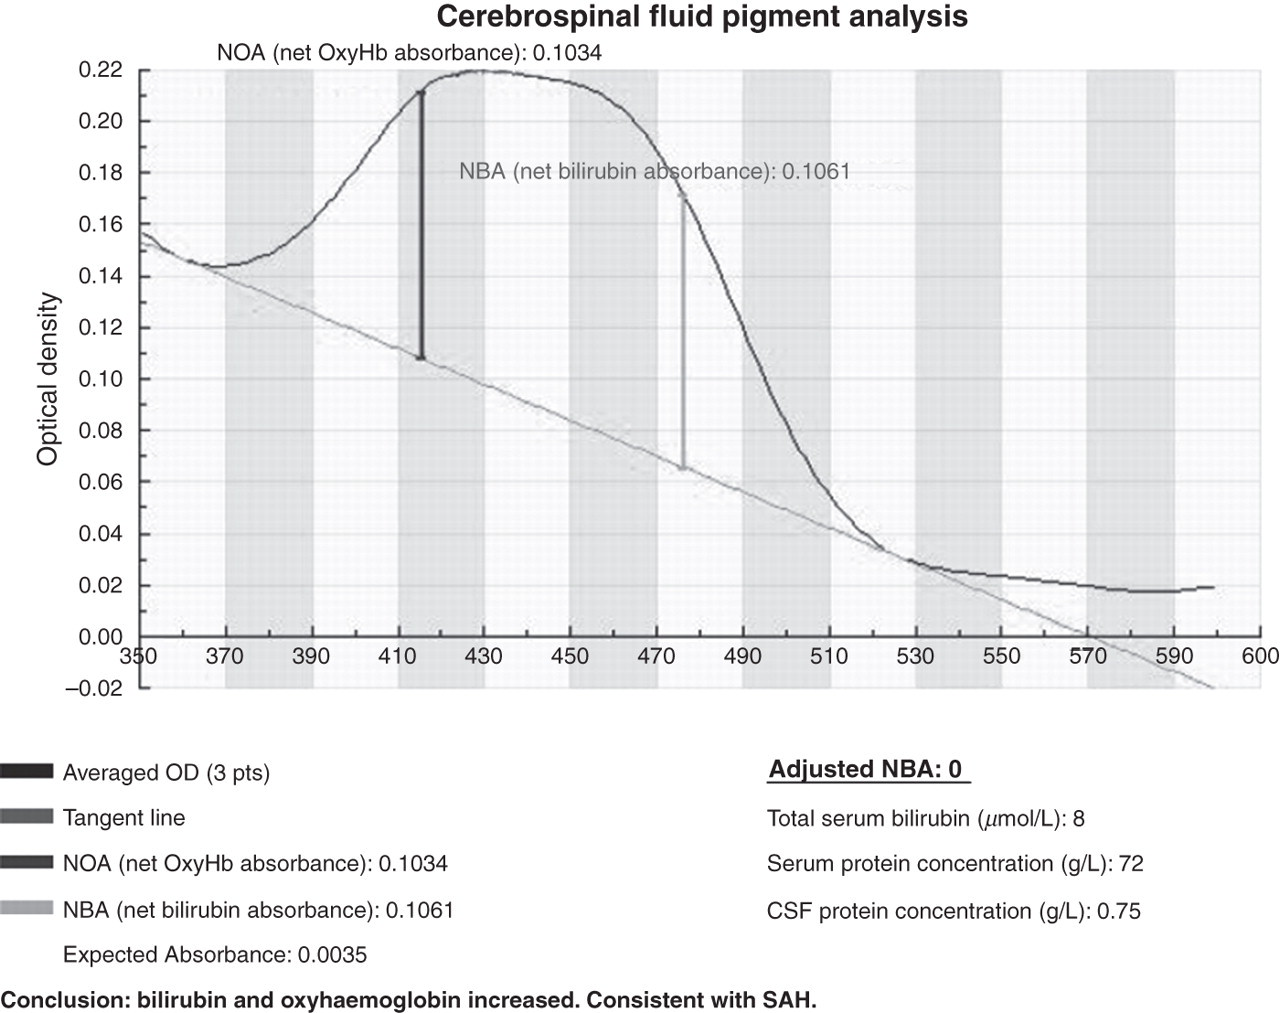
Our method is easier and faster than the time-consuming manual drawing technique. It is robust, even when used by new, inexperienced operators, leading to only one false-negative interpretation out of the 350 spectra studied and furthermore resulted in a revision of nine (2.6%) incorrect NBA results obtained by manual drawing. However, it must be stressed that bioinformatics software cannot correct for preanalytical errors. In such cases, the software and the manual technique would provide the same incorrect interpretation.
We reviewed the patient's clinical file related in the case of a false-negative NBA result obtained with the software (NBA < 0.007), which was not consistent either with the clinical diagnosis or with the result obtained by the manual technique. This patient had a typical SAH clinical history of onset three weeks prior to lumbar puncture (acute headache, CT showing slight hyperdensity in the Sylvian fissure); CSF samples were collected immediately prior to angiography, at which an aneurysm (still associated with vasospasm of the middle vertebral artery) was detected and treated. The NBA measured manually was 0.008 AU (positive) and only 0.0068 AU with the software (negative). This case incidentally demonstrates that the ability of CSF xanthochromia to diagnose SAH may be time-limited and lumbar puncture should be performed in the two-week window following onset of headache. On the other hand, the software enabled us to correct nine manual NBA misinterpretations, mostly true false-positives (2% of cases) confirmed by reviewing the clinical files in which there was nothing to support a diagnosis of SAH. The NBA results in these cases were close to the 0.007 AU threshold, which may explain the misinterpretation arising from manual analysis. The software also corrected two false-negative results obtained by the manual technique: the positive NBAs calculated with the software were associated with high OHb peaks that led to difficult manual interpretation due to overlapping OHb and bilirubin peaks and scale asymmetry between high OHb and relatively low bilirubin intensities. In both patients, an SAH diagnosis was clinically confirmed.
Our software also allowed improved accuracy in the detection of OHb, correcting 21 (6%) manual results. Some of these incorrect results were related to manual analysis undertaken before the introduction of the revised UKNEQAS 2008 guidelines which uses a 0.02 AU cut-off for OHb (in contrast to the software which incorporated the 2008 guidelines). 14 Most significantly, manual analyses occasionally reported small OHb in cases where the software calculated NOA was lower than 0.02 AU. Nevertheless, the risk of inappropriate clinical management as a result of misinterpretations of NOA is probably low compared with misinterpretations regarding NBA.
We did not undertake correlation of results with clinical outcomes in other cases as the primary aim of our study was to compare results obtained by the software and manual techniques.
The software described is available at a web interface (
It is important to stress that the software interpretation does not replace the need for visual inspection of the spectrophotometric profile. It should provide support for inexperienced staff in achieving a more accurate and reproducible interpretation. The diagnosis of SAH is based on the integration of clinical features, imaging results and CSF findings. We hope that the use of this software will enhance the contribution of CSF analysis in the diagnosis of SAH.
DECLARATIONS