
Abstract
We describe the programme of an established External Quality Assurance (EQA) provider and a Specialist Advisory Group (SAG) to develop a successful EQA scheme for cerebrospinal fluid (CSF) haem pigments as an example of a professionally led, unfunded initiative with the real potential to benefit patients.
Within three years, we had assured sample stability, stoichiometry, and published best practice guidelines, enabling both analytical results and interpretation to be assessed and reported with an educative summary of the desired responses. Misclassification scoring of analysis and interpretation was introduced. Following audit, guidelines were modified and republished. The outcomes were as follows:
Participant numbers increased from 63 at inception to 150 10 years later; The percentage of participants using visual inspection, a poor practice indicator, decreased from 27% to less than 1%; In all, 94–100% of participants consistently detected minor increases in bilirubin over the last four years of the scheme; More than 93% of participants were able to interpret analytical results linked to straightforward clinical scenarios; Misclassification scoring demonstrated that more complex scenarios repeatedly posed problems and is the next challenge to address.
Scheme success is attributed to the experience of the operator and the formation of a voluntary expert advisory group, with both concerned to advance science and patient safety and thus contribute unpaid time and effort in order to succeed. In times of fiscal constraint, such resource may not be so readily available, yet is a vital part of continuous quality improvement for the benefit of patients.
Introduction
Accurate early diagnosis of subarachnoid haemorrhage (SAH) is critical and analysis of cerebrospinal fluid (CSF) is an important part of ruling out SAH. 1 In 1989, The Lancet made recommendations, based on two contrasting articles, that where SAH is suspected yet the computed tomography scan is negative for blood, CSF should be centrifuged promptly and the supernatant should undergo spectrophotometric analysis if it appears clear to the naked eye. 2–4 At this time, the predominant method of CSF examination in the United Kingdom was by visual examination undertaken in microbiology laboratories as part of the standard cellular and microbial analysis. A few specialist laboratories may have been using spectrophotometry, first described for this purpose in 1955, and developed in the 1960s and 1970s in Europe prior to the advent of computerized tomography scanning. 5–7
Although some laboratories embraced spectrophotometry following this editorial, there remained uncertainty about the role of spectrophotometry and how the findings should be interpreted. 8 Thus, a number of those known to be interested proposed a working party to take the subject further. Dr A Milford Ward, Director of United Kingdom External Quality Assurance Scheme (UKNEQAS) for Immunology and Immunochemistry, ran a pilot EQA scheme for CSF total protein, immunoglobulin (Ig) G, albumin, glucose and lactate and offered to host the group. The first meeting of this ad hoc Advisory Group took place in June 2000, and from 2004, a formal Specialist Advisory Group (SAG) to the UKNEQAS for CSF Proteins and Biochemistry was established. This article describes the development of the UKNEQAS for haem pigments in CSF: the evolution of analytical samples suitable for quality assessment; the publication of recommendations for analysis and interpretation; the assessment of both analytical and interpretative elements, unlike most other EQA schemes; and the resulting dissemination of education and publications to the health-care community. This process of setting out to influence practice through the setting of standards using expert consensus and available evidence, guideline production, dissemination and review and the measurement of practice against them is that of the National Institute for Health and Clinical Excellence model. This is an iterative model, constantly refined. Standardization of practice is a prerequisite for measuring outcomes. We provide evidence of how this integrated approach to quality assessment, involving fundamental roles for the EQA provider, service users, advisory groups and professional bodies, has set the standards for the quality of service for patients, has been able to monitor the service and in some key areas has improved the quality.
An EQA is as much about education as performance; provided we could develop a ‘CSF’ material with adequate stability and link this with evidence to demonstrate the superiority of spectrophotometry, then this would form the basis of guidelines to inform best practice.
How the scheme developed is described below.
Make suitable samples and ensure they are stable and commutable
The production of samples was a challenge. Stable samples containing bilirubin, a known light-sensitive compound, were needed at concentrations of 200–2000 nmol/L, well below those usually encountered in quality assessment schemes for serum bilirubin. Over the period 2000–2002, both commercial and in-house stock bilirubin solutions were use to prepare the desired concentrations which were assessed for stoichiometry and stability. Diluted lysed fresh human blood provided oxyhaemoglobin.
Samples derived from the in-house solution demonstrated lack of stoichiometry. From mid-2002, a commercial bilirubin control was used for the stock solution. Recovery as indicated by the net bilirubin absorbance (NBA) was now satisfactory at greater than 90% for the years 2003–2004 (Figure 1). Further experiments demonstrated that addition of ascorbate overcame a previous instability of bilirubin in samples so that these were now stable for 72 h in the dark at room temperature, allowing for transit in the post. A frequency distribution of NBA values returned by participants for a sample shows a nearly Gaussian distribution (Figure 2), supportive evidence for bilirubin stability.
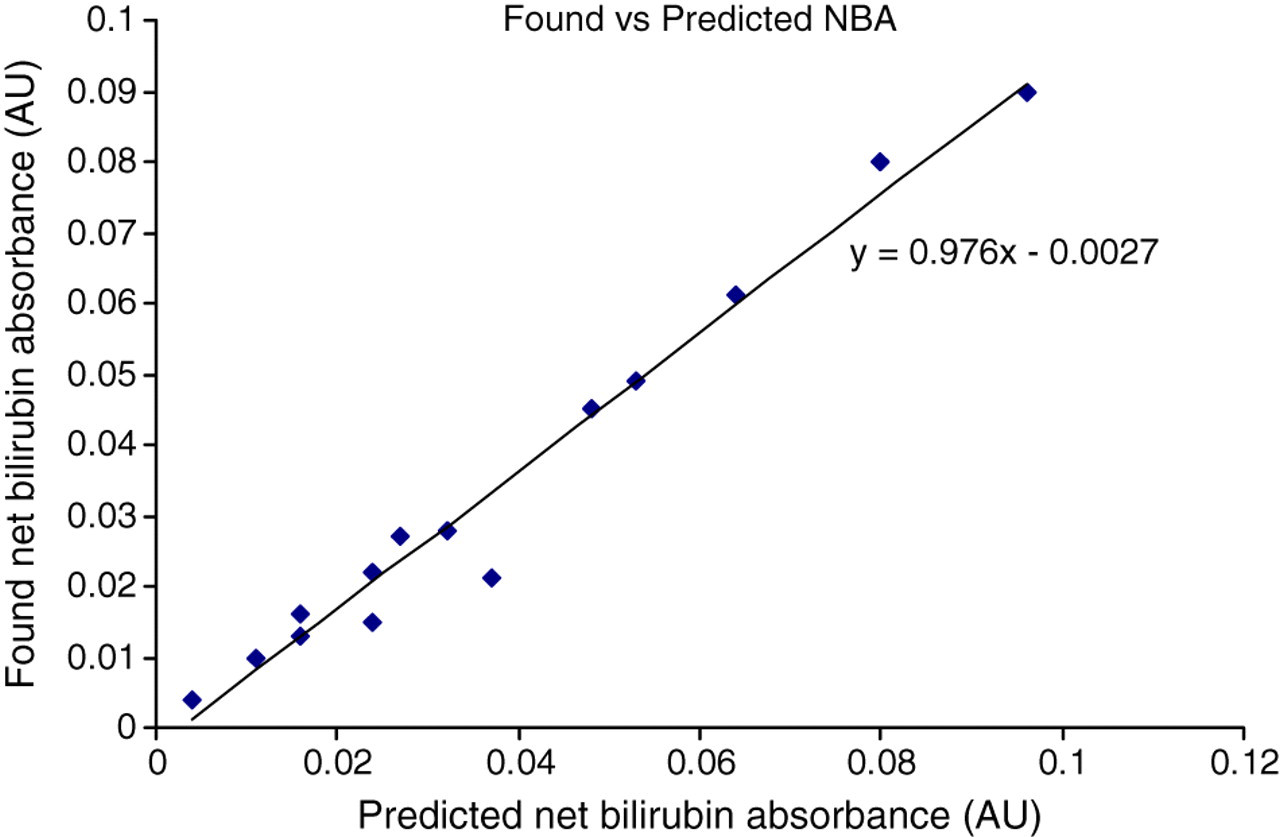
Recovery of added bilirubin to External Quality Assurance samples as demonstrated by mean net bilirubin absorbance (NBA) returned by participants (ordinate) plotted against the predicted NBA of the sample derived from the known concentration of bilirubin in the sample (abscissa)
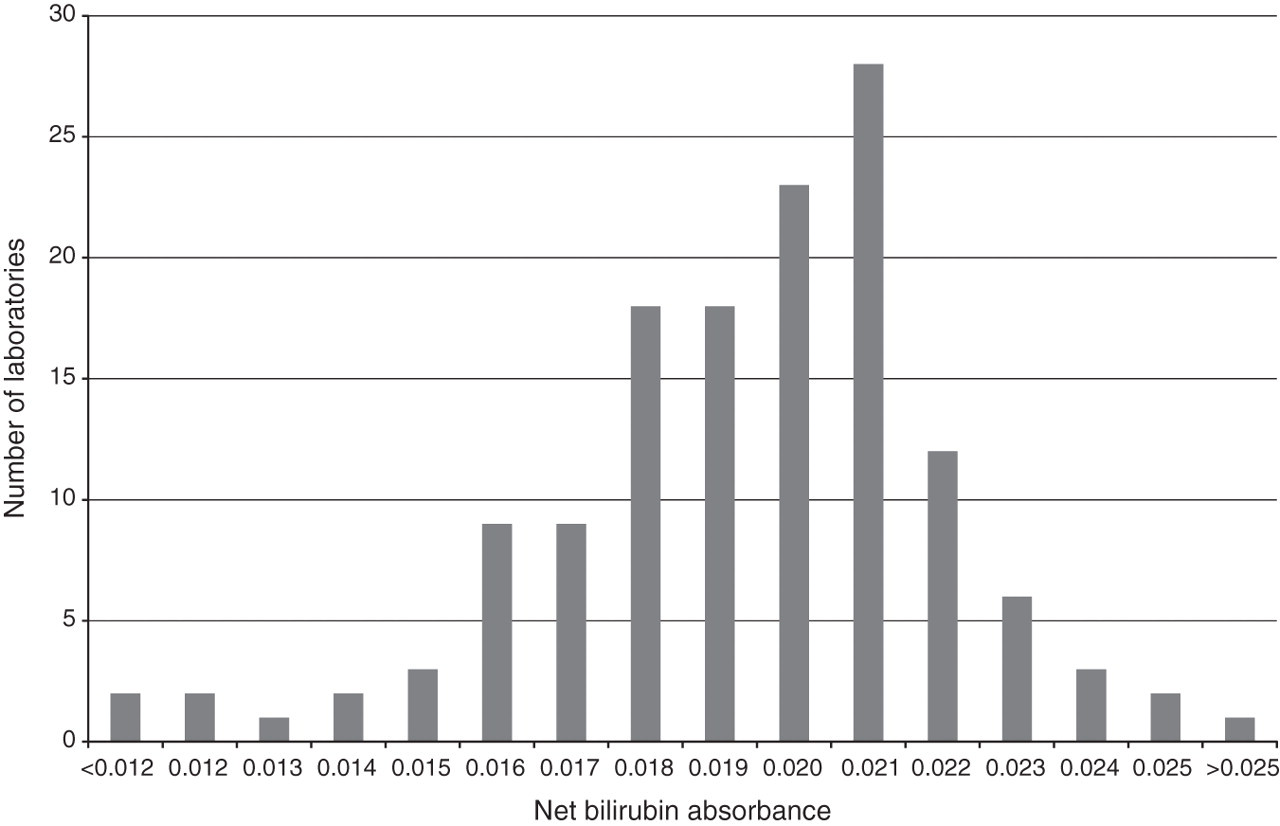
Distribution of reported net bilirubin absorbance in an External Quality Assurance sample
Material containing haem pigments was first distributed in late 2000 (Distribution 002) in brown bottles and from then on six distributions, each containing two samples, were made each year.
By the end of 2002, after less than three years of evolution, the final sample composition was arrived at, and provided a stable basis on which analytical and later interpretative scoring could be carried out.
Enhance best practice by guideline development
From the outset, it was clear that one of the functions of the SAG was to prepare and disseminate best practice guidelines. This need was reinforced by responses from a questionnaire sent to participants with Distribution 003 (October 2000).
The guidelines were prepared utilizing comprehensive literature searches, review of existing guidelines and audit from: the All Wales Audit Group and the Northern Ireland Audit Group; an existing protocol for CSF collection; and a retrospective review of outcome following a total of 740 spectrophotometric scans collected from four EQA participating centres. This first set of guidelines was posted on the Immunology Quality Assurance Scheme (IMMQAS) website and circulated to participants in August 2001, just 14 months after the first SAG meeting.
The guidelines covered: specimen requirements, transport and handling, analysis, reporting and interpretation. A flow diagram of analysis and interpretation was incorporated. Notes that explained the rationale for some of the guidance were incorporated for feedback. Appendices provided a protocol for collection, handling and transport, the determination of NBA and exemplar spectrophotometric scans of five key patterns.
In particular, transport by pneumatic tube was not recommended following evidence that such transport caused an increase in haemolysis if red cells were present in the sample. 9 The sample should be protected from light at all stages of the pre-analytical process after experiments confirmed the lability of bilirubin in natural light. Zero-order spectrophotometry between 360 and 600 nm was recommended, with NBA determined according to the simplified method of Chalmers 10 after confirming on 58 CSF samples that this simplified method yielded answers that were not significantly different from those of the original method. 11 There had been considerable debate (which continued over the years) about the merits of derivative spectrophotometry, but this was thought to be too complex for everyday service use. The retrospective audit carried out as part of the guideline development clearly emphasized the need to classify a NBA of >0.007 absorbance units (AU) as abnormal rather than have an equivocal range of 0.010–0.015 AU as originally recommended. This was because the audit revealed four cases of proven ruptured aneurysms with NBA of ≤0.015 AU. 12 The NBA was to be corrected if the serum bilirubin was ≥20 μmol/L, a point giving rise to much subsequent discussion from participants and the SAG. Oxyhaemoglobin occurring without bilirubin was not to be reported as it was thought to be evidence that did not support SAH. The introduction clearly stated that visual inspection was not reliable, based on early EQA returns indicating that visual inspection was unable to detect xanthochromia while spectrophotometry clearly did.
The existence of guidelines was disseminated on The Association for Clinical Biochemistry (ACB) mail base, The Royal College of Physicians Stroke Group website, the IMMQAS website and via an ACB meeting ‘Hot topics in Clinical Diagnosis’ held at St James' Hospital, Leeds in October 2001. The guidelines formed the basis of a participants' meeting with workshops held on June 2002.
Consult on the guidelines and modify where necessary
By December 2002, the SAG was able to consider many comments received in response to the first version of the guidelines and make considered modifications where necessary. A revised version was submitted to the Annals of Clinical Biochemistry via the Clinical Science Reviews Committee and was published in November 2003 12 and posted on the IMMQAS website two months later.
The published guidelines were modified from the initial set in three areas:
A net oxyhaemoglobin absorbance (NOA) was defined in order to quantitate the oxyhaemoglobin peak; It was recognized that an NOA ≥ 0.1 AU could mask a significant increase in NBA; Oxyhaemoglobin occurring without an increase in NBA was most likely to be artefactual, and therefore had a low probability in predicting SAH, but the pattern did not absolutely exclude SAH.
Audit the effect of guidelines over time (and add new knowledge)
In mid-2005, a review of the guidelines was started, prompted by results from a National Audit of CSF testing initiated by the SAG, 13 continual review of returns and correspondence which indicated where participants had problems. Comments were sought from all participants. Amendments were finalized in December 2007 and the amended guidelines were published in May 2008, together with an editorial which highlighted the reason for the changes. 14,15 In brief, these revisions emphasized that:
CSF was precious material and, apart from receiving an insufficient volume of sample, there was no other reason to reject a sample for analysis;
A NOA of <0.02 AU was defined as negative for oxyhaemoglobin (this had been recommended in interpretative reports since March 2005);
A result of a NOA < 0.1 AU with a NBA ≤0.007 AU was now to be interpreted as no evidence to support SAH;
Samples with both an increased bilirubin and a positive oxyhaemoglobin be interpreted as being consistent with SAH, irrespective of the serum bilirubin or CSF total protein.
Keep abreast of new developments
In a separate development, four members of the group carried out a study to determine if CSF ferritin would provide superior sensitivity and specificity to bilirubin, following an initial report of increased CSF ferritin in SAH. 16 This study, published in 2008, demonstrated that ferritin did not provide superior efficiency. 17
Continually review and finesse the EQA scheme
Distribution of samples commenced in 2000, utilizing the expertise and facilities offered by UKNEQAS for Immunology, Immunochemistry and Allergy for sample preparation, distribution and result analysis. In general, two samples were distributed every other month. The years 2000–2002 were largely experimental. Basic sample composition was altered during this time in order to achieve stable, stoichiometric solutions that could form a sound basis for setting realistic clinical scenarios for which interpretative comments could be elicited. Oxyhaemoglobin and bilirubin, when added, were generally added in unequivocal concentrations to make solutions clearcut for analytical and interpretative scenarios. The information that was requested from participants changed as the response to each distribution was reviewed so as to make the response from participants less ambiguous and more definitive and to incorporate the information contained in the initial guidelines of 2001. EQA reports also changed over this time in line with the information requested from participants, in particular with the introduction of an expert interpretative commentary on which pigments should have been detected and whether or not this supported SAH.
From the beginning of 2003, with sample integrity now assured, information requested from participants and report format remained similar until the end of 2005. Samples generally tested lower concentrations of bilirubin, with a number stressing values just above the cut-off of 0.007 AU. Reports now contained numerical statistics for mean NBA, SD and coefficient of variation and a frequency distribution. The returns and interpretations were reviewed by the Chair of the group to detect anomalies before the report was finalized. All reports contained a definitive expert comment on what should have been detected, an interpretation and a rationale for the interpretation to aid in understanding and education. From mid-2004, a value for NOA was elicited and reported, and participants were now requested to provide the interpretation they would have provided had the EQA samples been clinical samples, in line with the guidelines published in 2003.
Establish scoring criteria and poor performance indices to encourage good performance once the scheme is mature
Pilot performance scoring was introduced from the beginning of 2006. This followed the Misclassification Index Score (MIS) used in other Immunology UKNEQAS schemes; one misclassification point was awarded if the measurement of NBA fell outside certain limits; a second was awarded if the interpretation was significantly different from that judged to be the correct interpretation by a panel of SAG members or if there was a failure to provide an interpretation. To facilitate this change, participants were provided with codes that directly matched the interpretation provided in the 2003 guidelines. Performance was judged on an Overall Misclassification Index Score (OMIS), derived from the sum of MIS over a rolling 12-month window covering six distributions and 12 samples. Good performance for each element was suggested by an OMIS of 0, adequate by an OMIS of 1–2 and poor as >2. NBA and interpretation were scored separately. A combined OMIS of >4 also constituted poor performance, likely to penalize those who consistently submitted an incorrect analytical result which then lead to an incorrect interpretation.
When the revised guidelines were introduced in 2008, the interpretation codes were amended accordingly.
Ask pertinent questions about current practice and use the scheme to examine them if possible
As spectrophotometry was pivotal to the entire analytical and interpretative process, in June 2008, an experimental series of solutions was distributed to test the calibration of participants' spectrophotometers. 18
Drive and support improved practice
A major concern during the first year of the scheme was the number of participants who still used visual inspection. It was clear that once the bilirubin concentration fell below a certain value, usually that with an NBA between 0.030 and 0.050 AU (4–7× the upper limit of normal), visual inspection failed to detect xanthochromia, as previously described. 19,20 The reasons for this have subsequently been rigorously established. 21 Once the insensitivity of visual inspection became apparent, towards the end of 2001, participants were advised not to use visual inspection, the advice becoming stronger so that in August 2003 it was deemed unsafe and in November 2003 that it was untenable. 22,23
Publicise the scheme to reach all users of the assay
The SAG was also aware that there was an unknown number of microbiology laboratories which were not part of the scheme yet provided the only service in a hospital for examination of CSF in suspected SAH and probably most used visual inspection. To address this, in the second half of 2001, we strove to ensure that all microbiology laboratories were informed of the existence of the UKNEQAS CSF Haem Pigments scheme. As registrations did not appear to rise subsequently, the help of the National Quality Assurance Advisory Panel for Microbiology was elicited and during the latter part of 2003, a one-page summary of advice on appropriate examination of CSF and participation in EQA was circulated to all participants in UKNEQAS microbiology schemes. In addition, a Royal College of Pathologists Bulletin in 2004 contained an article highlighting the requirement to use spectrophotometry. 24
Overview of success from EQA participation and returns
A major component of an EQA programme such as this, where there is an equal requirement for support for analysis and interpretation, was that of education and standardization of practice. This was initially promoted by the guidelines and, from 2001 by the scheme reports which contained an educative commentary, indicating why a particular interpretation, based on the guidelines, fitted in with the result and scenario provided. Participants were invited to comment or seek advice on the usual UKNEQAS confidential basis. The SAG and its individual members, when not considering guidelines, also produced a total of 33 other articles, letters and posters, either de novo or in response to articles in the literature. More recently, the use of the UKNEQAS web-based interpretative scheme has hosted CSF cases in parallel.
Table 1 shows the number of participants in the scheme, at key stages in the scheme development. Numbers of participants have steadily increased to a level that we judge, overseas participants aside, is commensurate with the number of laboratories providing the primary clinical service for the detection of SAH. Most importantly, visual inspection, an accepted poor practice, has almost been eliminated.
Number of participants in cerebrospinal fluid External Quality Assurance scheme, number using spectrophotometry and number using visual inspection at key points in scheme development
Figure 3 depicts how the ability to detect bilirubin according to the composition of the sample has changed over the years once the stability of solutions had been established. Four candidate samples have been chosen for each year of distribution as described in the legend.
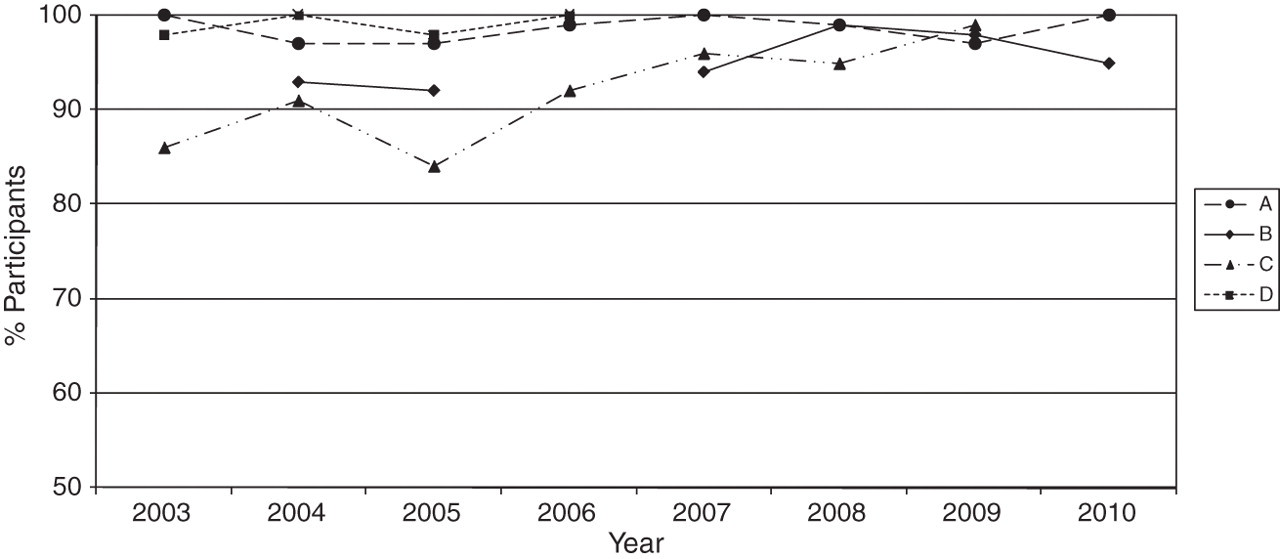
Percentage of participants correctly detecting bilirubin spectrophotometrically for the years 2003–2010 according to sample composition.
Four features are apparent:
• Sample A. Nearly 100% of participants have been consistently able to detect the absence of haem pigments;
• Sample B. When bilirubin is the only pigment present, >90% can detect a two-fold increase in bilirubin and there may have been some improvement with time;
• Sample C. When bilirubin at a low concentration is present together with oxyhaemoglobin, there appears to have been a steady improvement in detection year on year from 85% to >95%;
• Sample D. Oxyhaemoglobin with higher concentrations of bilirubin was readily detectable from the start. These samples were not prioritized from 2007 onwards in order to concentrate on the detection of small increases in bilirubin (Sample C).
Figure 4 indicates how well laboratories were able to interpret results for three different, straightforward sample/interpretative scenarios for the years 2002–2010. From 2006 onwards, with the introduction of interpretation scoring, the format of interpretation changed and these samples have been selected as most likely to represent comparable scenarios. Excellent interpretative agreement is seen for all scenarios at >90%.
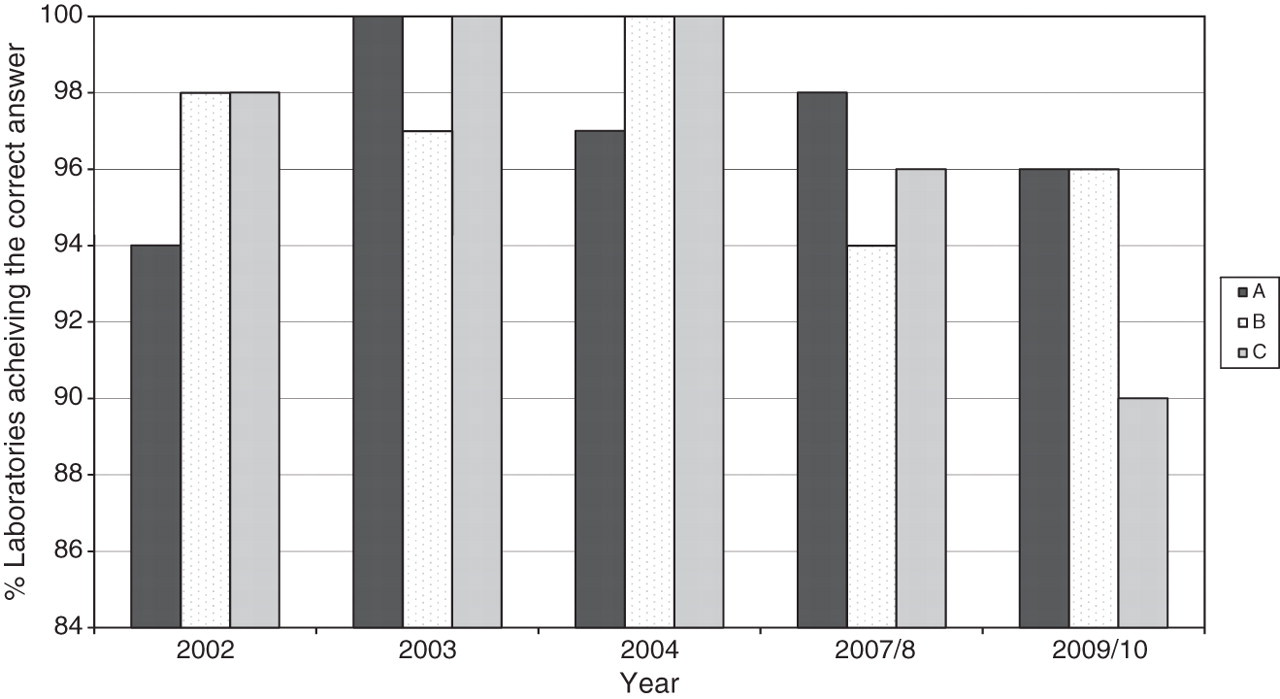
Percentage of participants correctly interpreting straightforward clinical scenarios for the years 2002–2010:
Figure 5a confirms that even when cumulative misclassification scores are used, analytical performance has remained robust over the years and started from a high baseline. The number of participants with OMIS > 2 has declined for the last two years, although there may be a slight increase in those with OMIS 1–2, probably due to the issuing of more difficult samples as the scheme matures.
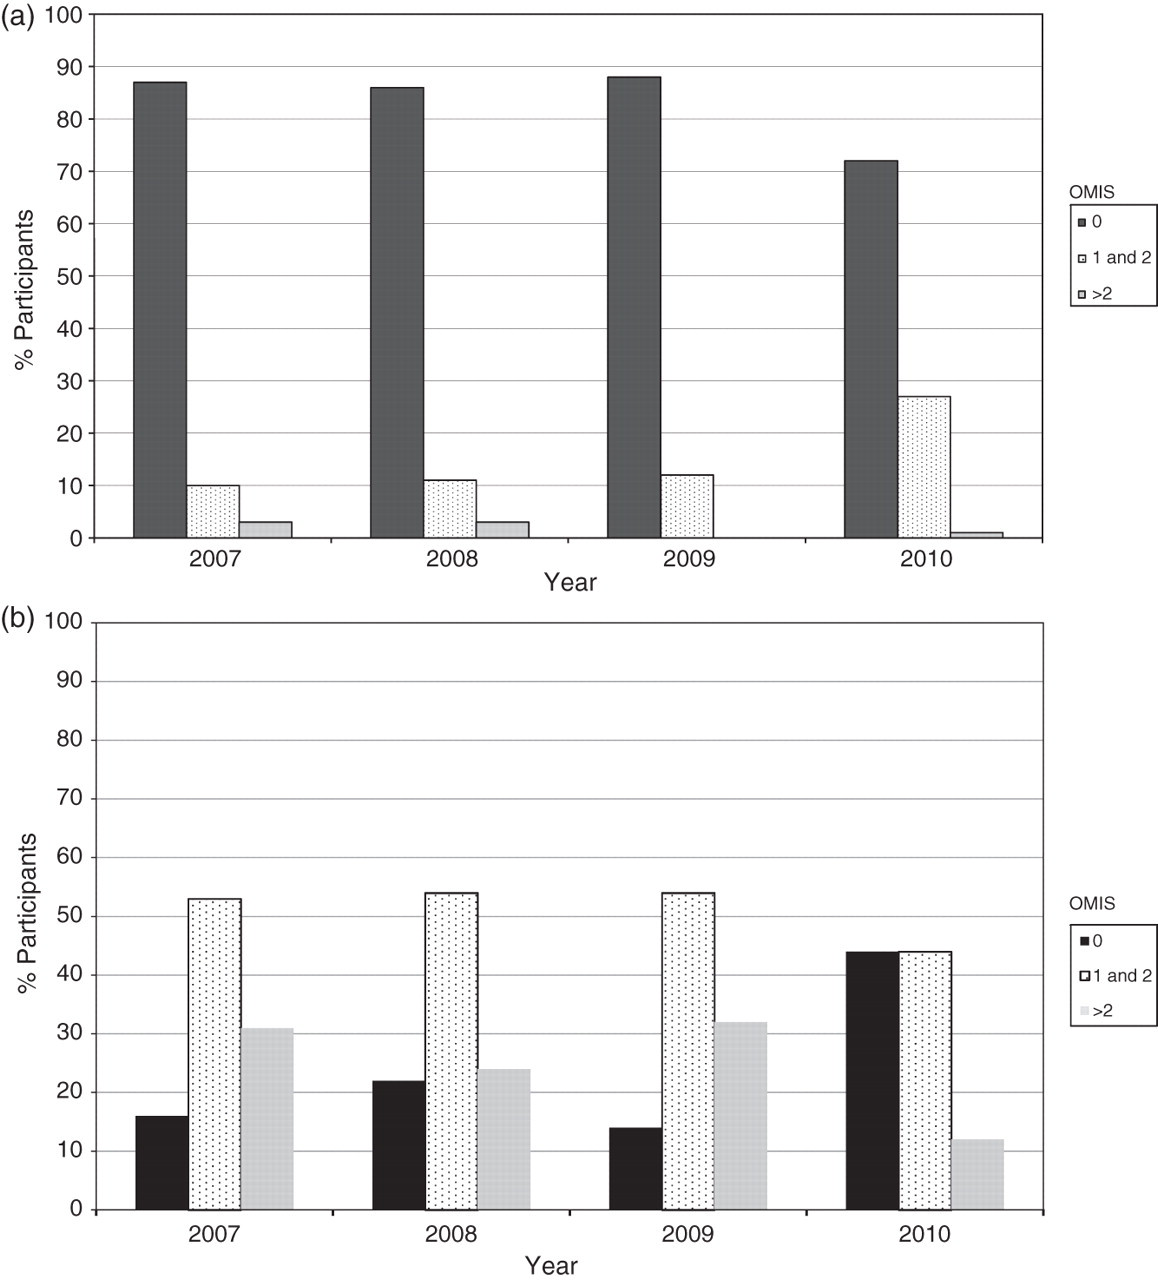
(a) Performance for net bilirubin absorbance quantitation as judged by Overall Misclassification Index Score (OMIS) for the years 2007–2010. (b) Performance for interpretation as judged by OMIS for the years 2007–2010
Figure 5b shows that overall interpretation is not as good as analytical performance for the same time period nor, using cumulative performance data (OMIS), does it present as good a picture as that presented by Figure 4. By 2010 there does, however, appear to be a real increase in those with an OMIS of 0 and a decrease in those with an OMIS of >2. We attribute the poorer interpretative performance partly to the effect of adding in more complex scenarios. Longer term monitoring will be required against the guidelines and repeated educational efforts made in areas of difficulty.
The difficulty demonstrated by participants when interpreting more complex scenarios is illustrated in Figure 6. This shows the percentage of patients with an NBA or interpretation MIS for four distributions made between 2007 and 2009. Each distribution consisted of a straightforward analytical solution but each was accompanied by a complex clinical scenario, A–D. All had low NBA MIS as expected from data already presented. The interpretation MIS suggest difficulties in interpretation by 20–40% of laboratories despite all the scenarios being covered in the guidelines and at least two (A and B) having featured in previous distributions with appropriately targeted learning episodes in their associated commentaries.
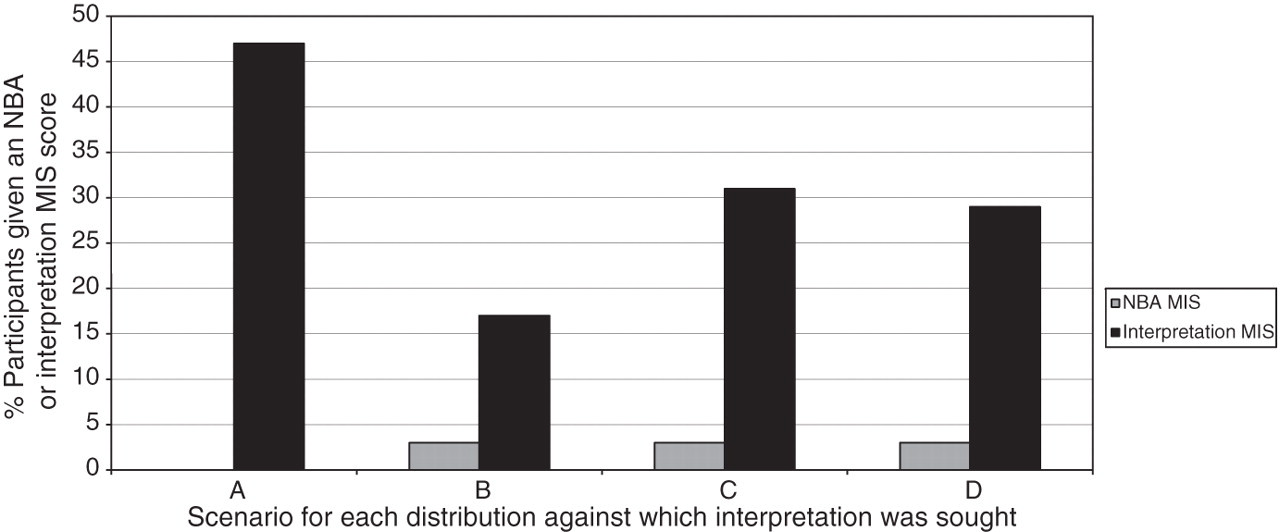
Contrast between analytical and interpretative Misclassification Index Score (MIS) for more complex clinical scenarios:
In summary, we have demonstrated a doubling of participant numbers and the virtual elimination of visual inspection, which we suggest must be of benefit to patients. We have demonstrated how we can monitor analytical and interpretative performance both on a one-off and cumulative basis. Analytical performance has remained robust on both counts, with one particular sample, that containing oxyhaemoglobin and a small increase in bilirubin, representative of an early and small SAH, showing improved performance by participants over time. Interpretative performance has remained robust for simple clinical scenarios, but there is a requirement to undertake further educative work in more complex scenarios.
From early in the scheme, a few laboratories reported CSF bilirubin concentrations, although it was not clear quite how these were derived. A paper in 2004 described the modification of a standard serum bilirubin method to determine CSF bilirubin, further validated in 2007. 25,26 As an accompanying editorial observed, ‘while this approach presented an extremely attractive proposition, ultimately the quality of such assays would require to be monitored in an External Quality Assessment Scheme’. 27 At present, there is no EQA evidence available on the performance of such direct CSF bilirubin assays.
Discussion and conclusion
We have described how an EQA scheme working in a specialist area hitherto untried and untested has evolved from the provision of trial solutions lacking stability and the production of basic analytical reports into a mature scheme that: can test and categorize analysis at critical values; measures a participant's ability to interpret test results covering the entire range of situations encountered in everyday practice (complex and easy); and provides educative feedback on performance. Moreover, the scheme has provided three sets of best practice guidelines over 10 years that should have enabled participants to function with a high degree of competence and improved standardization in what is acknowledged to be a complex area. How successful have we been and if we have been in some part successful, to what can we attribute this success?
On a simple level, the maturation of the scheme, coupled with the provision of the guidelines can be counted as a distinct success. We have developed tools with which we can measure participants' performance. We can therefore judge success by how this performance has changed with time in response to guidelines and educative commentaries and other initiatives.
Again, we can observe the increase in participants over time, and the virtual elimination of visual inspection (Table 1). We can observe participants' high level of technical performance in detecting bilirubin correctly in a different variety of solutions typical of those encountered in practice. Such performance is apparent both before and after the introduction of misclassification scoring (Figures 3 and 5). We can now monitor and demonstrate a high level of performance when participants are asked to provide an interpretation against the guidelines for the more simple scenarios (Figure 4).
Cumulative participants' performance for more difficult scenarios is more of a cause for concern. The number of participants with poor performance of interpretation has been too great for comfort (Figure 5), although there appears to have been a very recent improvement. The poor performance can be attributed perhaps to some inconsistency of performance on simple scenarios, thus building up cumulative errors, and definitely to a poorer performance on the more complex of situations (Figure 6). It is of concern that this has occurred for scenarios that have previously been set and for which a suitable commentary has been provided, suggesting possible problems with continuity and cascade training. What is never clear is the extent to which EQA returns are completed by staff other than those who would validate a clinical report.
The successful introduction of the scheme can be attributed to four main features:
The first of these has been the availability of an international provider of EQA (in UKNEQAS for Immunology, Immunochemistry and Allergy) that has the infrastructure and expertise for sample preparation and despatch, result handling and report preparation and distribution; The second has been the formation of the UKNEQAS CSF SAG, consisting of members with a distinct expertise in the field, a passion for the subject and a desire to move it forward; The third has been the continuing high level of interaction between the two bodies based on the common aim of improving standards in an area critical to patient care; The fourth has been the willingness of professional bodies to engage and publicize the initiative and for colleagues to recognize the merit of the guidelines.
So, while scheme organizers and the SAG have met formally every six months for the 10 years under consideration, much activity has taken place in between these meetings. This can be seen in the solution of the sample instability and recovery problems, the rapid production of the initial set of guidelines which were then submitted for publication within three years of the inception of the project, the audit of CSF analysis, and the many other and diverse publishing and educational activities. Each report has received input from at least one member of the SAG and members have always been available to answer individual queries from participants and the wider community. This has required a degree of commitment in both time and expertise from SAG members and a willingness and ability of the scheme organizer to respond rapidly to unfolding events. As budgets come under constraint, such voluntary professional endeavours may be more difficult to deliver in the future.
In conclusion, we have demonstrated that where there is a need to change practice, a strategy that combines the educational engagement of an EQA scheme with an active and voluntary professional advisory group, can generate appropriate evidence-based guidance, real baseline performance data, evaluate compliance with the guidance and encourage and monitor harmonization of practice and adoption/definition of best practice.
DECLARATIONS