
Abstract
Introduction
Clinical trials have shown that apolipoprotein B100 (apoB) is better than calculated low-density lipoprotein cholesterol (c-LDL-C) or non-high-density lipoprotein cholesterol (non-HDL-C) as a target for statin treatment. However, there are no published reports of how well these targets are reached in patients with more severe hyperlipidaemias than represented in trials, as seen in lipid clinics.
Methods
We audited 195 patients attending a tertiary centre lipid clinic, who had been treated with a statin for more than one year. We measured total cholesterol, HDL-cholesterol (HDL-C) and triglyceride and from these calculated LDL-cholesterol (LDL-C) and non-HDL-C. We determined the average measured apoB values, at critical target values of LDL-C and non-HDL-C, by linear regression and compared them with values of apoB considered equivalent to these cholesterol indexes by expert groups. We also assessed the number of patients, both before and after treatment, in whom c-LDL-C and non-HDL-C could not be calculated due to hypertriglyceridaemia.
Results
At the LDL-C target of 2.6 mmol L−1 and the non-HDL-C target of 3.4 mmol L−1, the measured apoB values were significantly higher than consensus apoB target values. The difference was most marked for c-LDL-C in hypertriglyceridaemic subjects and for non-HDL-C in patients without hypertriglyceridaemia. A similar pattern was seen using centile-derived consensus values but the differences were accentuated because this approach generates lower equivalent consensus apoB values.
Conclusion
ApoB offers a more consistent treatment target independent of hypertriglyceridaemia and would obviate technical problems related to high triglycerides.
Introduction
Clinical trials have shown that apolipoprotein B100 (apoB) is better than low-density lipoprotein cholesterol (LDL-C) or non-high-density lipoprotein cholesterol (non-HDL-C) as a target for statin treatment. 1–4 Recent guidelines have proposed that apoB levels of 0.8 and 0.9 g L−1 are the equivalent of LDL-C targets of 1.8 and 2.6 mmol L−1 and non-HDL-C targets of 2.6 and 3.4 mmol L−1, respectively. 5 Alternative suggestions equate apoB of 0.8 and 1.0 g L−1 to LDL-C of 2.6 and 3.4 mmol L−1 and non-HDL-C of 3.1 and 3.9 mmol L−1, respectively, on the basis of equivalent centiles in the normal population. 6 Statins have proved effective in both primary and secondary prevention of cardiovascular disease. 7,8 Their primary mode of action is to decrease circulating LDL-C by the competitive inhibition of hepatic cholesterol biosynthesis, at the level of 3-hydroxy-3-methylglutaryl-CoA reductase, leading to the up-regulation of hepatic LDL receptor-mediated catabolism. Circulating LDL is not believed to participate directly in atherogenesis, but must first undergo some modifications affecting the structure of its apoB so that it becomes a ligand for the scavenger receptors of monocyte-macrophages in the arterial wall. 9 This triggers the formation of foam cells, which are important in early atheroma development and later for plaque growth and rupture. Both the nature and number of circulating LDL particles determine their atherogenicity, 10–12 which may be assessed by measurement of cholesterol and apoB content or by direct physical measurement of particle size and number. 13
There is strong epidemiological and clinical trial evidence that apoB has advantages over cholesterol indexes in cardiovascular risk estimation, particularly in patients with hypertriglyceridaemia. 14 A recent meta-analysis showed apoB to be a better marker for cardiovascular events than LDL-C and non-HDL-C. 15 In statin trials, in which both the LDL-C and apoB response have been measured, the percentage decrease in apoB is less than that in LDL-C. For example, comparison of cholesterol-based targets with apoB in the Collaborative Atorvastatin Diabetes Study cohort 16 and the Measuring Effective Reductions in Cholesterol Using Rosuvastatin (MERCURY) trial 17 suggested that the apoB concentration provides a more consistent goal for statin treatment than the LDL-C or non-HDL-C concentration. This is of concern as it may explain some of the residual cardiovascular disease risk remaining after achieving low LDL-C levels. Remodelling of LDL particles, with reduction of cholesterol content, occurs with statin treatment and is more pronounced in the presence of hypertriglyceridaemia. Measures of LDL-C may be particularly inaccurate as an estimate of the concentration of particles in this situation because of the presence of small dense cholesterol-depleted LDL particles. The added value of apoB arises because a single molecule of apoB remains with an LDL particle throughout its metabolism and its measurement more accurately reflects LDL particle number than LDL-C.
The view that apoB should be used as a target for lipid-lowering therapy is finding acceptance. Values for apoB equivalent to LDL-C targets have been promoted in a consensus statement from the American Diabetes Association (ADA) and American College of Cardiology (ACC). 5 The equivalent values are: apoB levels of 0.8 and 0.9 g L−1 are equivalent to LDL-C of 1.8 mmol L−1 (70 mg dL−1) and 2.6 mmol L−1 (100 mg dL−1), respectively, and non-HDL-C of 2.6 mmol L−1 (100 mg dL−1) and 3.4 mmol L−1 (130 mg dL−1). The difference between LDL-C and non-HDL-C is 0.8 mmol L−1 (30 mg dL−1), allowing for very low-density lipoprotein cholesterol (VLDL-C) found in non-HDL-C. A recent report 6 has suggested that the equivalent centiles in a normal population be adopted as a basis for equating LDL-C and apoB targets. This system equates LDL-C of 2.6 (100 mg dL−1) mmol L−1 and 3.4 mmol L−1 (130 mg dL−1) and non-HDL-C of 3.1 mmol L−1 (120 mg dL−1) and 3.9 (150 mg dL−1) to apoB of 0.8 and 1.0 g L−1, respectively. The question of whether LDL-C or apoB provide the better target for statin treatment in clinical practice has not been explored as much as it deserves. We can find no earlier study assessing the relative merits of these targets in the care of lipid clinic patients. Clinic populations are likely to differ from those in clinical trials in the frequency of mixed dyslipidaemia, the severity of hypertriglyceridaemia, the use of higher doses of statins and in the use of combination therapy. In the present report, we prospectively examined the equivalence of calculated low-density lipoprotein cholesterol (c-LDL-C), non-HDL-C and apoB as treatment targets in 195 consecutive patients treated with statins attending a tertiary centre lipid clinic for more than a year. We determined the average measured apoB values, at critical target values of LDL-C and non-HDL-C, by linear regression and compared them with values of apoB considered equivalent to these cholesterol indexes by expert groups.
Method
Study population
All 195 patients had counselling on their diet from a qualified dietician and had been treated with a statin for more than a year. Patients were asked to fast from 22:00 the previous day before a blood sample was taken. Patient characteristics were: age between 18 and 83 y (mean 57.2 y), 64% of patients were men, 24% were diabetic, 22% were known to have heterozygous familial hypercholesterolaemia (Simon Broome criteria) 18 and 4% had type III hyperlipoproteinaemia identified by dyslipidaemia and apoE genotype. Most patients (140 [71.8%]) were on statin monotherapy. The statins prescribed were simvastatin (mean daily dose 40.9 mg d−1) in 22 patients (11.3%), atorvastatin (mean daily dose 50.6 mg d−1) in 140 patients (71.8%), rosuvastatin (mean daily dose 24.3 mg d−1) in 30 patients (15.4%) and pravastatin (mean daily dose 23.3 mg d−1) in three patients (1.5%). Combination therapy was used in 29.2%. The other drugs used were: ezetimibe 50 (25.6%), fenofibrate 20 (10.2%), bile acid sequestrants four (2%), long chain omega-3-fatty acid three (1.5%) and slow-release nicotinic acid (niaspan) one (0.5%). Fasting serum cholesterol, triglycerides (TGs), HDL-cholesterol (HDL-C) and apoB were measured in all patients. The Friedewald formula was used to derive c-LDL-C when serum TGs were 4.5 mmol L−1 or less and non-HDL-C was calculated as the difference between the total cholesterol and HDL-C. We determined the number of patients, both before and after treatment, in whom c-LDL-C and non-HDL-C could not be calculated due to hypertriglyceridaemia.
The project was registered with Central Manchester University Hospital NHS Foundation Trusts Clinical Audit Department (audit number 1494).
Laboratory methods
All lipid measurements were made routinely using the standard laboratory protocols of the Department of Clinical Biochemistry at the Central Manchester University Hospital NHS Foundation Trust using a Roche Modular P analyser (Roche, Basel, Switzerland). Serum cholesterol was measured by the Roche CHOD-PAP method, HDL-C by the Roche HDL-C plus direct homogenous method using magnesium sulphate and dextran sulphate and poly(ethylene glycol)-modified enzymes and TGs by the Roche GPO-PAP enzymatic method. Total cholesterol measurement is traceable to the International Federation of Clinical Chemistry (IFCC) primary standards. Serum apoB was measured using an immunoturbidimetric method (Horiba ABX-UK, Shefford, UK) on a Cobas Mira analyser (Horiba ABX-UK) and its calibration was achieved using material traceable to the IFCC primary standards.
Statistical methods
Linear regression equations were derived for apoB as the dependant variable and c-LDL-C or non-HDL-C as predictor variables using ‘Analysit for Microsoft Excel’. The regression equations were used to derive mean values for apoB and their 95% confidence intervals at recommended target values of LDL-C and non-HDL-C. The estimated mean apoB equivalent to the target values of LDL-C and non-HDL-C were compared with the recommended equivalent values and the significance of difference measured using a single sample Student's t-test with P < 0.05 regarded as statistically significant. Normality of the distribution of lipids and apoB were measured using the Shapiro–Wilk test with P < 0.05 as the criterion for non-normality.
Results
Before treatment, c-LDL-C could not be calculated in 61 patients (31%) because TG was more than 4.5 mmol L−1 and HDL-C could not be measured in 18 patients (9%) due to turbidity caused by high TG level (>8.5 mmol L−1), which precluded the calculation of non-HDL-C. After treatment, TG remained higher than 4.5 mmol L−1 and below 8.5 mmol L−1 in 18 out of 195 (9%) patients and hence non-HDL-C could be calculated in all 195 patients. The analysis of equivalence of apoB and cholesterol indexes was restricted to the 177 patients for whom all values could be obtained after statin treatment. On treatment lipid and apoB concentrations are shown in Table 1. Mean apoB values at consensus target values of c-LDL-C and non-HDL-C were derived from the appropriate regression plots. An analysis of difference from consensus values for the whole group is shown in Table 2, together with a separate analysis of patients with TG above and below the median TG of 1.7 mmol L−1. The scatter of individual data points is shown in Figure 1. At the conservative, ADC/ACC, LDL-C treatment target of 2.6 mmol L−1, there was a difference between the measured and consensus apoB values 0.97 (0.94–1.00) (mean [95th CI]) versus 0.90 g L−1, P < 0.0001, but there was no difference at the more aggressive target of 1.8 mmol L−1. In the hypertriglyceridaemic group, differences were observed at both 2.6 mmol L−1: 1.01 (0.96–1.06) versus 0.90 g L−1, P < 0.0001 and at 1.8 mmol L−1: 0.87 (0.82–0.93) versus 0.80 g L−1, P = 0.0127. No differences were observed in normotriglyceridaemic subjects at either LDL-C target. For centile-derived apoB targets, equivalent to c-LDL-C of 3.4 and 2.6 mmol L−1, differences were found for the whole group: 1.10 (1.06–1.14) versus 1.00 g L−1, P < 0.0001 and 0.97 (0.94–1.00) versus 0.80 g L−1, P < 0.0001, respectively. The difference was greater in the higher TG group: 1.14 (1.06–1.20) versus 1.00 g L−1, P < 0.0001 and 1.01 (0.96–1.06) versus 0.90 g L−1, P < 0.0001 but differences were also noted in the low TG group: 1.08 (1.04–1.12) versus 1.00 g L−1, P < 0.0001 and 0.93 (0.89–0.96) versus 0.80 g L−1, P < 0.0001 for the two targets. The equivalent non-HDL-C targets were assessed in the same way as LDL-C. The derived apoB was significantly higher than the ADA/ACC consensus values at the higher non-HDL cut-off of 3.4 mmol L−1: 0.96 (0.93–0.99) versus 0.90 g L−1, P < 0.0001, but not at 2.6 mmol L−1: 0.81 (0.77–0.84) versus 0.80 g L−1, P = 0.5684. The difference at non-HDL-C of 3.4 mmol L−1 was largely attributable to the low TG subgroup: 0.99 (0.96–1.03) versus 0.90 g L−1, P < 0.0001. There were no differences in the high TG group at either 3.4 or 2.6 mmol L−1 or in the low TG group at 2.6 mmol L−1. For centile-derived non-HDL-C targets of 3.9 and 3.1 mmol L−1, there were overall differences at both the higher and lower targets: 1.05 (1.02–1.08) versus 1.00 g L−1, P = 0.001 and 0.90 (0.87–0.93) versus 0.80 g L−1, P < 0.0001. The differences at both levels were greatest in the lower TG subgroup: 1.09 (1.05–1.13) versus 1.00 g L−1, P < 0.0001 and 0.93 (0.89–0.97) versus 0.80 g L−1, P < 0.0001 but a difference was also found at the lower target in the high TG group: 0.89 (0.84–0.94) versus 0.80 g L−1, P = 0.0005.
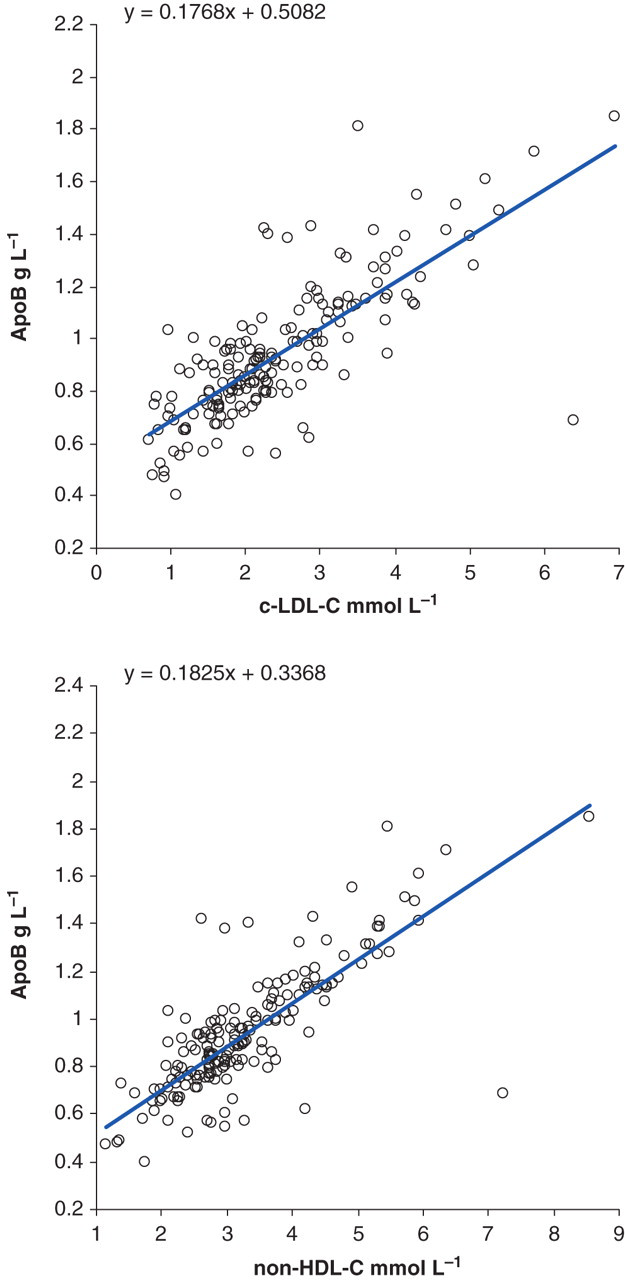
Regression curves used to predict apoB equivalent to c-LDL-C and non-HDL-C apoB, apolipoprotein B100; c-LDL-C, calculated low-density lipoprotein cholesterol; non-HDL-C, non-high-density lipoprotein cholesterol
On treatment serum lipids and apoB
ApoB, apolipoprotein B100
All distributions failed the Shapiro–Wilk test of normality with P < 0.0001 and so data are presented as median and 2.5th–97.5th centile range
Linear regression derived values of apoB target values of c-LDL-C and non-HDL-C
c-LDL-C, calculated low-density lipoprotein cholesterol; apoB, apolipoprotein B100; non-HDL-C, non-high-density lipoprotein cholesterol; TG, triglyceride
*Difference between regression-derived mean apoB from our data and the consensus equivalent value
†Expert report: centile equivalents in reference population
‡American Diabetes Association and American College of Cardiology consensus values
An analysis of variance (R 2) for the regression, which is a measure of the extent to which variance in apoB is explained by either c-LDL-C or non-HDL-C, is presented in Table 3. There were no differences in the predictive power of c-LDL-C compared with non-HDL-C in the group as a whole or in groups above and below the median TG. However, the R 2 for both were higher in the lower TG group. The percentages of patients achieving their c-LDL-C and non-HDL-C targets but not their apoB target are presented in Table 4.
Comparison of variance in apoB explained by c-LDL-C and non-HDL-C
c-LDL-C, calculated low-density lipoprotein cholesterol; apoB, apolipoprotein B100; non-HDL-C, non-high-density lipoprotein cholesterol; TG, triglyceride
*R 2 is the variance in apoB100 explained by the independent variable
† P for difference in R 2 between c-LDL-C and non-HDL-C in the group
Percentage of patients achieving cholesterol but not apoB targets
c-LDL-C, calculated low-density lipoprotein cholesterol; apoB, apolipoprotein B100; non-HDL-C, non-high-density lipoprotein cholesterol
Discussion
In this study of patients attending a tertiary referral lipid clinic, we have shown differences between measured apoB and consensus apoB values considered equivalent to cholesterol indexes of LDL particles by expert groups. The differences between measured and consensus apoB values for c-LDL-C were more marked in hypertriglyceridaemic subjects. The effect of hypertriglyceridaemia was assessed above and below the median TG of 1.7 mmol L−1, above which cholesterol-depleted LDL particles, particularly small dense LDL, are known to accumulate. Neither c-LDL-C nor non-HDL-C was a good predictor of apoB in individual patients because of the wide scatter of data around the regression mean with none of the cholesterol indexes adequately explaining variance in apoB. Neither can be regarded as a substitute for measurement of apoB in this group of patients. The relationship between c-LDL-C and apoB is affected by cholesterol depletion of LDL particles, which is related to hypertriglyceridaemia. This is compounded by the tendency to over-estimate VLDL-C as TG rises. It seems obvious that a single factor in the Friedwald calculation cannot accurately estimate VLDL-C over a range of TG values. The result is higher apoB levels relative to c-LDL-C with a greater difference in the higher TG group and at the higher cut-off, as we observed, when small dense cholesterol-depleted LDL are more prevalent. Agreement is better at lower cut-off targets because statins increase uptake of large cholesterol-rich LDL with a consequent reduction in small dense LDL particle number due to lack of substrate. 16 This effect is more pronounced with more potent statins such as atorvastatin and rosuvastatin. In our clinic, 87.2% of patients were receiving these formulations.
The relationship between non-HDL-C and apoB is similarly affected by cholesterol depletion of particles, but the concordance with apoB is also affected by the accuracy of the allowance made for VLDL-C. The relative under allowance for VLDL-C at high TG results in lower than expected derived apoB values and increased numbers of cholesterol-depleted particles results in higher than expected derived apoB values. We observed good concordance between derived and measured apoB in the high TG group but suggest that this reflects two errors acting in opposite directions giving good average agreement but with poor concordance with individual samples. In the low TG group, cholesterol depletion of LDL is the dominant factor and discordance was greater at the higher cut-off where such particles are more prevalent. Using centile-derived targets for apoB, large differences persist in normotriglyceridaemic subjects even at the 2.6 mmol L−1 LDL-C target. This suggests that the reference population centile-derived targets might be low because they do not take the effect of statins into account. The equivalence between LDL-C and apoB might be better determined in a population of normotriglyceridaemic, statin-treated patients because cholesterol-depleted particles due to hypertriglyceridaemia would be absent and it would take into account the effect of the statin on the average cholesterol composition of LDL particles. A large proportion of patients achieving their c-LDL-C and non-HDL-C targets failed to meet their apoB target. The proportion of patients achieving their c-LDL-C targets but not reaching their apoB targets increased with lower c-LDL-C, with 19%, 27% and 30% failing at c-LDL-C of 3.4, 2.6 and 1.8 mmol L−1, respectively. A particularly large discrepancy of 53% was seen using the centile-derived targets of c-LDL-C 2.6 mmol L−1 and apoB 0.8 g L−1. A similar pattern was seen for those achieving non-HDL-C targets of 3.4, 3.1 and 2.6 mmol L−1, with 13%, 26% and 20% failing to meet the equivalent apoB target and 44% failing at the equivalent centile target of 3.1 mmol L−1 and apoB 0.80 g L−1. Discrepancy in classification undoubtedly reflects LDL particle composition influenced by hypertriglyceridaemia, statin treatment and individual variability.
ApoB is a reliable marker of atherogenic particle number and can be measured accurately and precisely. We have discussed the number of factors making c-LDL-C and non-HDL-C as poor predictors of apoB, particularly in patients with raised TG, even though in the case of non-HDL-C there is a good average agreement. In addition, as both calculated indexes are derived from more than one measurement, the errors of each estimate are necessarily compounded. 19 Measurement of apoB obviates some practical difficulties encountered with c-LDL-C, which cannot be calculated if TG exceeds 4.5 mmol L−1, and non-HDL-C, which cannot be calculated in patients with markedly raised TGs. ApoB also reflects particle number in the presence of abnormal lipoproteins such as in type III dyslipoproteinaemia where intermediate density lipoproteins and remnant particles accumulate. In fact, 4% of our patients had genotypic type III dyslipoproteinaemia but we included them because their phenotype was largely corrected by treatment and genetic identification may not be routine practice in many clinics.
Although some of the differences that we have noted may be explained by differences in method calibration, this does not explain the variability with TG and with different LDL targets. Alternative techniques for measurement of LDL, 20 although possibly with fewer technical constraints, would not address this issue. An accuracy base for apoB based on an IFCC calibrant 21 is well developed and achieving consistency of measurement between laboratories is likely to be easier than for complex homogenous methods for direct measurement of LDL-C. We believe that the use of apoB targets would benefit lipid clinic patients with mixed dyslipidaemia and would offer a more consistent target independent of the intensity of statin treatment in all patients. We recommend the measurement of apoB in patients with TG greater than 1.7 mmol L−1, which is a marker for the accumulation of cholesterol-depleted LDL particles. If apoB measurement is not available, non-HDL-C more closely correlates to the intended apoB target in hypertriglyceridaemic patients than does c-LDL-C. 19 Routine Clinical Biochemistry Departments would be the ideal providers of an apoB assay service in order to encourage its routine use and to promote a robust accuracy and precision base.
Conclusion
We have shown that the measured apoB values equivalent to consensus LDL-C and non-HDL-C values in patients attending a tertiary referral lipid clinic, differed from consensus apoB equivalent values in a manner dependent on the TG concentration and the degree of cholesterol lowering that had been achieved. This makes it impossible to set a consistent treatment target for all patients. ApoB would offer a more consistent treatment target independent of hypertriglyceridaemia and the c-LDL-C achieved with statin treatment and would obviate technical problems related to high TGs that may result in suboptimal treatment of hyperlipidaemia. Therefore, apoB's availability in tertiary lipid clinics is necessary and lipid-lowering therapy should be optimized accordingly to decrease residual risk. There is an established accuracy base for apoB, which would obviate interlaboratory differences.
DECLARATIONS