
Abstract
Background
The Department of Health launched a cardiovascular disease risk assessment initiative with particular reference to reducing health inequalities in ethnic minorities. Collaboration between HEART UK, Royal Free Hampstead NHS Trust and Hindu Temples resulted in vascular screening in North London.
Methods
Subjects of South Asian origin were screened. A full lipid profile and glucose were measured using a point of care testing (POCT) Cholestech LDX analyser (LDX). Venous samples were analysed in our hospital laboratory.
Results
The results (215 men; 191 women) were divided into tertiles and Bland–Altman plots were used to assess agreement. At high-density lipoprotein cholesterol (HDL-C) concentrations <1.0 mmol/L the LDX underestimated values by −0.2 mmol/L (P<0.0001). At HDL-C concentrations >1.3 mmol/L this bias disappeared. For total cholesterol the concentration-dependent negative bias was evident at concentrations of <4.1 mmol/L (P < 0.0001). This bias was less evident at higher concentrations. A similar pattern was seen for low-density lipoprotein cholesterol. There were also small variations in glucose and triglyceride values. However, there was excellent agreement in calculated cardiovascular disease risk using kappa analysis for JBS2, QRISK2, ETHRISK and Framingham (κ = 0.86, 0.92, 0.94 and 0.88, respectively). This was a high-risk population since 9.7–19.4% had a ≥20% 10-y probability of a vascular event depending on the risk engine and assay method used. The corresponding values for intermediate risk (11–19%) were 18.6–25.7%.
Conclusions
There was a minimum mismatch irrespective of the type of risk calculator used. POCT measurements are adequate for the National Health Service Health Check.
Introduction
Morbidity and mortality due to cardiovascular disease (CVD) is a significant health problem worldwide. 1 The burden of CVD falls disproportionately on people living in deprived circumstances and in certain ethnic groups, such as South Asians in the UK. 2 The prevalence of established CVD is greater among migrant South Asians compared with people of European origin. 2,3 Early intervention can reduce risk, prevent, delay, and, in some circumstances, reverse the onset of vascular disease. 4 There is evidence to suggest that these measures have reduced CVD death rates in the UK. 4
In April 2008, the Department of Health launched the ‘Putting prevention first’ initiative. This prioritized CVD screening, with reference to ethnic minorities and health inequalities. 5 The aim is a reduction in the inequalities gap between the areas with the worst health and deprivation indicators and the population as a whole. 6 The National Health Services (NHS) Health Checks pilot programme was rolled out in April 2009 offering opportunistic screening for CVD risk factors to those aged 40–75 y who do not have diagnosed CVD. 7
Previous studies have demonstrated a positive experience and outcome through the involvement of community and religious leaders supporting health promotion. 8 Faith-based settings provide access to such personnel and a familiar and reassuring environment for targeting ‘hard-to-reach’ groups with high CVD risk. These venues may provide resources such as space and volunteers who can help deliver the service (e.g. reliable translating). 9
Point of care testing (POCT) is a means of providing laboratory testing at or near the site of patient care. POCT provides rapid results and earlier treatment. POCT equipment currently available can analyse glucose, haemoglobin A1c, ketones, microalbumin and lipid profiles. 10
There has been a significant decrease in CVD mortality in the USA principally related to improved lipid and blood pressure control. 11 Since more than 80% of CVD is attributable to modifiable risk factors (e.g. dyslipidaemia, hypertension, smoking and diabetes), screening, early detection and treatment of these risk factors should reduce cardiac events. 12 Given the synergistic impact of these risk factors it is recommended that individuals should receive a global assessment of 10-y CVD risk score rather than addressing risk factors in isolation. 11,12
Given this background, we incorporated POCT lipid and glucose testing in a community screening project. To establish the accuracy of our POCT analyser we compared our results with those obtained by our hospital laboratory. 13–16
Material and methods
Participants
A joint collaboration between HEART UK (Hyperlipidemia Education and Atherosclerosis Research Trust UK, The Nation's Cholesterol Charity), The Royal Free Hampstead NHS Trust (London, UK) and Hindu temples resulted in setting up a vascular check screening service for the South Asian population at two locations in North West London. In order to achieve a better uptake, the screening sessions were performed in the afternoon–evening over weekends and were well advertised on the temple website as well as during religious and social gatherings. Therefore, samples were collected in the non-fasting state. On some occasions the sessions were carried out in the morning and fasting samples were collected.
A full cardiovascular risk assessment of adults (age 30–74 y) was carried out after obtaining their consent. A total of 423 subjects of South Asian origin were screened over a period of 12 months. Persons with known cancer, CVD, diabetes, chronic kidney disease, rheumatoid arthritis, atrial fibrillation or on statins were excluded. Individuals with a fasting blood glucose ≥7.0 mmol/L or random blood glucose ≥11.1 mmol/L were considered as having diabetes.
Measurement of lipid profile and glucose
Subjects had both a finger prick sample and a venous blood (serum gel and fluoride oxalate) sample taken.
Point of care testing
The finger prick (capillary blood) sample was analysed on a POCT instrument Cholestech LDX (Cholestech Corporation, Hayward, CA, USA) to obtain a full lipid profile (total cholesterol [TC], triglycerides [TGs] and high-density lipoprotein cholesterol [HDL-C]) and glucose concentrations according to the manufacturer's instructions. The low-density lipoprotein cholesterol (LDL-C) concentration was calculated by the Cholestech LDX using the Friedewald equation ([LDL-C] = [TC] − [HDL-C] − [TG]/2.19). However, we did not statistically analyse LDL-C values as the majority of samples were collected in the non-fasting state. Furthermore, the LDL-C is not incorporated in any risk calculation.
An appropriate quality control (QC) programme (internal and external) was set up to include local laboratory involvement and the hospital POCT committee. Training of individuals involved in testing as well as internal QC systems were put in place according to standard operating procedures (SOPs). The internal QC (Cholestech LDX Multi-Analyte control; Cholestech Corporation) material was run at every screening session. The QC is available as level 1 (low) and level 2 (high). These values vary with the lot. A record of these was kept. All QC values were within the acceptable limits designated by the manufacturer. The three Cholestech LDX analysers were registered with the Welsh External Quality Assurance Scheme.
Performance characteristics of the Cholestech LDX analyser such as analytical limits, imprecision and interference factors are outlined in the Cholestech LDX system Procedure Manual (
Between-run POCT coefficient of variation (CV) was assessed on site using low and high QC material. The CV for low and high TC was 3.6% for both. For HDL-C the CVs were 4.4% (low) and 3.7% (high); for TGs 4.3% (low) and 3.1% (high).
Laboratory method (reference method)
A venous sample was taken by venepuncture in the sitting position. Blood was directly drawn into dedicated evacuated tubes (BD Diagnostics-Preanalytical Systems, Oxford, UK; serum gel tube for lipids, and fluoride oxalate tube for glucose) using aseptic precautions. The samples were kept in an insulated container and were transported by medical courier (within 4–6 h after phlebotomy) to the hospital laboratory for analysis. Samples were centrifuged and separated on the same day and, if possible, analysed on the same day. Otherwise, they were analysed on the next day.
The venous serum gel samples were analysed for lipids and fluoride oxalate plasma were analysed for glucose in the Clinical Biochemistry Laboratory at the Royal Free Hampstead NHS Trust. TC, HDL-C, TG and plasma glucose were analysed in the laboratory using a Roche Modular P® analyser and Roche® reagents.
TC measurement was based on direct determination of cholesterol in human serum and plasma using cholesterol oxidase-peroxidase method (Cobas®; Roche Diagnostics GmbH, Mannheim, Germany).
HDL-C plus third generation (Cobas®; Roche Diagnostics GmbH) is based on direct determination of HDL-C in human serum and plasma using polyethylene glycol (PEG)-modified enzymes and dextransulphate. When cholesterol esterase and cholesterol oxidase enzymes are modified by PEG, they show selective catalytic activities towards lipoprotein fractions with reactivity increasing in the order LDL-C < VLDL ∼ chylomicrons < HDL-C.
TG measurement was based on the principle of rapid and complete hydrolysis of TG (using lipoprotein lipase) to glycerol followed by oxidation to dihydroxyacetone phosphate and hydrogen peroxide (Cobas®; Roche Diagnostics GmbH).
Glucose was measured in the plasma using the glucose oxidase method (Cobas®; Roche Diagnostics GmbH).
The internal Biorad QC material was run everyday. All QC values were within the acceptable limits designated by the manufacturer. The laboratory is registered with the UK National External Quality Assurance Scheme and Randox International Quality Assessment Scheme.
All the laboratory methods had a between run CV of <4%. Results outside the analytical limits of the methods are automatically diluted by the analyser and the corrected result reported.
CVD risk calculation
Cardiovascular risk was calculated using the four available web-based risk calculators: Joint British Societies (JBS2), QRISK2, ETHRISK and Framingham.
JBS2 ( Using this risk engine, the risk was calculated in all individuals in the age range of 35–74 y using the following parameters: age, gender, systolic and diastolic blood pressure, ethnicity, family history of CVD (men <55 y; women <65 y), smoking status, TC and HDL-C and waist measurement. Since most of the subjects were non-fasting, TG values were not considered in the risk calculation. QRISK2 ( Batch calculator for QRISK2 was used to calculate the CVD risk in individuals in the age range of 35–74 y using the following parameters: age, gender, ethnicity, postcode (wherever available), smoking status, family history (<60 y in first-degree relative), systolic blood pressure, body mass index and TC/HDL-C ratio. ETHRISK ( The CVD risk is calculated using age (35–74 y), gender, ethnicity, systolic blood pressure, smoking status, TC and HDL-C. Framingham ( The CVD risk is calculated using age (35–74 y), gender, systolic blood pressure, smoking status, TC and HDL-C. There were no corrections for family history or ethnicity.
Therefore, the Framingham calculation is the only risk engine listed above that does not include ethnicity.
Statistical analysis
Data were analysed using Analyze-It (Analyze-It Software Ltd, Leeds, UK). Bland and Altman plots were used to assess agreement between methods for TC, HDL-C, TG and glucose. 17 Weighted kappa statistics were used to calculate agreement between risk categorization based on POCT and the hospital laboratory values. Kappa is an index which compares the agreement against that which might be expected by chance. Weighted kappa takes into account the extent to which the observation disagree. It is judged by using asymptotic standard error to construct a ‘t’ statistic to test whether the measure differs from 0. A kappa coefficient >0.75 was considered to represent excellent agreement, values from 0.4 to 0.75 indicate fair to good, and values <0.4 indicate poor agreement. 18 The data were checked for normality and expressed as mean ± SD or median and range, as appropriate.
General practitioners were notified and advised to carry out further evaluation if the individuals screened had a calculated CVD risk of ≥20% (high), isolated severe hyperlidaemia, isolated hypertension or a random glucose ≥11.1 mmol/L.
Results
We had paired data (POCT as well as laboratory values) for 423 subjects. Seventeen individuals with TG value >4.5 mmol/L were excluded from the analysis.
Out of 406 subjects assessed (215 [53%] men), the median age was 50 y (range 30–74 y).
Comparison of POCT versus laboratory values
The two methodologies for lipid measurements were compared using Bland–Altman Plots. The data were divided into tertiles for each biochemical parameter and Bland–Altman plots were used to asses the agreement between methods (POCT versus laboratory) with the following results. The overall regression of the analytes measured by POCT and laboratory are shown in Figure 1(a–d).
TC The mean TC for the whole population was 4.6 ± 1.0 mmol/L and 4.9 ± 1.0 mmol/L for the Cholestech LDX and laboratory method, respectively. Using Bland–Altman plots, the concentration-dependent bias was greatest at the TC lowest tertile 2.4–4.1 mmol/L. Cholestech LDX underestimated the TC by 0.5 mmol/L (P < 0.0001) at this tertile. Any difference decreased in the other tertiles but retained the same significance (Table 1). HDL-C The mean HDL-C was 1.2 ± 0.4 mmol/L and 1.3 ± 0.4 mmol/L for Cholestech LDX and laboratory method, respectively. The concentration-dependent bias was more evident for HDL-C at concentrations 0.4–1.0 mmol/L (i.e. the lowest tertile) (Table 1). At these HDL-C concentrations the Cholestech LDX underestimated by 0.2 mmol/L (P < 0.0001). At HDL-C concentrations of 1.1–1.3 mmol/L (i.e. the middle tertile), it underestimated by 0.1 mmol/L (P < 0.0001) (Table 1). The concentration-dependent bias was no longer significant (underestimation = 0.03 mmol/L) in the third tertile >1.3 mmol/L (P = 0.1) (Table 1). Bias for TC: HDL-C ratio was calculated using Bland–Altman plots and showed significant bias at the second and third tertiles (P < 0.0001) (Table 1). TG The mean TG was 1.7 ± 0.9 mmol/L and 1.8 ± 1.1 mmol/L for Cholestech LDX and laboratory method, respectively. Using Bland–Altman plots a significant difference (P = 0.0004) in TG concentration was only observed in the first tertile (0.5–1.2 mmol/L) (Table 1). Glucose The mean glucose was 5.4 ± 0.9 mmol/L and 5.1 ± 0.7 mmol/L for Cholestech LDX and laboratory method, respectively. Using Bland–Altman plots there was a significant difference (P < 0.0001) in glucose concentration at all three tertiles (Table 1).
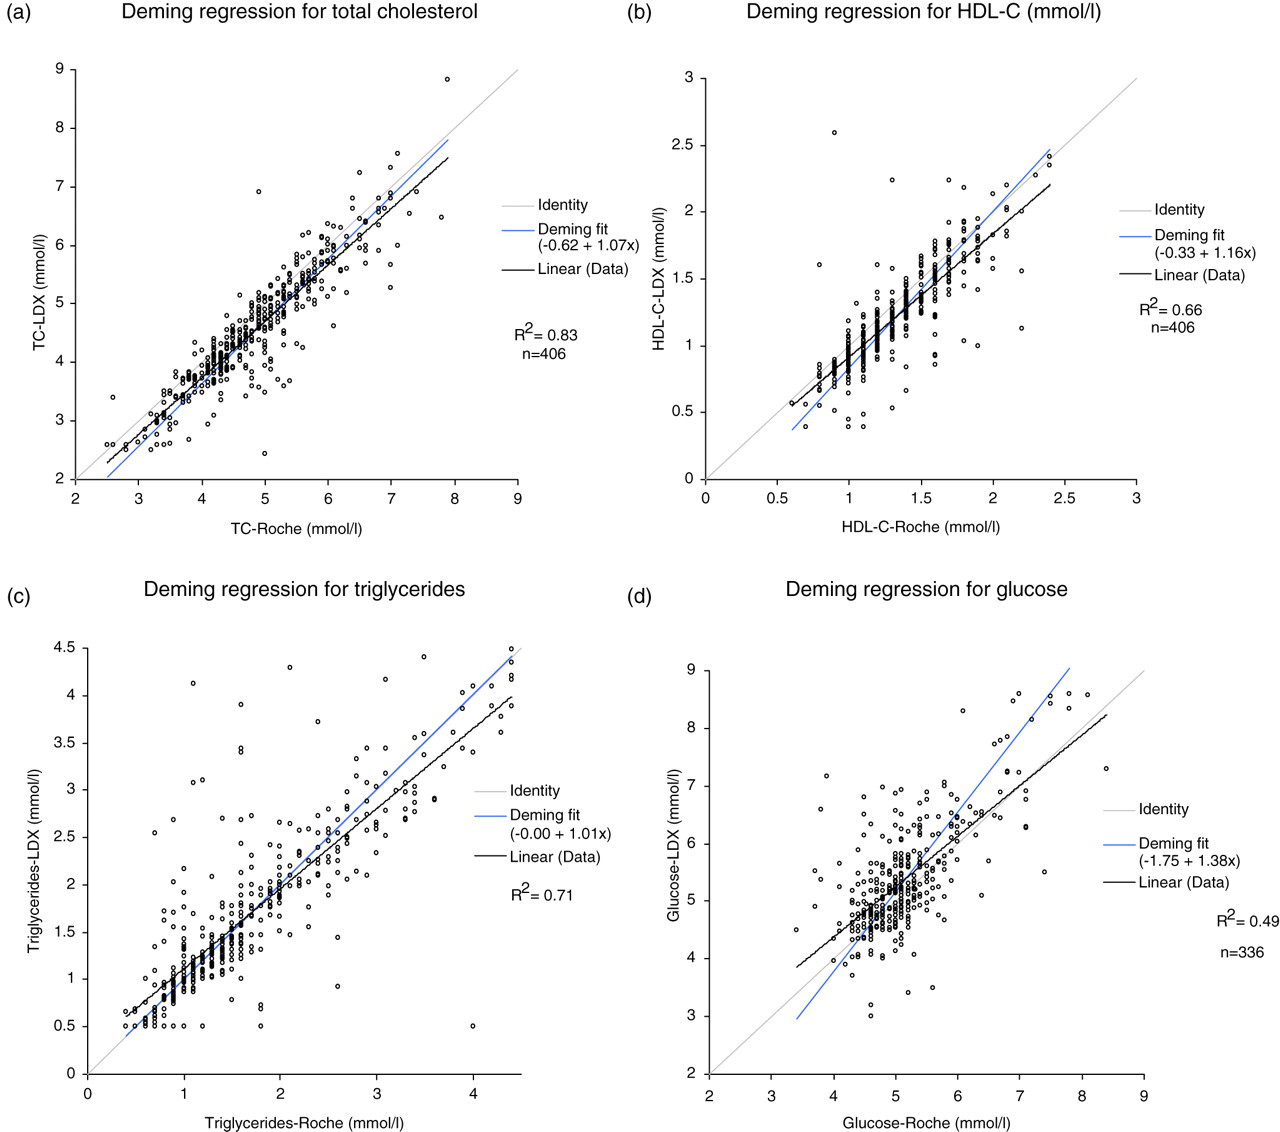
Comparison of point of care testing (POCT) and Laboratory for: (a) total cholesterol (TC), (b) high-density lipoprotein cholesterol (HDL-C), (c) triglycerides and (d) glucose
Difference between lipids and glucose measurement (using Bland–Altman plots)
TC, total cholesterol; HDL-C, high-density lipoprotein cholesterol; TG, triglycerides
Comparison of CVD risk calculation
Cardiovascular risk was calculated (JBS2, QRISK2, ETHRISK and Framingham) using the POCT and laboratory values. A 10-y risk of ≤10% was categorized as low risk, 11–19% as intermediate and ≥20% as high risk.
The risk was calculated in 350/406 (86.2%) subjects. The subjects (n = 56) aged less than 34 y and more than 74 y (i.e. younger or older than the limits allowed by the risk calculation engines used) as well as individuals with missing parameters were excluded. This was a high-risk population since 9.7–19.4% had a ≥20% 10-y probability of a vascular event depending on the risk engine and assay method used. The corresponding values for intermediate risk (11–19%) were 18.6–25.7%. These percentages were obtained from the range of risk calculations for each risk engine. The data were classified into HDL-C tertiles (based on POCT values): HDL-C 0.4–1.0, HDL-C > 1.0–1.3 and HDL-C > 1.3 mmol/L. Kappa coefficients were calculated in order to assess the agreement in CVD risk calculated (using POCT and laboratory methods) for each tertile.
The risk classification using POCT and laboratory agreed (κ ≥ 0.8) in 89.2%, 94.6%, 95.4% and 92.5% using JBS2, QRISK2, ETHRISK and Framingham risk calculations, respectively (Tables 2 and 3). The overall kappa coefficient on agreement was ≥0.8 for each risk calculator.
Classification differences in risk engines using point of care testing (POCT, Cholestech LDX) and laboratory methods (Roche)
Each table shows the number of subjects in each risk category with (%) in parenthesis
*Weighted kappa = 0.86
†Weighted kappa = 0.92
‡Weighted kappa = 0.94
¶Weighted kappa = 0.88
Overall risk agreement
JBS2, Joint British Societies’ 2 risk
Using the JBS2 calculator, risk agreed in 89.2% of the individuals using the POCT and laboratory values. The overall kappa coefficient of agreement for JBS2 was considered good (κ = 0.86). The majority (23/38; 60.5%) of the 10.9% subjects who had a mismatch in their classification had a HDL-C concentration of 0.4–1.0 mmol/L.
The QRISK2 agreed in 94.6% of the subjects. The kappa coefficient on agreement was κ = 0.92. Of the 5.4% of the subjects with a mismatch in their risk classification, 12/19 (63.2%) were in the 0.4–1.0 mmol/L HDL-C concentration category.
The ETHRISK agreed in 95.4% subjects. The kappa coefficient for ETHRISK was good (κ = 0.94). Of the 4.6% of subjects with a mismatch in their risk classification, 11/16 (68.8%) were in the 0.4–1.0 mmol/L HDL-C concentration category.
The Framingham risk score agreed in 92.6% subjects. The kappa coefficient for agreement was κ = 0.88. Of the 7.4% of subjects with a mismatch in their risk classification, 15/26 (57.7%) were in the 0.4–1.0 mmol/L HDL-C concentration category.
At HDL concentrations of 0.4–1.0 mmol/L, the agreement was slightly lower than at concentrations >1.0 mmol/L which is consistent with our finding of analytical bias of −0.2 mmol/L at this tertile. At a higher HDL-C concentration the bias decreased and the agreement in the risk calculation increased.
Evaluation of potential causes of bias
The analytical bias observed between two methods (POCT versus laboratory) can be attributed to the difference in the collection process (capillary versus venous blood) and methodology involved. The Cholestech LDX measures HDL-C using dextran sulphate-Mg2+ precipitating reagent, 19 whereas the automated Roche method uses PEG-modified enzymes and dextran sulphate for HDL-C direct determination. 20,21 We checked the reproducibility of the POCT (n = 10) and laboratory method (n = 20) and the CVs were similar (see Materials and methods).
Glucose was measured by a glucose oxidase method both on the Cholestech LDX and the hospital laboratory's Roche analyser. However, differences may occur due to sample type (capillary sample for Cholestech LDX and venous sample for laboratory) and the longer delay for the laboratory sample. 22,23
The subjects who had a mismatch in their CVD risk classification were reviewed. The mismatch was mainly attributable to the difference in HDL-C concentrations measured by the two methods.
The majority of the mismatched CVD risk calculations was also from the initial screens (June to September 2008) compared with the second batch of screening (March to June 2009). A total of 150 subjects were screened in the first period and 200 subjects in the second screening period. The number of disagreements is shown in Table 4.
Number of risk disagreements using POCT versus laboratory-based testing
P values were derived using the Fisher test
JBS2, Joint British Societies’ 2 risk; POCT, point of care testing
Discussion
Laboratory methods have been extensively used for the evaluation of biochemical markers of CVD risk. This is convenient in a hospital set-up. However, when mass screening is required, a laboratory-based approach has limitations (e.g. transport and storage of sample, delay in obtaining the results and the need to contact individuals again for consultation resulting in poor compliance). On the other hand, by using POCT these difficulties are overcome.
Comparison of POCT versus laboratory
Overall agreement between results obtained by Cholestech LDX analyser and laboratory were very good for the analytes in question, with the possible exception of HDL-C at concentrations <1.0 mmol/L.
Comparison of CVD risk calculation
CVD risk was calculated using four different web-based risk calculators (JBS2, QRISK2, ETHRISK and Framingham).
This was a high-risk population since more than one-third had either a high (≥20%) or intermediate (11–19%) risk of a vascular event over the next 10 y. There was excellent agreement in the calculated CVD risk using POCT and laboratory values with weighted Kappa values >0.8 for all four risk calculators used.
At HDL concentrations of 0.4–1.0 mmol/L, the agreement was slightly lower than at concentrations >1.0 mmol/L using all-risk calculators. The difference in estimated risk arose due to the lower HDL-C concentration measured by POCT. It is of interest that a considerable difference in HDL-C values was observed when seven laboratory-based methods were compared in another study. 24 These differences were more obvious at low HDL-C levels, 24 as in our study. The reasons for this phenomenon are not clear but may involve associated hypertriglyceridaemia or abnormal lipoprotein. 24 It is therefore important to realize that there may be considerable differences in HDL-C estimation even when two laboratory-based methods are compared. 24
Mean differences in glucose measurements were significant in all three tertiles; the differences were −0.2, +0.2 and +0.7 mmol/L, respectively. The reasons for the variation in glucose values when comparing POCT with the laboratory-based values are not obvious. It would be expected that the capillary sample (LDX) would have a lower glucose value than the venous sample (laboratory testing). However, the venous sample was separated/analysed after a delay during which the glucose level may have fallen slightly. Furthermore, there may be subtle differences in the methodologies although both the LDX and laboratory used a glucose oxidase based assay.
This study tested how accurate POCT results would be in a primary care setting compared with results analysed in samples transported to a hospital laboratory. The samples were preferably analysed the same day or were centrifuged and the serum was stored in a refrigerator (2–8°C) to be analysed at a later date (within 48 h). One important consideration in the primary care/community setting is operator training. This opinion is supported by our finding that reproducibility improved with operator experience. Sufficient training of staff in the safe operation and maintenance of the POCT equipment should be provided. Furthermore, SOP should be fully documented. Quality assurance measures, both internal and external, need to be established. 25 Support from a local clinical laboratory is useful for ongoing training and quality assurance.
We conclude that POCT technology for initial screening of risk factors is appropriate for The NHS Health Check programme. However, POCT analysers can provide additional benefits beyond their analytical role: prompt results allow for immediate feedback and can potentially enhance positive interaction between health-care providers and patients. Additionally, POCT is an opportunity to provide individualized lifestyle advice. Also, the small quantities of blood sample required for analysis are an advantage.
The cost-effectiveness needs to be assessed by comparing overall POCT versus hospital laboratory costs and this was beyond the scope of the current study. However, the inconvenience for patients, the potential for sample and result loss and delay in initiating treatment are difficult to estimate.
When used appropriately, POCT testing can improve patient management and optimize screening services. 14
DECLARATIONS