
Abstract
Background
Interfering substances such as haemoglobin, bilirubin and lipids in a sample may lead to wrong interpretation of immunoassay results by the clinician. In general, there has been minor attention to these interferences on immunoassays, whereas these effects on chemical assays are frequently described. Information about interferences by haemoglobin, bilirubin and lipids on the Siemens Immulite 2500 assays in the instructions for use is falling short.
Methods
Interferents in patient samples can be measured reliably in a semi-quantitative way on most chemistry analysers and can be expressed in haemolysis-, icterus- and lipaemia-indices. As the Immulite 2500 cannot perform such measurements, samples are normally analysed without testing for the presence of interferents. Therefore, a study was carried out to examine these interferences on 24 Immulite 2500 assays. Samples were spiked with increasing concentrations of either haemoglobin, bilirubin or lipids. The haemolysis-, icterus- and lipaemia-indices were measured on a Synchron DxC 800 analyser.
Results
Based on analytical imprecision and intraindividual biological variation of each analyte, cut-off indices above which clinically significant interference exists were determined. We found clinically significant interference due to haemoglobin on ferritin and folate, by bilirubin on oestradiol and testosterone and by lipids on testosterone.
Conclusions
Introducing cut-off indices prevents reporting of wrong Immulite 2500 results due to interference. Our results are applicable in laboratories using any chemistry analyser capable of reporting semi-quantitative concentrations of interferents.
Introduction
Erroneous results of immunoassays due to interference by endogenous or exogenous substances is an underrated problem. 1 The most important endogenous compounds that can interfere with immunoassays are autoantibodies, heterophilic antibodies like human anti-mouse antibodies, M-proteins, haemoglobin, bilirubin and lipids. 2 Numerous papers deal with interference by antibodies or M-proteins, but few describe interference by haemoglobin, bilirubin and lipids. 3–5
The presence of haemoglobin, bilirubin or lipids in a serum or plasma sample can have a profound effect on the result of the assay: it can increase or decrease the result of an immunoassay in such a way that it leads to wrong interpretation by the clinician of the health status of patients.
The Immulite 2500 instrument (Siemens Healthcare Diagnostics, Los Angeles, CA, USA), a dedicated immunoassay analyser, cannot quantify interferences. At the same time, the information provided by Siemens in the instructions for the use of the immunoassays is limited. The instructions for the use of many tests only provide minimal information, such as: ‘Presence of hemoglobin in concentrations up to 384 mg/dl has no effect on results, within the precision of the assay’. The instructions for use of folate, for example, contain a table with the conclusion that only low concentrations of folate can be analysed and conclude: ‘Hemolyzed samples are unsuitable for serum folate determinations’.
Recently, we performed a study on the effects of haemoglobin, bilirubin and lipids on chemical assays carried out on the Synchron LX-20 analyser (Beckman Coulter, Brea, CA, USA). 6,7 This analyser can perform semi-quantitative spectrophotometric measurements of the degree of haemolysis, icterus and lipaemia in patient serum or plasma samples. The system quantifies the serum condition by measuring the absorbance of the sample using several wavelengths and underlying mathematical algorithms and presents them as index values. These values are presented as dimensionless numbers called the H-index (haemolysis level 0–10), I-index (icterus level 0–20) and L-index (lipaemia level 0–10) and have a nearly linear correlation with increasing concentrations of the specific interfering compound. The index function is not intended for diagnostic purposes, but is used for semi-quantitative analysis of sample condition. To study the effect of an interferent as a function of its concentration, the analyte can be measured in a sample spiked with increasing concentrations of the interferent, and the relative deviation of the result from that in the native sample can be calculated. A graphical representation of this relation is called an ‘interferogram’. Such graphical displays of analyte and instrument-specific interferences were published as early as 1986 by Glick et al. 8
In the present study, effects of the mentioned interferents on 24 most used immunoassays on the Immulite 2500 were investigated in the laboratories of two Dutch hospitals, Bronovo and Maasstad. By using interferograms, as described above, we could easily decide on cut-off indices based on analytical imprecision above which analytically significant interference exists. However, analytically significant interference will not always mean clinically significant interference. Analytically significant interference may lead to frequent flagging of results and many insignificant comments. Therefore, based on analytical imprecision and intraindividual biological variation, also cut-off indices above which clinically significant interference exists were determined. Our goal was to establish cut-off indices that can be widely applied.
Materials and methods
Analysers
The Immulite 2500 (Siemens) is a fully automated immunoassay analyser that carries out tests as solid phase competition and sandwich enzyme immunoassays. The test panel contains 95 assays. The multichannel Synchron DxC 800 analyser (Beckman Coulter) is a fully automated system designed for the analysis of routine chemistries, therapeutic drugs and the H-, I- and L-indices. This analyser is able to detect haemolysis, icterus and lipaemia in samples and can generate semi-quantitative index values (so-called serum indices) as a measure of the concentration of these interfering substances. The scale is 0–10 for haemolysis (range 0–0.29 mmol/L or 0–5 g/L haemoglobin), 0–20 for icterus (range 0–500 μmol/L bilirubin) and 0–10 for lipaemia (range 0–4 g/L Intralipid or 0–12 mmol/L triglycerides). The handling of H-, I- and L indices on the current DxC 800 analyser is the same as on the LX-20 analyser. 6,7
Analytes investigated
The following 24 analytes were investigated: α1-fetoprotein, Alatop (screening for inhalation allergens), cancer antigen (CA) 125, CA 15.3, carcino embryonic antigen (CEA), cortisol, ferritin, folate, food panel 5 (screening for food allergens), free thyroxine (FT4), follicle stimulating hormone (FSH), human chorionic gonadotropin (hCG), luteinizing hormone (LH), N-terminal-pro B natriuretic peptide (NT-proBNP), oestradiol, progesterone, prolactin, prostate specific antigen (PSA), triiodothyronine (T3), testosterone, total IgE, troponin-I, thyroid stimulating hormone (TSH) and vitamin B12.
Interference studies
The influence of haemoglobin, unconjugated and conjugated bilirubin and lipids was evaluated on 24 Siemens Immulite 2500 tests (analyser software version 5.6) in two Dutch hospital laboratories. Experiments were carried out with test samples from two different serum pools spiked with haemolysate, bilirubin or Intralipid, according to the CERMAB protocol. 9 For all analytes studied, pooled patient serum samples without any detectable interference at a low and a high analyte concentration were used. In general, we tried to make serum pools with concentrations within decision ranges. Subsequently, 2700 μL aliquots from the serum pool were mixed with 300 μL of a mixture of 0.9% NaCl and a stock solution of interferent, of which the fraction stock solution gradually was increased in eight steps from 0 to 1. Haemoglobin was added as erythrocyte haemolysate prepared by osmotic disruption with distilled water. Bilirubin was added as unconjugated bilirubin (catalogue no. 24519, Merck, Amsterdam, The Netherlands) as well as the conjugated analogue ditauro bilirubin (B580 bilirubin ditaurate disodium salt, Porphyrin Products Inc, Logan, UT, USA) to mimic the effect of conjugated bilirubin. Conjugated bilirubin is more soluble than unconjugated or free bilirubin, which binds to a large extent to albumin in plasma. As such, conjugated bilirubin is more likely to interfere with chemical reactions. 10 Bilirubin stock solution was made by dissolving 1462 mg bilirubin in 5 mL 0.1 mmol/L NaOH in the dark. Then this solution was quickly diluted to 25 mL with a 1:1 mixture of 20 mmol/L NaOH and 5 mmol/L EDTA resulting in a stock solution of 10,000 μmol/L bilirubin. From this stock solution, 1 mL portions were made and kept in the dark at −80°C. Intralipid (Pharmacia, Milton Keynes, UK) was used to mimic lipaemia. Intralipid 20% is a commercially available, long-chain triglyceride emulsion derived from soy bean oil, containing triglycerides and a phospholipid emulsifier derived from egg yolk (200 g of soy bean oil, 12 g of egg yolk, 25 g of glycerol). Although Intralipid does not perfectly mimic the effects of in vivo lipaemia, it is the best substitute available and is widely used in interference studies. 11,12 A series of eight samples, with an increasing concentration of interferent, was prepared in duplicate in one hospital and frozen. One set of samples was sent to the other participating hospital. The next day analyses were carried out in duplicate in both hospitals, yielding a total of four results per analyte–interferent combination. In this way, all analytes listed above were assayed. In general, we followed the approach described in our investigation of interference on LX-20 assays. 6,7
For lipaemia we used the triglyceride concentration instead of the L-index, because Siemens describes in their instructions for use triglyceride concentrations up to 60 mmol/L, which are much higher than the concentration of about 12 mmol/L that matches the highest reported L-index of 10. The H-index in the sample with the highest haemoglobin concentration was about 10, the I-index in the sample with the highest bilirubin concentration was about 20 and the triglyceride concentration in the sample with the highest triglyceride concentration was about 60 mmol/L. To diminish interference by lipids, we used high-speed centrifugation. Samples were centrifuged three times for 15 min at 16,000
To exclude the possibility of (pre)analytical mistakes, e.g. bad pipetting, we also measured an analyte not influenced by the presence of interfering substances, e.g. potassium or glucose.
Statistics
Individual outliers were eliminated using a two-sided Dixons Q-test at P = 0.10. This was done starting from the four normalized results for one interferent concentration until no outlier was detected. Relative results were calculated using the average of the resulting normalized results from the two hospitals for one interferent concentration. For this purpose, results for the native sample were set at 100%. Finally, resulting relative averaged concentrations were plotted against the indices found for different interferent concentrations.
We defined analytically significant interference when the result in the presence of the interferent differs more than twice the analytical CV (CVa, found during the validation of our Immulite 2500 instrument) from the result without the interferent. The index or interferent concentration above which there is analytically significant interference is called the analytical cut-off index or concentration. We defined clinically significant interference when the result in the presence of the interferent differs more than 1.96 × (CVa 2 + CVw 2)½ from the result without the interferent. 13 Half of this deviation we call the combined CV (CVc). The index or interferent concentration above which there is clinically significant interference is called the clinical cut-off index or concentration. CVw-values are from Ricos et al. 14 Table 1 shows analytical CVa-values (%) at two analyte concentrations, intraindividual biological CV(within)-values (%) and CVc-values for clinically significant interference (%) for all analytes investigated.
Overview of analytical CVa-values (%) at two concentrations, intraindividual biological CVw-values (%) and CVc-values for clinically significant interference (%)
For some assays, there are no coefficients of intraindividual biological variation available (–)
CA, cancer antigen; CEA, carcino embryonic antigen; FSH, follicle stimulating hormone, FT4, free thyroxine; hCG, human chorionic gonadotrophin; LH, luteinizing hormone; NT-proBNP, N-terminal-pro B natriuretic peptide; PSA, prostate specific antigen; T3, triiodothyronine; TSH, thyroid stimulating hormone
Results
The relationship between the concentration of the three interfering substances and the corresponding indices as found by Beckman Coulter on the DxC 800 and confirmed by this study is illustrated in Table 2. The relation between L-index, Intralipid concentration and triglyceride concentration shows some variation within different patient samples. This table also indicates the prevalence of the different indices. Table 3 gives an overview of all analytes investigated together with their low and high native concentrations. As described in the Materials and methods section, the CVa and CVc values are used to decide on the existence of analytically and clinically significant interference, respectively.
Relation between H-, I- and L-indices, interferent concentration and prevalence of the occurrence of different indices
Prevalence of a specific index is the number of samples with this index compared with the total number of samples (n = 60,000) expressed as a percentage. Prevalence is investigated over a period of six months. Concentrations of interferents (with concomitant prevalence) that in most cases are not visible to the eye are indicated as NVE
Overview of all analytes with native concentrations of serum pools investigated
CA, cancer antigen; CEA, carcino embryonic antigen; FSH, follicle stimulating hormone; FT4, free thyroxine; hCG, human chorionic gonadotrophin; LH, luteinizing hormone; NT-proBNP, N-terminal-pro B natriuretic peptide; PSA, prostate specific antigen; T3, triiodothyronine; TSH, thyroid stimulating hormone
As an example of how all 96 investigations were carried out, Table 4 and Figure 1 show the results for the interference of haemolysis on folate. The table and figure demonstrate that this influence is more pronounced at low concentrations of folate than at higher concentrations. Table 5 summarizes the analytically and clinically significant interferences we found.
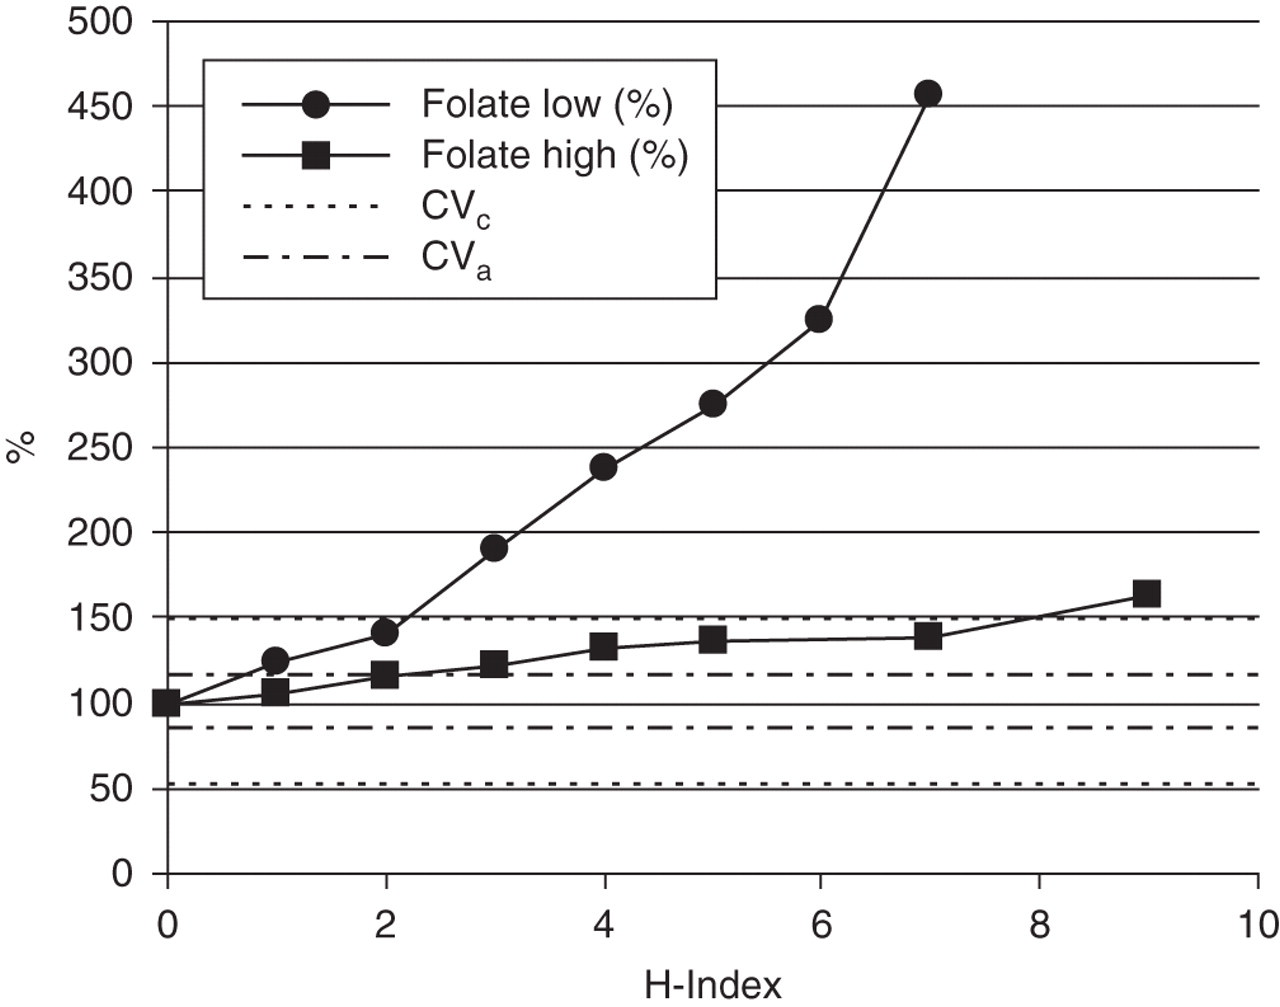
Interference of haemolysis on folate measurements. Results are expressed as the average percentage measured in two laboratories. Horizontal lines (–-–) confine the area of analytical dispersal of folate. Folate measurements have analytical interference by haemolysis above the cut-off of 1. The horizontal lines (….) confine the area of intraindividual dispersal of folate. Folate measurements have clinical interference by haemolysis above the cut-off index of 2
Folate results as measured in two laboratories in two samples
The columns headed by ‘%’ show the percentage of folate compared with the native sample
H-index, Haemolysis index
Overview of analytically and clinically significant interferences
Cases where interference is not visible to the eye are indicated with‘NVE’ behind the index. A ‘-’ means that haemolysis or lipaemia is stronger than correlates with an H- or I-index of 10, and so the prevalence is not known, but very low. In some cases the amount of interference depends strongly on the analyte concentration. E.g. at a folate concentration of 6.0 nmol/L there is analytically significant interference at and above an H-index of 1 (0.02 mmol Hb/L), while at a folate concentration of 31 nmol/L there is analytically significant interference at and above an H-index of 3 (0.08 mmol Hb/L). Cumulative prevalence (%): 100 % minus the sum of all prevalences with an index equal to the cut-off index and higher. LH, luteinizing hormone
Table 6 demonstrates the effects of high-speed centrifugation on the results of interference of lipaemia on Alatop, progesterone and testosterone.
Effects of high-speed centrifugation on assays prone to interference by lipaemia in lipaemic samples with a triglyceride concentration of 24.4 mmol/L
The question as to whether deviation of the concentration of an analyte with interferent from that in the native sample is only caused by interference or also by the way in which the samples are prepared, is answered by carrying out analyses that are not influenced by the interferent, such as glucose or potassium. Figure 2 demonstrates that the decrease in testosterone is the result of interference by triglycerides and because of the stable potassium, not caused by the way in which the samples were prepared.
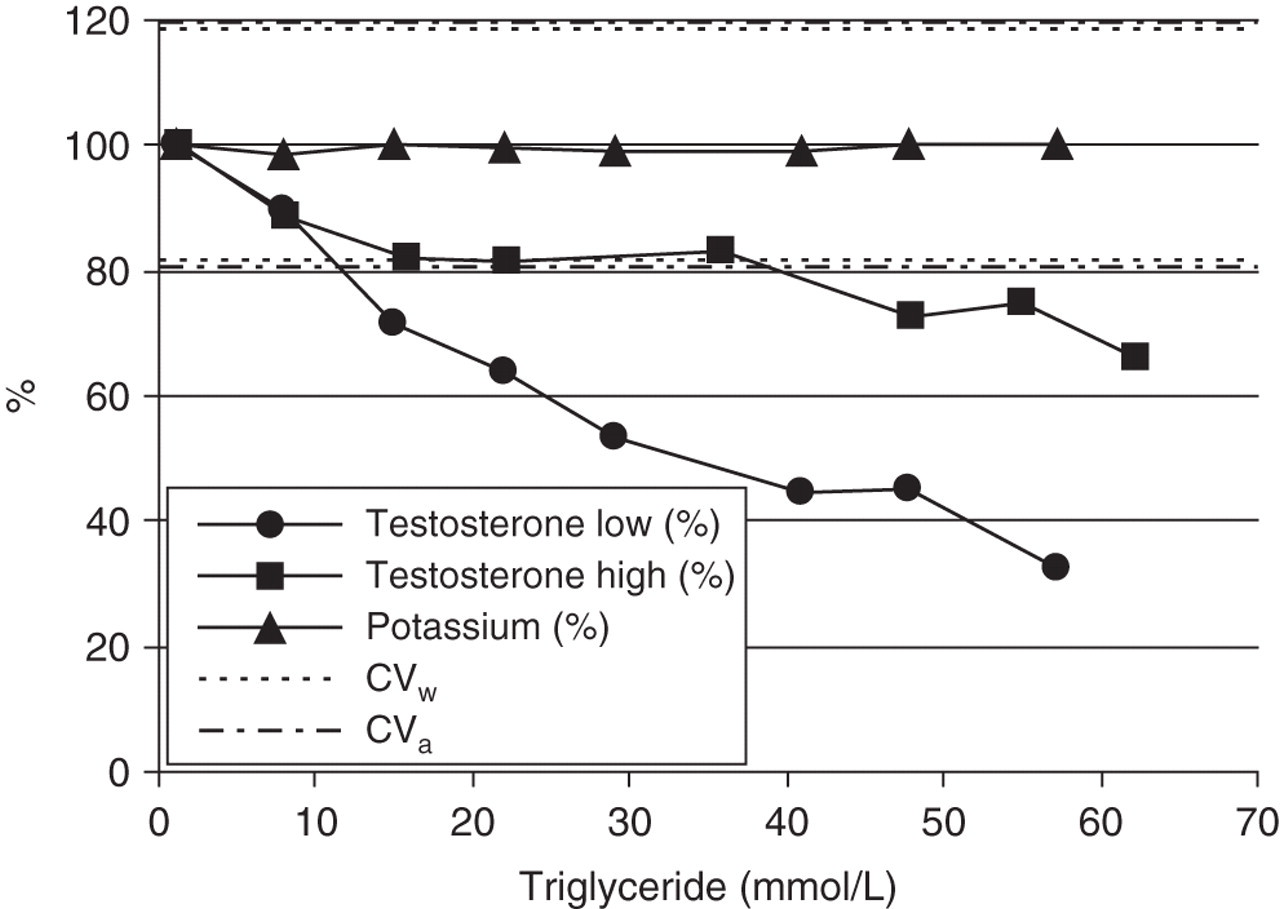
Course of testosterone and potassium with increasing triglyceride concentration
Discussion
Clinically significant interference due to haemolysis, icterus and lipaemia occurs in some immunoassays on the Immulite 2500 system. This study clearly demonstrates that samples for immunoassays should be tested for the presence of interferents, while relevant according to Table 5. The most pronounced effect was observed with folate. In daily practice the colour of each patient serum or plasma sample is not checked before performing an immunoassay. Haemolysis matching a H-index up to 2, icterus matching an I-index up to 3 and lipaemia matching a L-index up to two are in most cases not visible with the naked eye but even these low concentrations of interferents can cause significant interference. Therefore, the H-, I- and L-indices should be automatically measured, depending on the assays requested. In this respect, instruments that combine general chemistry tests and immunoassays have a distinct advantage over other configurations.
Of the clinically significant interferences by haemolysis (Table 5), only the effect on folate occurs with some prevalence. The mechanism of interference is additive; the folate in erythrocytes is co-measured with the folate in serum or plasma. Although the influence of haemolysis at high concentrations of folate is relatively smaller than at low concentrations, the importance of the assay is in the detection of deficiencies. To avoid folate-deficient patient samples showing falsely normal results, all haemolytic samples with an H-index above the cut-off index of 2 should be excluded from analysis. When measuring folate, the H-index can be used to predict the increase in folate concentration caused by haemolysis. Since every elevation of the H-index causes elevation of folate with a known amount, it should theoretically be possible to use a correction factor. Nevertheless, it is preferred to analyse a fresh sample without haemolysis.
Other clinically significant interferences are the positive influence of bilirubin and ditauro bilirubin on testosterone and the positive influence of ditauro bilirubin on oestradiol. Patient samples with an I-index above the clinically significant cut-off index should be excluded from analysis.
We conclude that the use of a high-speed centrifugation procedure diminishes the negative influence of lipaemia on testosterone in such a way that the clinically significant interference does not exist anymore.
The results we found can be applied by all laboratories that use an Immulite 2500 for their immunoassays and a DxC 600, DxC 800 or LX-20 chemistry analyser, but also by labs that use any other chemistry analyser, as long as (semi-) quantitative concentrations of haemoglobin, bilirubin and lipids can be measured. For each analyser the relation between index values and concentrations of interferents should be established.
The instructions for use for the Immulite 2500 assays provide some information on interference but do not describe how this information, that is not published, is obtained. Comparison of our results with these data shows that we find analytically significant interference by haemolysis, icterus and lipaemia at higher concentrations. This is because in many cases Siemens has only looked at one concentration of interferent and maybe different criteria were used. As criterion for significant interference we defined a difference larger than twice the CVa or CVc between a result in a sample with interferent and the native sample, while Siemens does not mention any criterion. Siemens does not provide any information concerning clinically significant interference. We conclude that our data are more complete and better founded. Although fortunately we did not find many assays that are sensitive to interferents, one should stay very alert for clinically significant interference, because wrong results can lead to wrong interpretations, wrong diagnosis and even to unjust follow-up investigations and unjust procedures.
Based on our results and the way we carried out our investigation, we have the following general recommendations on how to investigate interference by haemolysis, icterus and lipaemia on (immuno) assays:
The influence of interferents should be investigated at more than one concentration level of interferent, e.g. eight concentration levels; The influence of interferents should be investigated at minimally two concentrations of the analyte (preferably normal and pathological) and these concentrations should be mentioned; Besides analytically significant interference, clinically significant interference should be investigated, so that the result of a patient sample can still be reported in case of only analytically significant interference; Besides conventional units SI units should be used, for the analyte as well as for the interferent; The influence of unconjugated as well as conjugated bilirubin should be investigated.
DECLARATIONS