
Abstract
Background
The atherogenic lipoprotein phenotype ‘pattern B’ comprises a predominance of small-dense low-density lipoprotein (sdLDL). Gradient gel electrophoresis (GGE) is considered a ‘gold standard’ method for identifying this phenotype, but is impractical for routine laboratory use. The low-density lipoprotein cholesterol:apolipoprotein-B (LDL-C:Apo-B) ratio has been advocated as a surrogate marker for sdLDL and a direct assay for sdLDL has recently become available. We compared the sdLDL assay and LDL-C:Apo-B with more established lipid parameters to predict the presence of ‘pattern B’ phenotype.
Method
Blood was collected from 97 fasted subjects on three separate occasions. Total cholesterol, triglyceride, Apo-B and sdLDL were measured; LDL- and HDL-cholesterol were determined after ultracentrifugation. The predominant LDL particle size and phenotype were assigned by GGE.
Results
‘Pattern B’ phenotype was identified in 36% of samples. Peak particle size showed a positive correlation with HDL-cholesterol and a negative correlation with triglyceride and Apo-B. Receiver operating curve (ROC) analysis showed triglyceride:HDL-C ratio and triglyceride alone to be the best predictors of ‘pattern B’ phenotype, with area under the curve (AUC) being 0.87 and 0.84, respectively. AUCs for sdLDL (0.74) and LDL-C:Apo-B (0.71) were significantly lower (P < 0.05). A high sdLDL concentration had the greatest specificity (95%) and positive predictive value (74%) for ‘pattern B’ phenotype, but low sensitivity (43%).
Conclusion
Direct measurement of sdLDL provided the most specific predictor of ‘pattern B’ phenotype, whereas triglyceride:HDL-C ratio or triglycerides alone, parameters readily available in most laboratories, were the best predictors by ROC analysis.
Introduction
The lipid profile forms an important component of cardiovascular risk assessment and treatment targets for the various lipid fractions; total cholesterol (TC), high-density lipoprotein cholesterol (HDL-C), fasting triglyceride and low-density lipoprotein cholesterol (LDL-C) are well established. 1–4 However, the LDL fraction is not homogeneous but can be subdivided on the basis of physicochemical properties including size, density and composition. 5 The presence of small dense LDL (sdLDL) has been implicated in increasing the risk of cardiovascular disease. 6,7 sdLDL by virtue of its greater permeability to the subendothelial layer, more ready oxidation and longer residence times resulting from a lower affinity for the LDL receptor, is more atherogenic than large buoyant LDL. 8
A predominance of sdLDL has been dubbed the atherogenic lipoprotein phenotype ‘pattern B’. 5 Gradient gel electrophoresis (GGE) is regarded as a ‘gold standard’ method for determining the presence of this phenotype. However, GGE along with other methods for identifying LDL subtypes, including density gradient ultracentrifugation and proton nuclear magnetic resonance (NMR) spectroscopy, 9 are unsuitable for routine laboratory practice due to cost and complexity.
Apo-B has shown promise as a marker for cardiovascular risk; in the AMORIS and INTERHEART studies it had greater predictive power than the more established risk predictors, TC:HDL-C ratio and non-HDL cholesterol. 10,11 The value of Apo-B lies in the fact that each atherogenic LDL particle contains a single Apo-B molecule and therefore it can be considered as an indicator of LDL particle number. It lacks some specificity due to the presence of Apo-B on other lipid particles, including chylomicrons, chylomicron remnants, intermediate density lipoprotein (IDL) and lipoprotein (a). An extension of this approach is the LDL-C:Apo-B ratio, considered a surrogate for LDL particle density and a low value indicating the presence of sdLDL. 12 More recently, a direct automated assay for sdLDL has become available; this is based on well-characterized detergents and enzymes that selectively react with the different lipid fractions. Both the LDL-C:Apo-B ratio and the direct sdLDL assay have the potential to simplify analysis of LDL subfractions, and thus refine cardiovascular risk assessment.
The aim of this study was to compare the capacity of a direct assay for sdLDL and the LDL-C:Apo-B ratio with more established lipid measures, fasting serum triglyceride and the triglyceride:HDL-C ratio, to predict the presence of ‘pattern B’ phenotype.
Methods
Blood samples were collected from 97 subjects with type 2 diabetes (57% men) enrolled in a comparative trial of pioglitazone efficacy. 13 The local ethics committee approved the study and all participants gave informed written consent. Blood samples were obtained after an overnight fast at study entry and at three and six months. TC and triglyceride levels were measured on an Abbott Architect c8000 (Abbott Laboratories, Abbott Park, IL, USA), and coefficient of variation was 1.2% and 3.1%, respectively. The cholesterol concentrations of lipid fractions obtained by ultracentifugation, LDL (density: 1.019–1.063 g/mL) and HDL (density: 1.063–1.21 g/mL) were determined by the same method. Apo-B was measured by an immunoturbidimetric method (Abbott Architect c8000; Abbott Laboratories), and coefficient of variation was 3.2%. sdLDL was measured on samples from the Christchurch cohort of the study, stored at −70°C, by a direct automated assay (s LDL-EX; Denka Seiken, Coventry, UK), and coefficient of variation was 6.8%. The dominant LDL particle size was determined by GGE according to the method of Krauss and Burke 5 and the presence of ‘pattern B’ phenotype assigned on the basis of this test.
Receiver operator characteristic (ROC) and statistical analyses were performed using SigmaPlot 11.0 (Systat Software Inc, San Jose, CA, USA). In all cases P values <0.05 were considered statistically significant.
Results
A total of 253 samples were obtained during the study period. The levels of LDL- and HDL-cholesterol determined after ultracentrifugation, fasting triglyceride and Apo-B were available for all samples. sdLDL was assessed in 99 samples. The lipid profiles in these patients varied markedly, with the range and median values summarized in Table 1. The ‘pattern B’ phenotype was identified in 91 (36%) samples.
Median and range of lipid values obtained from all the samples (n = 253, except sdLDL n = 99)
sd, small dense
A significant difference was found between median fasting plasma triglyceride (2.07 mmol/L) and triglyceride:HDL-C ratio (2.02) associated with ‘pattern B’ compared with ‘pattern A’ (1.28 and 1.00 mmol/L, respectively; Mann-Whitney U test P < 0.001). For these parameters there was no overlap of the interquartile ranges. In contrast, the interquartile ranges for the LDL-C:Apo B ratio and sdLDL associated with the two phenotypes overlapped suggesting that they were less discriminatory, although the medians remained significantly different (Table 2).
Median values associated with ‘pattern A’ and ‘pattern B’ phenotypes
sd, small dense
The predominant particle size showed a positive correlation with HDL-C and a negative correlation with triglyceride and Apo-B levels (Pearson product correlation coefficients 0.54, −0.44 and −0.44, respectively; all P < 0.001). The relationship between sdLDL concentration and the predominant particle size was weaker (Pearson product correlation coefficient −0.27; P = 0.01).
The ROC analysis (Figure 1) suggested that the triglyceride:HDL-C ratio was the best overall predictor of ‘pattern B’ phenotype with the largest area under the curve (AUC) at 0.87 (Table 3). The AUC for triglycerides was marginally lower at 0.84 and the sdLDL and LDL-C:Apo-B ratios both had significantly lower AUCs at 0.74 and 0.71, respectively (P < 0.05).
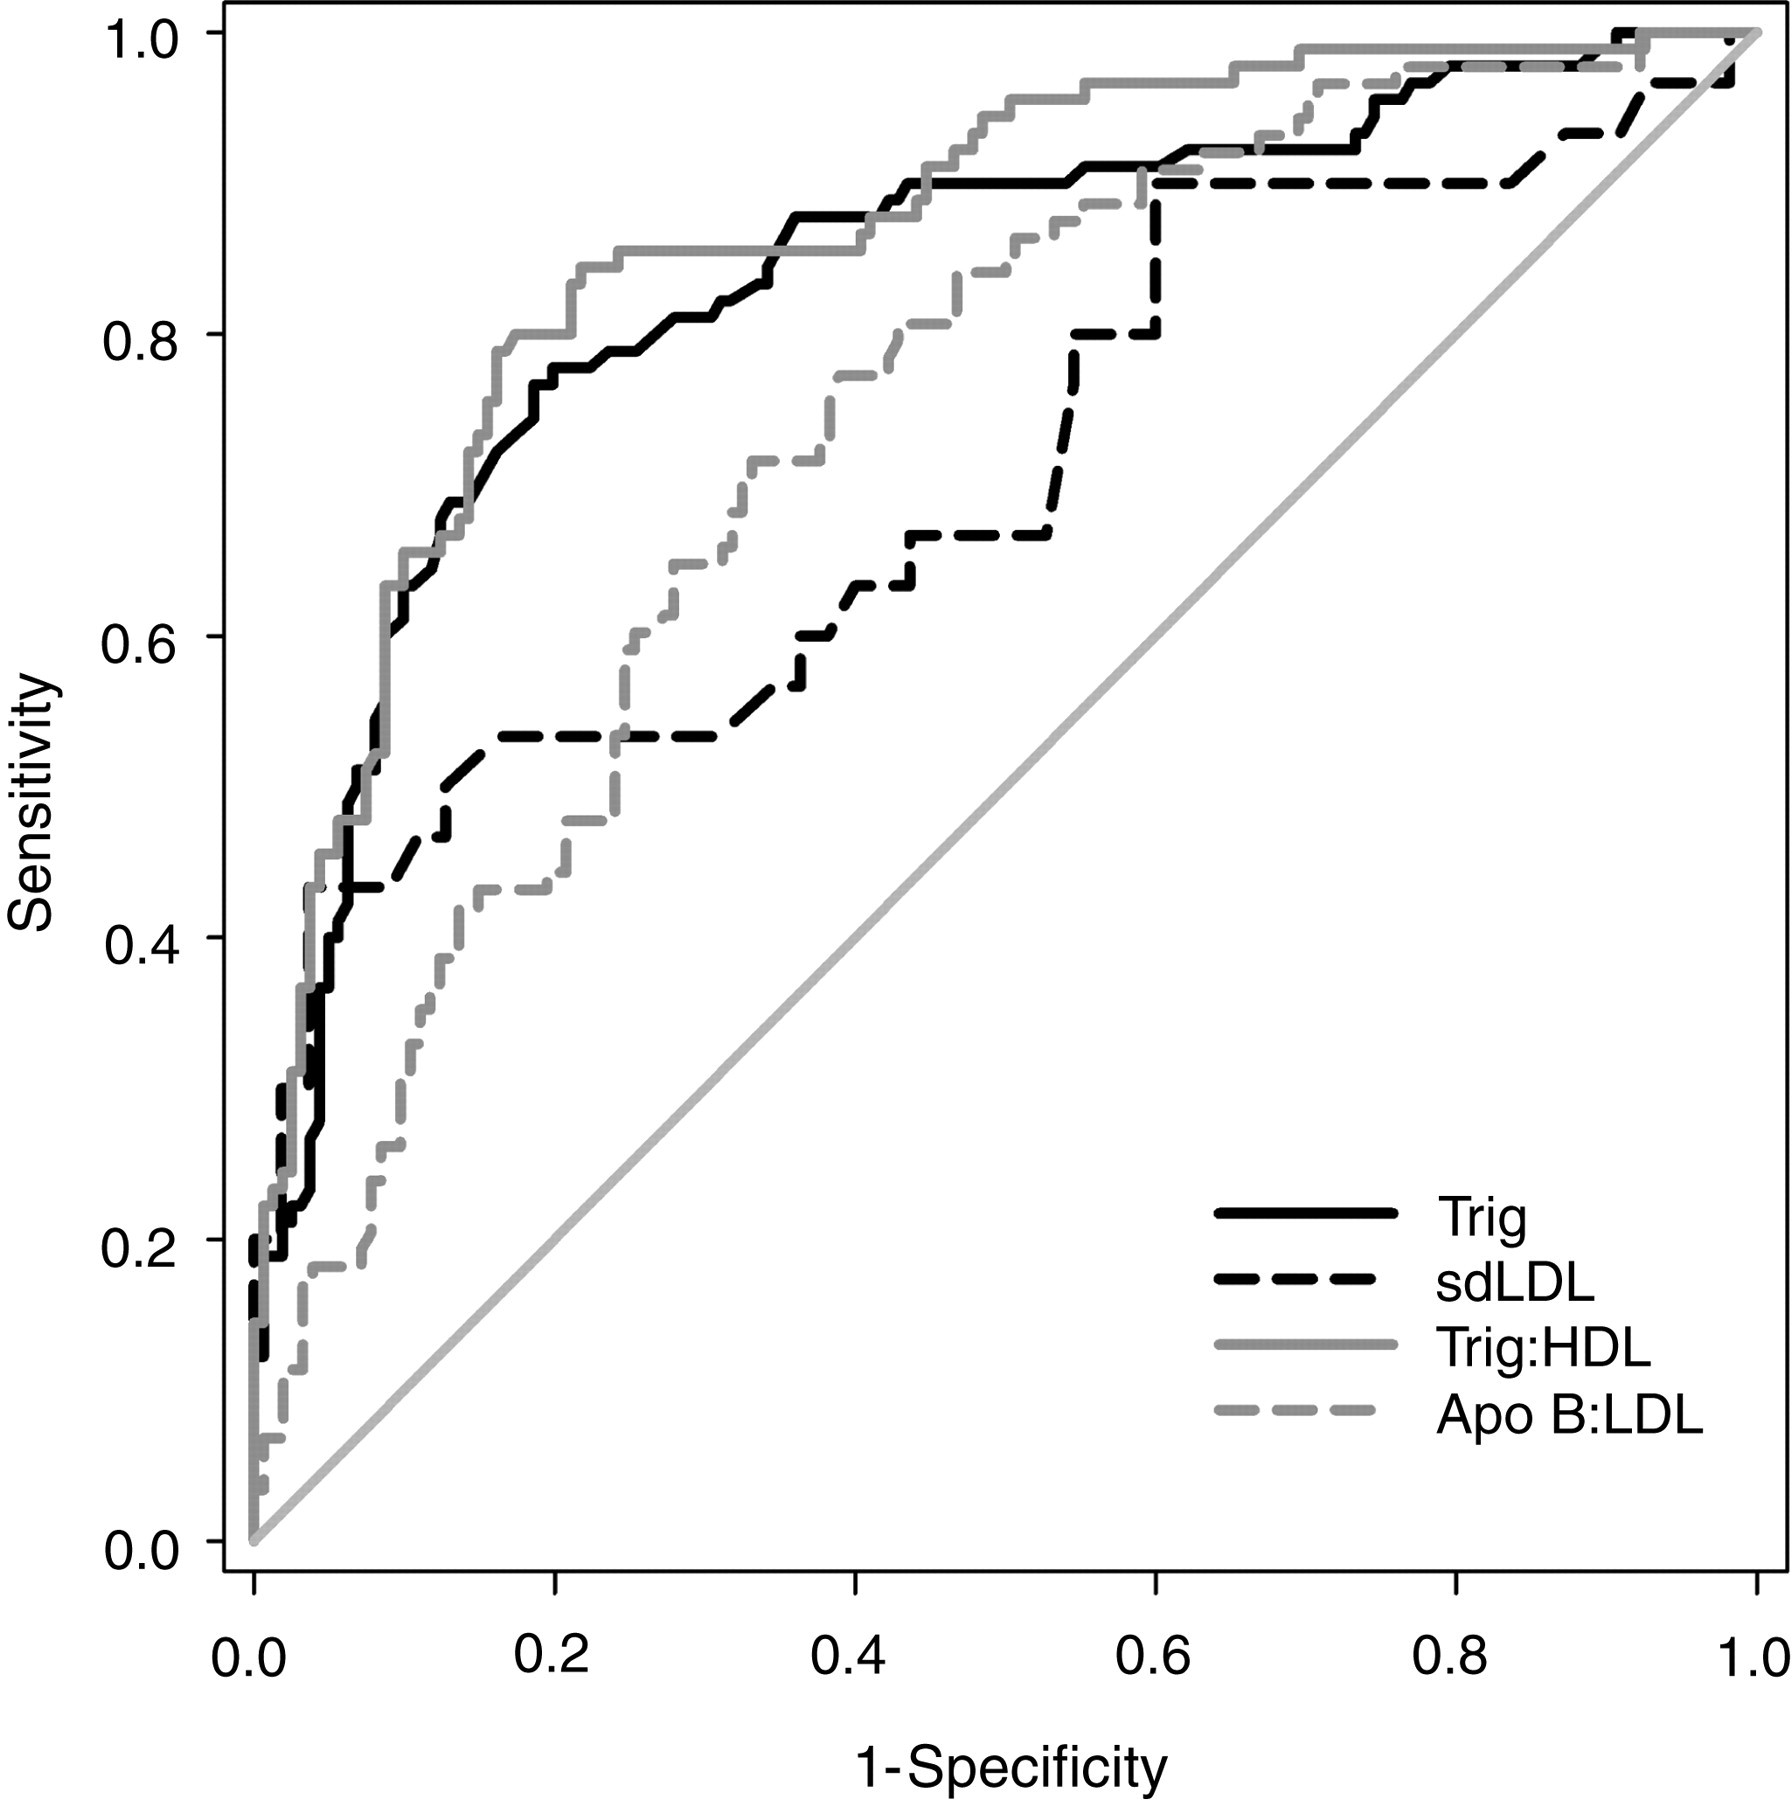
Receiver operator characteristic curves of triglyceride, triglyceride:HDL-C, sdLDL and LDL-C:Apo-B for predicting ‘pattern B’ phenotype
Area under the ROC curve (AUC) and optimum decision points with associated sensitivity and specificity for predicting ‘pattern B’ phenotype by lipoprotein variable
PPV, positive predictive value; NPV, negative predictive value; sd, small dense
*P<0.05 compared with AUC for Trig:HDL-C
Optimum decision points to identify ‘pattern B’ obtained from the ROC analysis are given in Table 3, together with the sensitivities, specificities, positive and negative predictive values. A high concentration of sdLDL (>0.75 mmol/L) had the greatest specificity for predicting ‘pattern B’ phenotype (95%), but at the cost of a low sensitivity (43%). sdLDL also had the highest positive predictive value (74%), although the positive predictive values of triglyceride and the triglyceride:HDL-C ratio were comparable. The negative predictive values for these three parameters were all similar (86–88%).
Discussion
The lipoprotein phenotype ‘pattern B’, which represents a predominance of sdLDL, has been linked to an increased risk of cardiovascular disease. Routine LDL subtype analysis is not, however, available in the clinical laboratory as the tests are expensive, time consuming and unsuitable for high sample throughputs. The development of a direct automated assay to measure the sdLDL concentration offers the potential to simplify LDL subgroup analysis and may refine cardiovascular risk assessment. This study compared a direct assay for sdLDL with more established lipid markers, including fasting triglyceride, triglyceride:HDL-C ratio and LDL-C:Apo-B ratio, to identify patients with a ‘pattern B’ phenotype.
In this study, the presence of a high concentration of sdLDL (>0.75 mmol:L) had the greatest specificity for ‘pattern B’ phenotype, but with a low sensitivity. From the ROC analysis, the triglyceride:HDL-C ratio had the highest AUC, suggesting it was the best overall predictor. At a cut-off point of 1.4 (when both parameters are measured in mmol/L) the specificity was 79% and sensitivity 80% for predicting ‘pattern B’ phenotype. Previous studies support the use of the triglyceride:HDL-C ratio as a good predictor of this phenotype, including a recent study by Vandermeersch and co-workers. 14–17 In contrast to this study, Vandermeersch found the sdLDL assay to have a high sensitivity as well as a high specificity for the ‘pattern B’ phenotype in healthy volunteers with an optimum sdLDL concentration cut-off point of 1.00 mmol/L.
Fasting triglyceride, at a cut-off point of 1.7 mmol/L, performed nearly as well as the triglyceride:HDL-C ratio in this study. Previous work has indicated that the liver preferentially produces large triglyceride-rich VLDL, designated as VLDL1, when plasma triglyceride exceeds 1.5 mmol/L. 18 VLDL1 is metabolized via IDL to sdLDL. 19 This would support the observed negative correlation between plasma triglyceride and the predominant LDL particle size. It is interesting to note that the optimum cut-off point from this study for predicting ‘pattern B’ phenotype (1.7 mmol/L) is close to the triglyceride level at which this switch to VLDL1 production occurs. The positive correlation observed between the predominant LDL particle size and HDL-C acts to strengthen the predictive power of the triglyceride:HDL-C ratio over triglycerides alone. Low HDL-C is commonly associated with high triglycerides, although the pathophysiology of this relationship has yet to be established.
Despite being promoted as a possible marker for small LDL, the LDL-C:Apo-B ratio had a significantly weaker predictive power than the triglyceride:HDL-C ratio or the triglyceride concentration. This may have been due to the inclusion of IDL and lipoprotein (a) in this ‘broad cut’ LDL fraction. Both these species have a larger particle size and lower density than LDL and if present in sufficient quantities would dilute the effectiveness of this ratio to predict the presence ‘pattern B’ phenotype. Data on lipoprotein (a) were not collected in this study. Not unexpectedly, a strong correlation was observed between sdLDL and Apo-B concentrations (r 2 = 0.52), although Apo-B alone was not predictive of a ‘pattern B’ phenotype.
The poor performance of the sdLDL assay was largely due to the low sensitivity; calculation of the proportion of sdLDL as a fraction of total LDL (sdLDL/total LDL) failed to improve its predictive power, giving the same AUC (not shown). Although fewer specimens were tested for sdLDL concentration, potentially affecting the assay's performance statistics, those tested were representative of the group as a whole, in that median LDL-C, triglyceride, HDL-C and Apo-B results for this subgroup were not significantly different from the median values of the entire group. Despite these shortcomings, measurement of sdLDL concentration may still be pertinent for determining cardiovascular risk. ‘Pattern B’ phenotype is a qualitative measure indicating the predominance of sdLDL particles; it provides no information on the absolute concentration of sdLDL present and as inferred in the VA-HIT trial, the concentration of sdLDL may be the more important consideration. 7 When reviewing studies involving LDL subgroup analysis, the lack of standardization in measuring LDL particle size should be kept in mind, a fact recognized in a recent report on emerging risk factors in cardiovascular disease from the National Academy of Clinical Biochemistry. 20 The VA-HIT study used NMR spectroscopy, a method that has subsequently been shown to give 5 nm smaller diameters for sdLDL compared with GGE and interestingly appears to have a small advantage for predicting adverse cardiovascular outcomes. 21 Outcome studies linking sdLDL measured by a direct assay with cardiovascular events are yet to be undertaken.
A potential limitation of this study was that all the subjects had type 2 diabetes. Patients with diabetes are at higher risk of cardiovascular disease, partly explained by a higher incidence of sdLDL. While knowledge of the phenotype in these patients may not influence the clinical decision to commence lipid lowering therapy, it may be regarded as an adjunctive risk factor and influence treatment decisions in those whose risk assessment is otherwise borderline. The high insulin levels associated with insulin resistance affect lipid metabolism through the reduced activity of lipoprotein lipase, increasing the residence times of triglyceride-rich lipoproteins in the circulation and therefore raising the concentration of sdLDL. Insulin resistance is also associated with preferential hepatic triglyceride synthesis which predisposes to VLDL1 production and thus sdLDL. The effects of different lipid-lowering therapies were also not controlled for; 60% of subjects were on concomitant lipid therapy, the majority on statins. Acknowledging these limitations, the study group is representative of a population in which cardiovascular risk is likely to be considered and these factors are unlikely to have affected the associations we measured.
In conclusion, this study supports the use of the triglyceride:HDL-C ratio as the best predictor of ‘pattern B’ phenotype and one readily accessible in most laboratories. Plasma triglyceride, at a cut-off point of 1.7 mmo/L, proved nearly as good a predictor. Both measures were superior to the LDL-C:Apo-B ratio. Direct measurement of the sdLDL concentration provided the most specific measure, with the highest positive predictive value and may yet find a role in cardiovascular risk assessment.
DECLARATIONS