
Abstract
Background
Primary hyperaldosteronism (PHA) is characterized by a raised plasma aldosterone concentration (PAC) with suppressed plasma renin activity (PRA). We evaluated two renin mass methods for PHA detection compared with the PAC:PRA ratio.
Methods
Samples from patients attending a specialist hypertensive clinic were analysed by Liaison automated chemiluminescent immunoassay and Diagnostic Systems Laboratories (DSL) immunoradiometric assay (IRMA) for renin mass; I−125 radioimmunoassay of angiotensin I generated from endogenous angiotensinogen for PRA; Siemens Coat-a-count radioimmunoassay for PAC. Subjects included those on β-blockers which suppress renin, causing an equivalent biochemical picture to PHA. Aldosterone/renin ratios (ARR) were calculated for PRA, DSL and Liaison methods. The first 100 subjects were used to identify cut-off ratios ensuring maximum specificity at 100% sensitivity for PHA detection. This cut-off was retested in a subsequent population (n = 43).
Results
A Liaison renin of 5 ng/L separated PRAs of ≤0.5 from ≥0.6 pmol/mL/h. The DSL method had greater scatter. In population 1 (18 PHA), cut-off ratios of >118 pmol/ng (Liaison) and >60 pmol/ng (DSL) gave specificities of 58.5% and 61%, respectively, with 100% sensitivity. If criteria for PHA included PAC ≥350 pmol/L and excluded β-blocked subjects, specificity increased to 95.1% and 90% for Liaison and DSL, respectively. In population 2 (6 PHA), specificities for Liaison and DSL ARRs were 86.4% and 78.3%. Using the ratio with PAC and β-blocker criteria, specificities for Liaison and DSL were 97.3% and 86.5%, respectively.
Conclusions
The Liaison ARR used with PAC and β-blocker criteria provided an automatable alternative to identify the same patients as the PAC:PRA ratio.
Introduction
Primary hyperaldosteronism (PHA) is a group of disorders with inappropriately high aldosterone production that is relatively autonomous from regulation by the renin angiotensin system and is not suppressed by sodium loading. 1 The prevalence of PHA is considered to be approximately 10% of hypertensive patients 1–4 and about 1.5–3% of the general population in Europe. 5 PHA patients have higher cardiovascular morbidity and mortality than age- and sex-matched essential hypertension patients with the same level of blood pressure. 1 A recent study has demonstrated that if patients with PHA were treated with adrenalectomy or an aldosterone antagonist, the cardiovascular outcome improved and was similar to patients with essential hypertension. 6 A robust screening test for PHA in hypertensive patients is therefore required and the most reliable method of screening for PHA available at present is the aldosterone/renin ratio (ARR) that was first described by Hiramatsu et al. 7
Plasma renin has traditionally been estimated by manual assays of plasma renin activity (PRA) with a long incubation time and consequently long turnaround times. It is also affected by the endogenous substrate (angiotensinogen) concentration that may be elevated in certain conditions, e.g. pregnancy. 8 The PRA assay is a time-consuming, technically demanding assay that cannot be automated as it involves substrate generation followed by radioimmunoassay (RIA). Despite these characteristics, PRA is still considered the ‘gold standard’ for renin measurement as it is more precise at lower concentrations of renin where the analytical sensitivity can be improved by extending the incubation time. 9 However, there is little interlaboratory comparability in PRA results numerically and the use of renin mass would enable the standardization of results with faster, simpler analysis suitable to meet the increasing demand for renin analysis. Mass methods that have been evaluated include the automated Nichols Advantage direct renin chemiluminescent immunoassay, immunoradiometric assays (Diagnostic Systems Laboratories [DSL], Bio-Rad) and the more recently available automated Diasorin Liaison method. Sealey et al. 10 reported cross-reactivity from prorenin in mass assays. Prorenin circulates at much higher concentrations than renin so this cross-reactivity could be significant at the lower end of the pathophysiological renin range, therefore, underestimating subjects with PHA. The Nichols advantage method, which is now no longer available, was reported by Hartmann et al. 11 as correlating well with PRA at low concentrations (PRA <0.5 pmol/mL/h). However, a study performed in our institution, highlighted the possibility of misclassifying PHA patients who had lower PRA values but variable results when the Nichols method was used. 12 A group in Germany evaluating the Liaison method have reported an ARR with 90% sensitivity and 83.9% specificity for the diagnosis of PHA. 13 Additional consideration of an aldosterone cut-off improved the specificity to 95.7% in their study.
Many of the existing classes of antihypertensive drugs have an effect on the renin angiotensin aldosterone axis, especially β-blockers which suppress renin, 14 therefore giving false-positive ratios and spironolactone which increases renin disproportionately to aldosterone potentially normalizing results. 15
Here we report the performance of two currently available renin mass methods, the Diasorin Liaison and DSL method compared with PRA and investigate their clinical utility in the diagnosis of PHA.
Materials and methods
PRA, aldosterone and renin mass were measured on samples from hypertensive patients who required renin and aldosterone measurements as part of their investigations in the specialist hypertension clinic at St Mary's Hospital, London. The majority of the patients were on antihypertensive therapy at the time of sampling and subjects on β-blocker therapy were included in this study. Samples were analysed for PRA and aldosterone at the time the test was requested. Ethylenediaminetetraacetic acid (EDTA) plasma samples from 2004 to 2008 stored at −20°C that had not been defrosted previously were retrieved and renin concentration was measured by the Diasorin Liaison and DSL methods. Plasma samples had been frozen within one hour of collection in keeping with the local protocol. A previous study concluded that the change in renin concentration in samples stored at −20°C was less than 5%, during the storage time of seven weeks. 16 As the lower end of the renin assay is crucial in diagnosis of PHA, all samples with low PRA were specifically selected.
Subjects were divided chronologically by date of sampling into two populations identified as population 1 and population 2, respectively. Results from population 1 were used to construct receiver operating characteristic (ROC) curves for PRA, DSL and Liaison ARR. Ratio cut-offs for the diagnosis of PHA were chosen to ensure maximum sensitivity for this screening test. The second population was used to evaluate the diagnostic efficiency of the ratio cut-offs established in population 1. As patients taking β-blockers were included in this study, this group gave false-positive ratios for all methods and a second classification was identified as ‘equivalent biochemical picture’ (EBP) of PHA. The EBP group included subjects identified as PHA, subjects who had a raised ratio due to β-blocker therapy or those with biochemical results suggestive of PHA but who were not found to have PHA on subsequent assessment. This group was considered to have PHA based solely on their biochemical results. Drug history at the time of sampling was recorded.
A diagnosis of PHA was as classified in the specialist hypertensive clinic, based on the clinical data available, including imaging with the ARR and blood pressure response to surgery and/or spironolactone. Aldosterone/renin activity ratio results were based on locally derived values with cut-offs for PHA reported as >1000 ‘possible’ or >2000 ‘very likely’ in the presence of a low PRA. These values are for aldosterone and renin reported locally in pmol/L and pmol/mL/h, respectively. An EBP was defined as a low PRA (≤0.4 pmol/mL/h) with an aldosterone of ≥350 pmol/L and a final ratio of >1750 pmol/nmol/h. The aldosterone cut-off for EBP was based on a patient cohort studied in our local laboratory where it was shown that the lowest plasma aldosterone concentration (PAC) in a subject with an adenoma was 350 pmol/L. 17 Follow-up confirmatory tests such as the salt loading test and adrenal venous sampling had not been performed in all subjects. This was a non-interventional study where renin and aldosterone measurement was requested by the hypertension clinic as a part of routine clinical practice, and the requirement for these investigations was not influenced by this retrospective, performance assessment study.
Renin mass was measured retrospectively by the Diasorin Liaison direct renin-automated sandwich chemiluminescent immunoassay (DiaSorin, Saluggia, Italy) and the DSL immunoradiometric assay (IRMA) Active Renin kit (Beckman Coulter, Inc, Brea, CA, USA). The Diasorin Liaison method has an assay time of 31.5 min and uses two antibodies: a specific mouse monoclonal antibody that recognizes both renin and prorenin and a second monoclonal antibody specific for renin. The DSL IRMA is a manual assay using two antibodies specific for renin and samples must be incubated for three hours.
PRA was measured by I−125 RIA of angiotensin I (AI) generated from the endogenous substrate angiotensinogen in the presence of an angiotensin-converting enzyme inhibitor at 37°C and pH of 5.5 over three hours. The amount of AI formed over three hours is measured by RIA as a measure of PRA. Aldosterone was measured by Siemens Coat-a-Count I−125 RIA (Siemens Healthcare Diagnostics, Los Angeles, CA, USA) and uses a polyclonal rabbit antibody with overnight incubation.
Plasma samples were analysed in duplicate using both the DSL and Liaison methods to calculate the precision of duplicates. Inter-assay variation on the Liaison was also determined by running quality control specimens in different runs (n = 13).
Six plasma samples were analysed, re-frozen and then defrosted and analysed again using the Liaison method to determine the effect of freeze thawing. A further six plasma samples were analysed, then re-frozen and allowed to thaw in an ice bath of 4°C for three hours to determine the effect of cryoactivation. Samples were re-analysed using the Liaison method after one or two cycles of cryoactivation. Sample volume was not sufficient for repeat analysis for freeze thaw and cryoactivation studies using the manual DSL assay.
Statistical analysis
Analyse-it™ for Microsoft Excel software was used for data analysis and calculation of cut-offs using ROC curves. Results from all samples were used in the method comparison study, using Passing-Bablok comparison and Spearman's correlation coefficient (non-parametric). Populations one and two were compared using statistical (Mann-Whitney U and chi-squared) tests. Cryoactivation and freeze–thaw effects were studied by calculating percentage change from baseline value.
Results
Samples from 143 hypertensive subjects were obtained (Table 1). The subjects studied included 24 subjects with a diagnosis of PHA. The characteristics of the PHA patients are summarized in Table 2. Five subjects classified as PHA had biochemical ratios in the borderline range of 1000–2000, but were considered to have PHA on subsequent assessment and investigations.
Characteristics of the entire population, populations 1 and 2 indicated as median (range) or number (%)
PHA, primary hyperaldosteronism; EBP, equivalent biochemical picture; PRA, plasma renin activity; DSL, Diagnostic Systems Laboratories
† P value in the comparison of populations 1 and 2
‡PRA <0.2 taken as 0.1 for calculation of median and P value
¶ n = 139 and 96 for entire population and population 1, respectively
Characteristics of the population with primary hyperaldosteronism (n = 24) shown as median (range) or number (%)
PRA, plasma renin activity; DSL, Diagnostic Systems Laboratories; BP, blood pressure
†PRA <0.2 taken as 0.1 for calculation of median
‡Imaging not definitive but plasma potassium, ratios and response to aldosterone antagonist very suggestive
¶Subjects were on antihypertensives at the time of the reading
Thirty of the 70 patients with low PRA (≤0.4 pmol/mL/h) were taking β-blockers at the time of sampling. Subjects on a β-blocker with a reduced PRA (≤0.4 pmol/mL/h) also had a reduced renin mass (Liaison renin <3.4 ng/L, DSL renin <7.1 ng/L).
Method comparison
PRA results ranged from <0.2 to 80 pmol/mL/h and the Liaison renin results ranged from 0.4 to 1257 ng/L. The DSL values ranged from 1.5 to 524.2 ng/L.
The Passing-Bablok fit was −0.96 + 19.06 × (95% CI of −1.26 to −0.49 and 18.43 to 20.56, respectively) for Liaison versus PRA (Figure 1a). For the PRA and DSL renin mass method comparison, the Passing-Bablok fit was 2.29 + 9.06 × (95% CI of 1.83–2.52 and 8.4–9.81, respectively) (Figure 1b). A Liaison renin of 5 ng/L separated PRAs of ≤0.5 from ≥0.6 pmol/mL/h. There was more variation at the lower end of the DSL method compared with the Liaison.
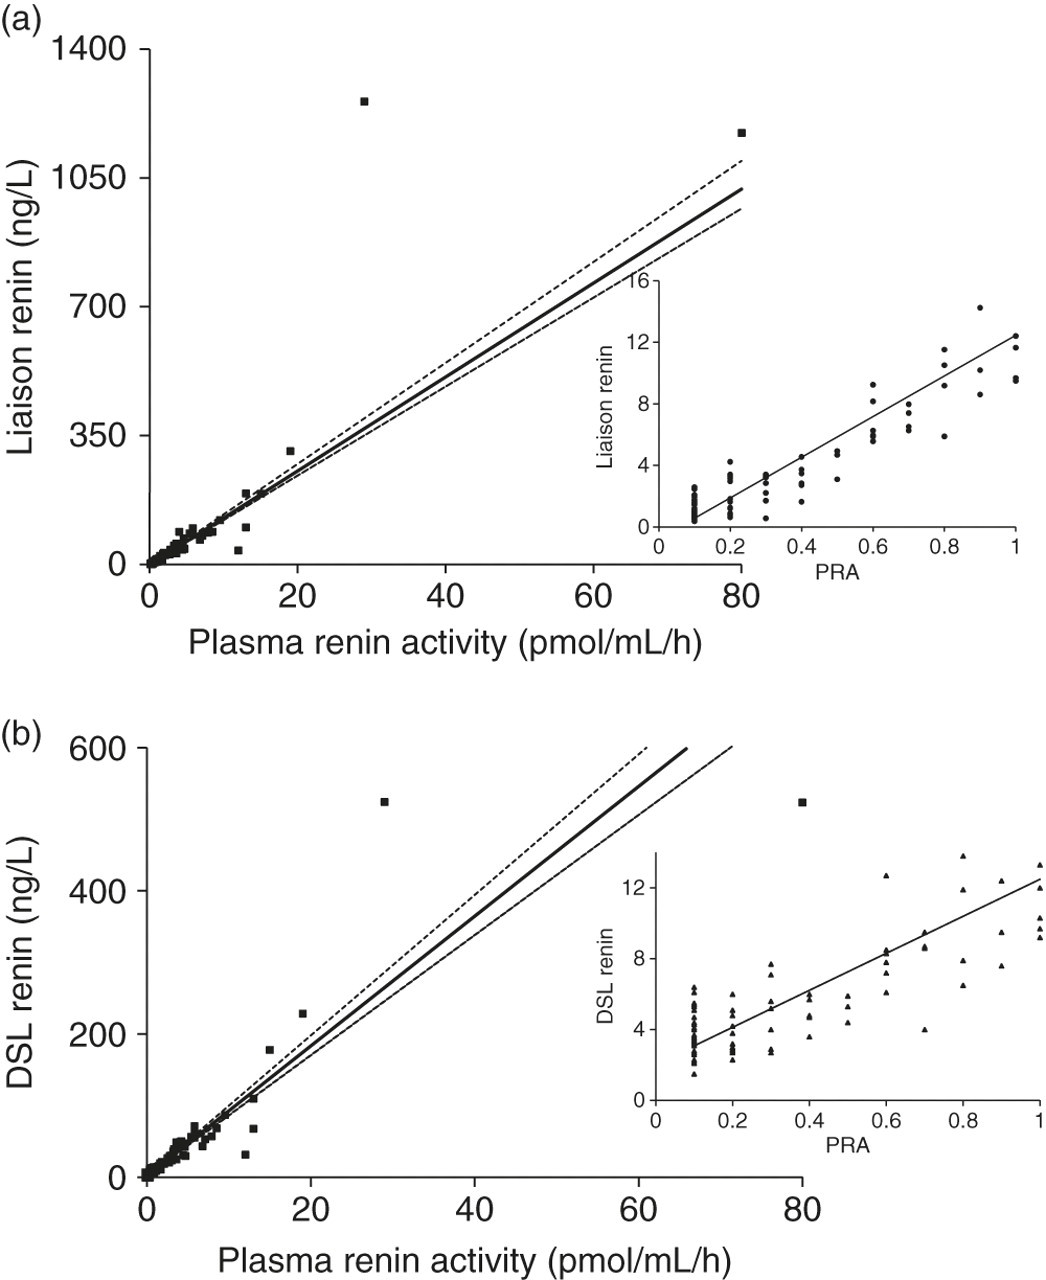
Passing-Bablok comparison for PRA versus Liaison renin (n = 143). Inset: comparison at the lower end of the range, i.e. PRA ≤1.0 pmol/mL/h (a). Passing-Bablok comparison for PRA versus DSL renin (n = 139). Inset: comparison at the lower end of the range i.e. PRA ≤ 1.0 pmol/mL/h (b). PRA, plasma renin activity; DSL, Diagnostic Systems Laboratories
Freeze-thaw and cryoactivation studies
With the Liaison method, there was a mean reduction of 13.6% (range 5.4–30.4%) in renin mass after one freeze–thaw cycle in the six samples studied. After one cycle of cryoactivation, there was a mean increase of 6.6% (range 0–20%). However, in the second cycle of cryoactivation, the renin mass reduced and the mean change was 0%, although this was variable with a range of −11% to 17%.
Imprecision
The inter-assay coefficient of variation (CV) for a PRA of 0.2 pmol/mL/h established at our institution is 7.3%. The imprecision by duplicates (CVs) for the Liaison method was 18.9%, 11.4%, 8.9% and 4.4% for mean values of 1.2, 3.3, 7.9 and 11 ng/L, respectively. For the DSL method, the imprecision by duplicates (CVs) was 9%, 5.9%, 4.6% and 4.3% for mean values of 2.9, 4.9, 7.5 and 11.4 ng/L, respectively. The inter-assay CVs (n = 13) for the quality control material for the Liaison method were 6.2% and 4.6% for mean values of 16.3 and 59.5 ng/L, respectively.
Clinical utility
ROC analysis was performed for the diagnosis of PHA in population 1 and is shown in Figure 2a. The ‘gold standard’ method PRA had an imperfect area under the curve (AUC) of 0.9 because of the false-positives, mainly due to the population taking β-blockers who gave equivalent ratios but were not classified as PHA. Cut-off ratios for the diagnosis of PHA were chosen to ensure maximal sensitivity (100%) for this screening test. For the PRA method, a ratio >1025 pmol/nmol/h gave a specificity of 81.5%. For the Liaison method, a cut-off ratio of >118 pmol/ng detected PHA with a specificity of 58.5%. The DSL method gave a specificity 61% with a cut-off ratio of >60 pmol/ng. The AUCs for the three methods are compared in Table 3. The ROC curves for EBP are shown in Figure 2b and have better AUCs because the classification was based on biochemical results alone, including subjects taking β-blockers. Three subjects in the EBP group in population 1 were not found to have PHA on subsequent assessment.
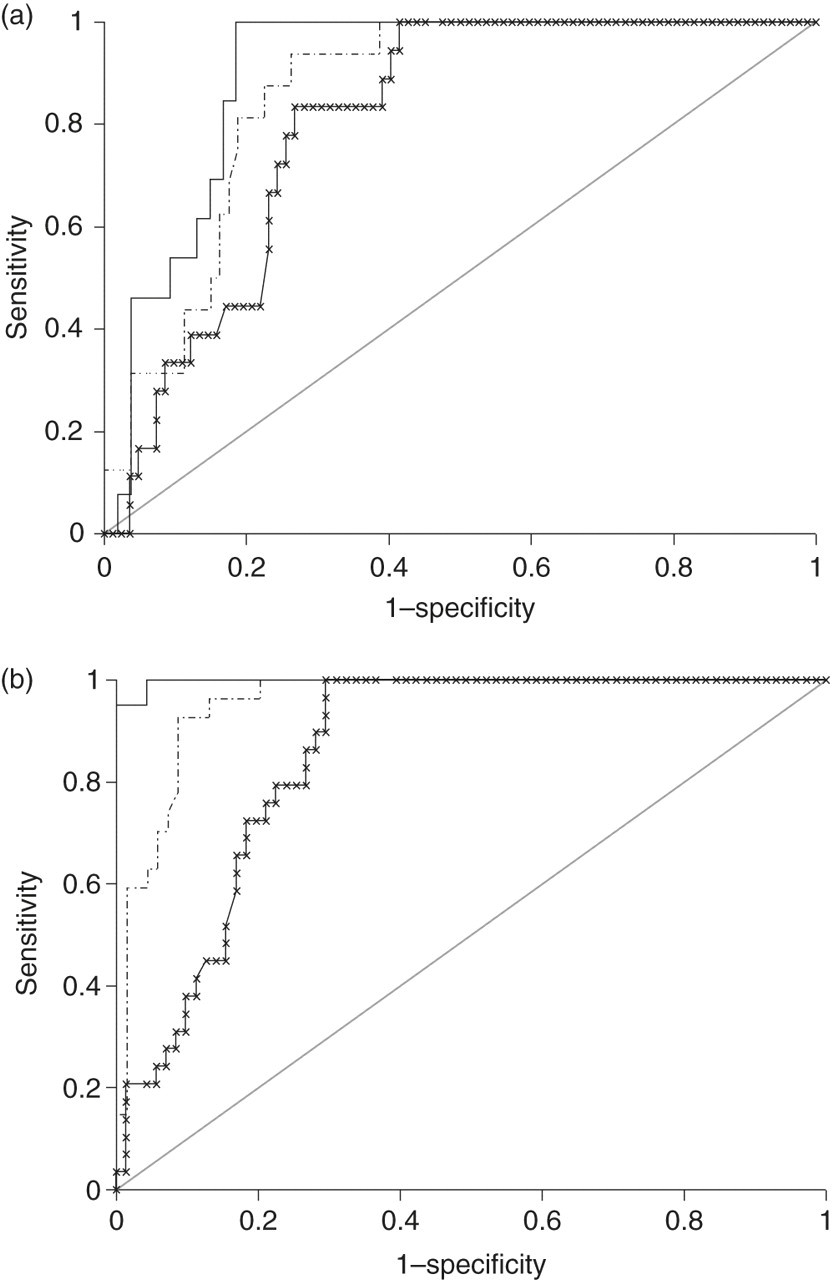
Receiver operating characteristic curves for diagnosis of primary hyperaldosteronism (a) and ‘equivalent biochemical picture’ of primary hyperaldosteronism (b) in population 1 (n =100) for the aldosterone/plasma renin activity ratio (solid line), aldosterone/ DSL renin ratio (dashed line) and aldosterone/Liaison renin ratio (x line). The population used to construct the aldosterone/DSL renin ratio had 96 subjects. DSL, Diagnostic Systems Laboratories
AUC for the PRA; Liaison and DSL renin mass methods for PHA and EBP
AUC, areas under curve; PRA, plasma renin activity; DSL, Diagnostic Systems Laboratories; PHA, primary hyperaldosteronism; EBP, equivalent biochemical picture
Application of cut-offs to the second population
The validity of the cut-off ratios obtained above were tested in population 2 (n = 43). There were six subjects with a diagnosis of PHA. Applying the Liaison cut-off >118 pmol/ng to population 2 revealed five false-positives and the DSL cut-off >60 pmol/ng gave eight false-positive subjects (Table 4).
Sensitivity, specificity and predictive values for cut-off ratios for the diagnosis of PHA in populations 1 and 2 using the ratio alone and using ratio with additional criteria (ratio, not on a BB and PAC ≥350 pmol/L)
PPV, positive predictive value; NPV, negative predictive value; PHA, primary hyperaldosteronism; BB, β-blocker; PAC, plasma aldosterone concentration; DSL, Diagnostic Systems Laboratories
†In DSL population 1 there were only 96 subjects (16 with PHA) as sample volume was inadequate in four subjects
Additional criteria for diagnosis of PHA
The ratio and a PAC ≥350 pmol/L were used as inclusion criteria and β-blocker therapy as an exclusion criterion for the detection of PHA.
Using the Liaison ratio in population 1, there were 34 false-positive subjects, of which 12 were on a β-blocker and 18 had a PAC <350 pmol/L. This resulted in four false-positives when all three criteria were applied. When the same criteria were applied with the DSL ratio, of 32 false-positive subjects identified, 12 were on a β-blocker and 12 had a PAC <350 pmol/L which left eight false-positives for the DSL method in population 1. As illustrated in Table 4, specificity and positive predictive value (PPV) improved with both methods and in both populations when all three criteria were applied.
Discussion
In our study, the prevalence of PHA in populations 1 and 2 was 18% and 14%, respectively, which is considerably higher than that quoted in other studies. Fardella et al. 3 reported a prevalence of 9.5% in a hypertensive population and Douma et al. 18 reported 11.3% in a resistant hypertension group. The higher prevalence noted in this study was due to sample selection to adequately test the lower end of the renin mass assay. The same diagnostic efficiencies demonstrated in this study may not be found if these methods are used in a general population with lower disease prevalence. However, we included both subjects with adenomas and hyperplasia as the aetiology, unlike a previous study 19 which considered detection of subjects with adenomas alone. Patients with hyperplasia potentially have lower concentrations of aldosterone than those with adenomas, decreasing the ratios obtained. Additionally, several previous method comparison studies, describe ratios established on subjects who have stopped antihypertensive therapy, especially β-blockers, which are known to suppress renin. 20 The inclusion of patients taking β-blockers in this study, resulted in false-positives as they gave equivalent ratios but were not classified as PHA. When the population on β-blocker therapy were included and the results were classified as EBP of PHA on a solely biochemical basis, the AUCs improved for all three methods. This gave better insight into the performance of the mass methods compared with the current method, PRA. In our local practice, any patients with a positive ratio while taking β-blockers must be retested after two weeks of this therapy.
Among the subjects with low PRA, there were no subjects who had correspondingly higher values for renin mass as noted in one previous study 21 and subjects on a β-blocker with a low PRA had low renin mass on both methods.
All measures of imprecision were below 20%; however, this is significantly greater than the inter-assay imprecision of 7.3% achieved for 0.2 pmol/L/h in our PRA. For the Liaison method the precision by duplicates analysis was comparable with the manufacturer's CV (10.1%) at 3.2 ng/L and better at all concentrations higher than this. This study assessed the precision at lower concentrations of renin mass than quoted by the manufacturer for the DSL method. Freeze thawing appeared to reduce renin mass by 13.6% which was unexpected as it was more likely to cryoactivate prorenin and increase the value. A possible explanation is that freeze thawing caused structural changes destroying the epitope for the second antibody specific for renin. Cryoactivation studies showed an increase compared with the baseline in most of the specimens. The maximum increase was 20%, which is clinically significant at the lower end of the analytical range, and therefore samples should be handled appropriately.
In practice, the ratio cannot be used alone for diagnosis. PRA must be suppressed with an inappropriately high aldosterone concentration resulting in an elevated ratio and patients must not be taking β-blockers. The Primary Hyperaldosteronism measured by Aldosterone-to-Renin ratio and spironolactone testing (PHArst) study 22 supported the need for an elevated PAC in addition to an elevated ratio when looking for an anatomically curable cause of PHA. Additionally, in our local practice, the ratio cut-off for PHA based on renin activity is reported in three categories: very likely, possible and unlikely. Classification by ROC curves does not allow the middle ‘possible’ category. With the utilization of three criteria (ratio, PAC and absence of β-blocker), the DSL specificities and PPVs were lower than the Liaison method.
A previous cut-off ratio for the Liaison method has been described by Unger et al., 13 where they studied both adenomas (n = 13) and hyperplasia (n = 70). The Liaison specificity with the PAC cut-off in this study (95.1%) is very similar to that described by Unger et al. (95.7%) but with better sensitivity (100% versus 90%). Bidlingmaier et al. 23 demonstrated sensitivity and specificity of 91% for cut-offs using the Liaison method for the saline suppression test. More recently, a group in Glasgow 24 have determined an aldosterone (pmol/L)/Liaison (μIU/mL) ratio >35 and aldosterone cut-off of >300 pmol/L that gave 100% sensitivity and 93% specificity when compared with the screening cut-off ratios using PRA, where a final diagnosis of PHA was established in two subjects. Cut-off ratios established are dependent on both the aldosterone and renin methods used and the cut-offs for our study are based on method-specific values derived from a population studied in our institution.
In summary, our results show that the automated Liaison renin assay had better comparability with PRA than the manual DSL IRMA to identify PHA when all three diagnostic criteria were used. Furthermore, the ratio cut-off and test performance have been reconfirmed in a second population in this study. A limitation of this retrospective study is that confirmatory testing and adrenal venous catheterization have not been used in the definitive diagnosis of PHA. Future prospective studies should include these investigations and evaluation using different reagent lots is also necessary. A previous automated renin mass method was initially described as having good correlation with PRA in the lower range but problems were noted when low values fell below the lowest part of the standard curve and due to changes in sensitivities in reagent lots. 25 There is a need for more prospective, epidemiological studies using renin mass methods in screening hypertensive subjects for PHA, to confirm this work.
DECLARATIONS