
Abstract
Background
Oxidative stress describes the cellular damage caused by excess reactive oxygen species not adequately inactivated by antioxidants. Oxidative stress has been implicated in playing a role in many disorders. Lipid peroxidation end-products are employed as markers of oxidative stress, of which the isoprostane, 8-iso-PGF2α , is widely used. 8-iso-PGF2α is measured in plasma or urine by gas chromatography–mass spectrometry (GC/MS), liquid chromatography–mass spectrometry (LC/MS), tandem-mass spectrometry or enzyme-linked immunosorbent assay (ELISA). However, discrepancies between the specificity of these methods means correlation is poor.
Methods
A tandem-mass spectrometric (LC/MS/MS) method, using immunoaffinity purification, for urinary 8-iso-PGF2α was developed and compared with two commercial ELISAs (A – Cayman Chemicals, B – Oxford Biomedical Research) in urine samples (n = 156).
Results
An LC/MS/MS method coupled to immunoaffinity purification was developed with satisfactory performance and comparison to ELISAs A and B. Spearman rank correlation demonstrated significant correlation between all methods (P = <0.0001); however, r 2 values ranged from 0.68 to 0.72. Bland–Altman plots revealed a proportional positive bias of ELISA B when compared with ELISA A and LC/MS/MS. Furthermore, the agreement between ELISA A and LC/MS/MS was poor.
Conclusions
The poor agreement between methods for measurement of 8-iso-PGF2α highlights differences in selectivity. 8-iso-PGF2α is an isoprostane, a family of isomeric end-products of arachidonic acid peroxidation, which are produced by peroxidation or enzymatically. This makes avoiding cross-reactivity between 8-iso-PGF2α and related isomers challenging. When assessing oxidative stress studies, the selectivity of the methods used should be taken into account, particularly when comparing studies.
Background
Isoprostanes are stable end-products of lipid peroxidation of arachidonic acid and are isomers of enzymatically derived products such as prostaglandins and leukotrienes. Isoprostanes have been widely used as markers of oxidative stress and have found to be elevated in a number of conditions such as cardiovascular and neurodegenerative diseases. 1,2
The F2-isoprostanes, in particular, have been extensively studied as markers of oxidative stress. 3 Theoretically, the F2-isoprostane family consists of 64 different isomers; however, the most widely measured is 8-iso prostaglandin F2α (8-iso PGF2α ).
The measurement of 8-iso PGF2α can be performed in both plasma and urine, although urine is favoured in order to circumvent in vitro formation of isoprostanes and also give an integrated assessment of free radical damage. 4
The gold standard method for 8-iso PGF2α measurement is considered to be gas chromatography–mass spectrometry (GC/MS); however, the solid-phase extraction (SPE) methods required for sample preparation are laborious and often lead to contamination, artefact generation and results in a mixture of four isomers being measured rather than just 8-iso PGF2α . 5 This problem can be circumvented by the use of immunoaffinity column (IAC) purification, which allows the measurement of 8-iso-PGF2α only. 6
Analysis may also be performed using liquid chromatography–mass spectrometry (LC/MS), which often allows more specific measurement of 8-iso PGF2α . This is demonstrated by the fact that SPE sample preparation used with LC/MS gives results that are four- to five-fold lower in concentration than with SPE/GC–MS, probably due to the latter method measuring a group of isomers. 6
8-iso PGF2α can also be measured by ELISA, which has benefits of reduced instrumentation and a high throughput. It has been demonstrated that ELISA usually gives higher results than GC-MS, which may be due to cross-reactivity of the polyclonal antibodies with other isoprostane metabolites. 7 Despite this, ELISA often correlates fairly well with GC–MS, when measuring 8-iso PGF2α in urine, although this has varied between studies. 8–10
These differences in methodology may lead to method-dependent differences between studies examining oxidative stress in various diseases, making comparing results of these studies difficult. The aim of this study was to develop an LC/MS/MS method for specific measurement of 8-iso PGF2α and to compare this with two commercial ELISA methods.
Methods
Samples
Early morning urine samples were collected from thirty subjects (ten patients with type 1 diabetes, ten patients with type 2 diabetes and ten healthy volunteers). In addition, multiple sequential urine samples were collected from six healthy volunteers on three separate occasions as part of a separate study (n = 126). Samples were centrifuged at 1500
Sample preparation
Samples were purified by either IAC purification or by SPE prior to analysis of 8-iso PGF2α
by LC/MS/MS. Immunoaffinity purification was carried out with 8-isoprostane immunoaffinity sorbent (Cayman Chemicals, Ann Arbor, MI, USA), which consists of mouse anti-8-isoprostane antibody covalently linked to Sepharose 4B. Samples were processed according to the manufacturer's instructions. Briefly, 2 mL of urine was mixed with 100 ng of internal standard (8-iso-PGF2α
-d4, Cayman Chemicals), added to 0.5 mL of sorbent and mixed gently for 60 min. The sorbent was sedimented by centrifugation at 1500
SPE was carried out with Oasis HLB 30 mg, 30 μm SPE columns (Waters, Milford, MA, USA). Briefly, 2 mL of urine was acidified to pH 3 and centrifuged at 1500
LC/MS/MS optimization
LC/MS/MS was carried out on a Waters 2795 HPLC module coupled to a Quattro Premier XE tandem mass spectrometer controlled by Mass Lynx version 4.1 software (Waters). Ionization was achieved using electrospray in the negative electrospray ionisation (ESI) mode.
MS/MS settings were optimized by infusing a methanolic solution of 1 μg/mL 8-iso-PGF2α and 8-iso-PGF2α -d4 with a syringe pump (10 μL/min) into the mass spectrometer coupled with mobile phase (50:50 v/v). Parent and daughter ions were detected in MS scan mode for both compounds, 8-iso-PGF2α (m/z 353/193) and 8-iso-PGF2α -d4 (m/z 357/197). The mass spectrometer was operated in the multiple reaction monitoring (MRM) mode to optimize MS/MS settings.
The optimized MS/MS conditions were as follows: capillary voltage, 4 kV; source temperature, 125°C; desolvation gas, nitrogen heated to 450°C and delivered at a flow rate of 995 L/h. Cone voltages and collision energy for both compounds were 42 V and 26 eV, respectively.
To optimize high-performance liquid chromatography (HPLC) separation, a number of mobile phases were assessed: (1) 0.01% formic acid/water (v/v) and acetonitrile; (2) 2 mmol/L ammonium acetate/water and acetonitrile; and (3) 0.15% NH4OH/water (v/v) and 0.15% NH4OH in 95:5 acetonitrile:methanol (v/v). In addition, two columns were compared for optimal separation: Luna 5 μm C8 150 × 2 mm column (Phenomenex, Torrance, CA, USA) and an X-Bridge 3.5 μm C18 50 × 2 mm column (Waters).
HPLC was performed at a flow rate of 0.3 mL/min for 10 min with the following gradient: 0–1 min 95% A/5% B, 1–2.5 min linear increase to 100% B, 2.5–8 min 100% B, 8–8.5 min linear decrease to 95% A/5% B, 8.5–10 min 95% A/5% B.
LC/MS/MS analysis of 8-iso-PGF2α
Urine samples were mixed with internal standard and purified with 8-isoprostane immunoaffinity sorbent as described above. A range of standard solutions (0, 200, 800, 1400, 2000, 3000 pg/mL) were prepared and purified by the same method. Purified samples (2 mL) were dried down and reconstituted in 200 μL 0.1% NH4OH in 10:90 methanol:water. Samples were transferred to 1.5 mL maximum recovery glass autosampler vials and 25 μL injected onto the LC/MS/MS.
Samples were separated by HPLC using the following mobile phase: (A) 0.15% NH4OH/water (v/v), (B) 0.15% NH4OH in 95:5 acetonitrile:methanol (v/v). Separation was carried out on the X-Bridge 3.5 μm C18 50 × 2 mm column and using the 10-min program described above. 8-iso-PGF2α was detected by MS/MS in the MRM mode using the settings described above. Peak identification, integration of the peak areas and quantification of 8-iso-PGF2α were carried out using QuanLynx software (Waters).
ELISA measurement of 8-iso-PGF2α
Two commercial ELISA methods were employed (A and B). ELISA method A was an 8-isoprostane EIA kit supplied by Cayman Chemicals. This is a competitive enzyme immunoassay based on competition between 8-isoprostane and 8-isoprostane-acetylcholinesterase for a rabbit anti-8-isoprostane antiserum. The assay is stated to have an intra-assay % coefficient of variation (CV) of between 6.4% and 34.8% and an inter-assay %CV of 9.6% and 39.1% (measured between 0.8 and 500 pg/mL). Samples were purified by immunoaffinity purification as for LC/MS/MS and the ELISA then performed according to the manufacturer's instructions.
ELISA method B was a urinary isoprostane EIA kit supplied by Oxford Biomedical Research (Oxford, MI, USA). This assay is a competitive enzyme-linked immunoassay based on competition between 8-iso-PGF2α and 8-iso-PGF2α -horseradish peroxidase for a polyclonal goat anti-8-iso-PGF2α antibody. Samples were analysed without purification according to the manufacturer's instructions.
Statistical analysis
Analyse-it® Standard edition software (Analyse-it software Ltd, Leeds, UK) was used for statistical analysis. Normality of data was assessed by the Kolmogorov–Smirnov test. Method comparison was assessed by Spearman's rank correlation and Bland–Altman plots.
Results
LC/MS/MS method development
MS/MS tuning was carried out by direct infusion of a solution of 8-iso-PGF2α and 8-iso-PGF2α -d4 into the mass spectrometer. Parent ions were detected at m/z 353 and m/z 357 for 8-iso-PGF2α and 8-iso-PGF2α -d4, respectively. An MS/MS scan was undertaken to characterize the fragmentation of the parent ions; for 8-iso-PGF2α the predominant daughter ion was at m/z 193 and for 8-iso-PGF2α -d4 the predominant daughter ion was at m/z 197 (Figure 1) at an optimal collision energy of 26 eV for both compounds. LC/MS/MS was subsequently carried out in the MRM mode with the transitions m/z 353/193 and m/z 357/197.
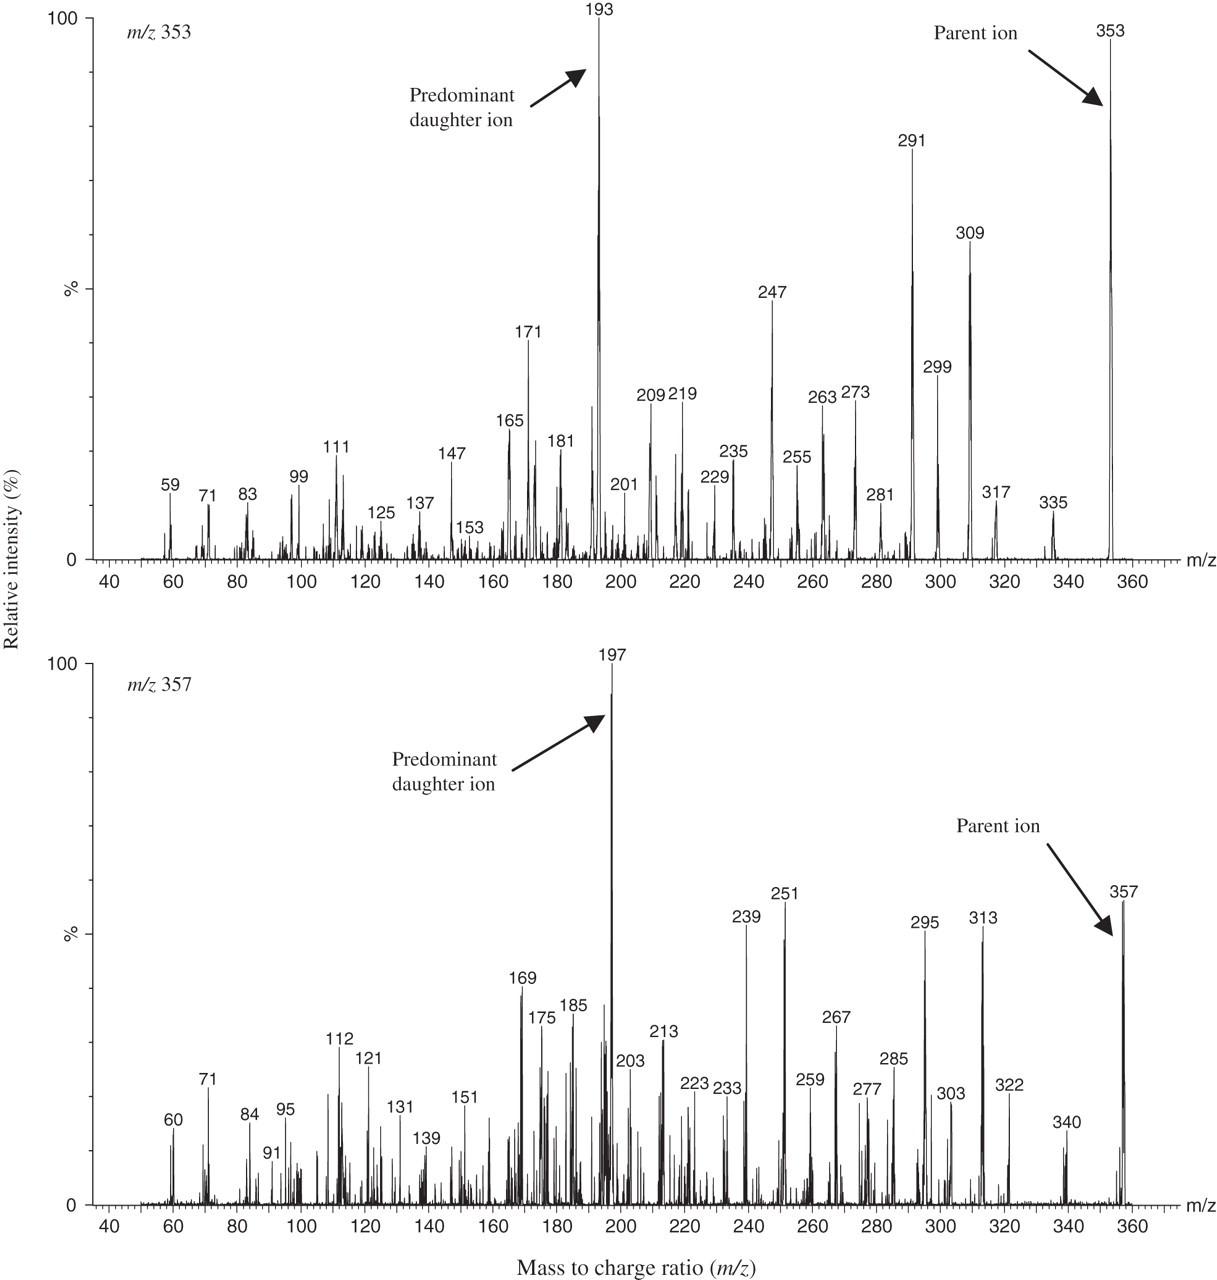
Daughter ion spectra of 8-iso-PGF2α (parent ion m/z 353, predominant daughter ion m/z 193) and 8-iso-PGF2α -d4 (parent ion m/z 357, predominant daughter ion m/z 197)
HPLC optimization was undertaken, by direct infusion of 8-iso-PGF2α and 8-iso-PGF2α -d4 into the mass spectrometer while different mobile phases (see Methods) were pumping through the HPLC. It was found that the greatest MS/MS signal intensity was achieved with the following mobile phase: (A) 0.15% NH4OH/water (v/v), (B) 0.15% NH4OH in 95:5 acetonitrile:methanol (v/v). This mobile phase was used in all subsequent HPLC.
HPLC separation of a standard/internal standard solution was initially undertaken on a Luna C8 column (150 × 2 mm, 5 μm). However, due to problems with a lack of retention of 8-iso-PGF2α on the column, an X-Bridge C18 column (50 × 2 mm, 3.5 μm) was used in subsequent HPLC separation.
Urine was purified by SPE and IAC and analysed with the optimised LC/MS/MS method (Figure 2). It was observed that the urine samples purified by SPE gave more chromatography peaks at the m/z 353/193 transition than the sample purified by IAC. In addition, in the urine sample purified by SPE, a peak was detected with the transition m/z 357/197, which eluted at the same time as 8-iso-PGF2α (3.8 min) and which has implications for interference in measurement of the internal standard in urine samples. Owing to the reasons outlined above, IAC purification was carried out on urine samples prior to LC/MS/MS analysis.
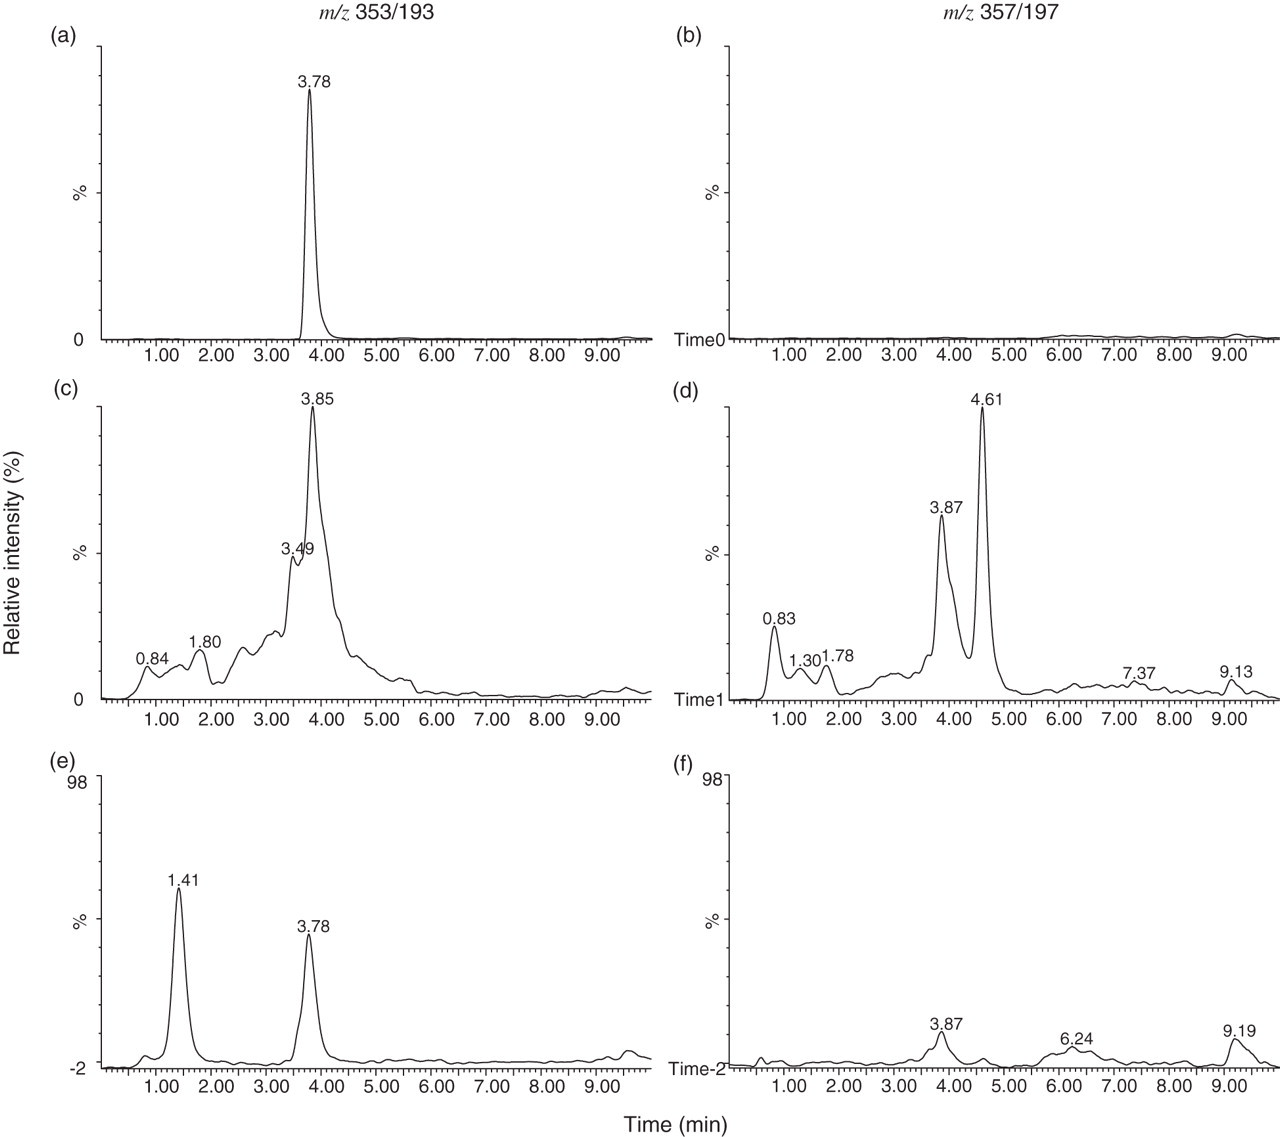
LC/MS/MS analysis of an 8-iso-PGF2α standard (a, b), a urine sample purified by SPE (c, d) and the same sample purified by IAC (e, f). 8-iso-PGF2α standard was eluted at 3.8 min and detected only with the transition m/z 353/193 (a, b). This peak was also observed in the urine sample after purification by IAC. However, after purification by SPE several different peaks were detected with both transitions, m/z 353/193 and 357/197. 8-iso-PGF2α , 8-iso prostaglandin F2α ; IAC, immunoaffinity column; SPE, solid-phase extraction
The optimized method was validated for recovery, linearity, imprecision and sensitivity. Recovery was determined by measurement in duplicate of 8-iso-PGF2α in urine samples spiked with 200, 1000 and 2000 pg/mL of 8-iso-PGF2α . After analysis by LC/MS/MS, the mean % recovery for spiked samples was 79% (200 pg/mL), 103% (1000 pg/mL) and 97% (2000 pg/mL).
Linearity was determined by serial dilution of an 8-iso-PGF2α standard (3000 pg/mL) followed by IAC purification and LC/MS/MS analysis. It was found that 8-iso-PGF2α was diluted in a linear fashion between 0 and 3000 pg/mL.
Imprecision was determined by measuring a sample five times within a batch and three times between batches. The intra-assay %CV was calculated as 5.7% (mean conc. 632 pg/mL) and the total %CV was 11.1% (mean conc. 628 pg/mL). The lower limit of detection of 8-iso-PGF2α was found to be 20 pg/mL, which was determined by a cut-off signal-to-noise ratio of six.
Method comparison
Correlation of results generated by the three methods for the measurement of 8-iso-PGF2α (concentration in pg/mL) in 156 urine samples was investigated with Spearman's rank correlation as many of the data-sets were not normally distributed (confirmed by the Kolmogorov–Smirnov test). It was found that all of the methods had significant correlation (P ≤ 0.05) (Figure 3); however, the r 2 values were poor (LC/MS/MS versus ELISA A, r 2 = 0.72; LC/MS/MS versus ELISA B, r 2 = 0.68; ELISA A versus ELISA B, r 2 = 0.71). These data were comparable to that when looking at diabetic patients alone (LC/MS/MS versus ELISA A, r 2 = 0.74; LC/MS/MS versus ELISA B, r 2 = 0.57; ELISA A versus ELISA B, r 2 = 0.76).
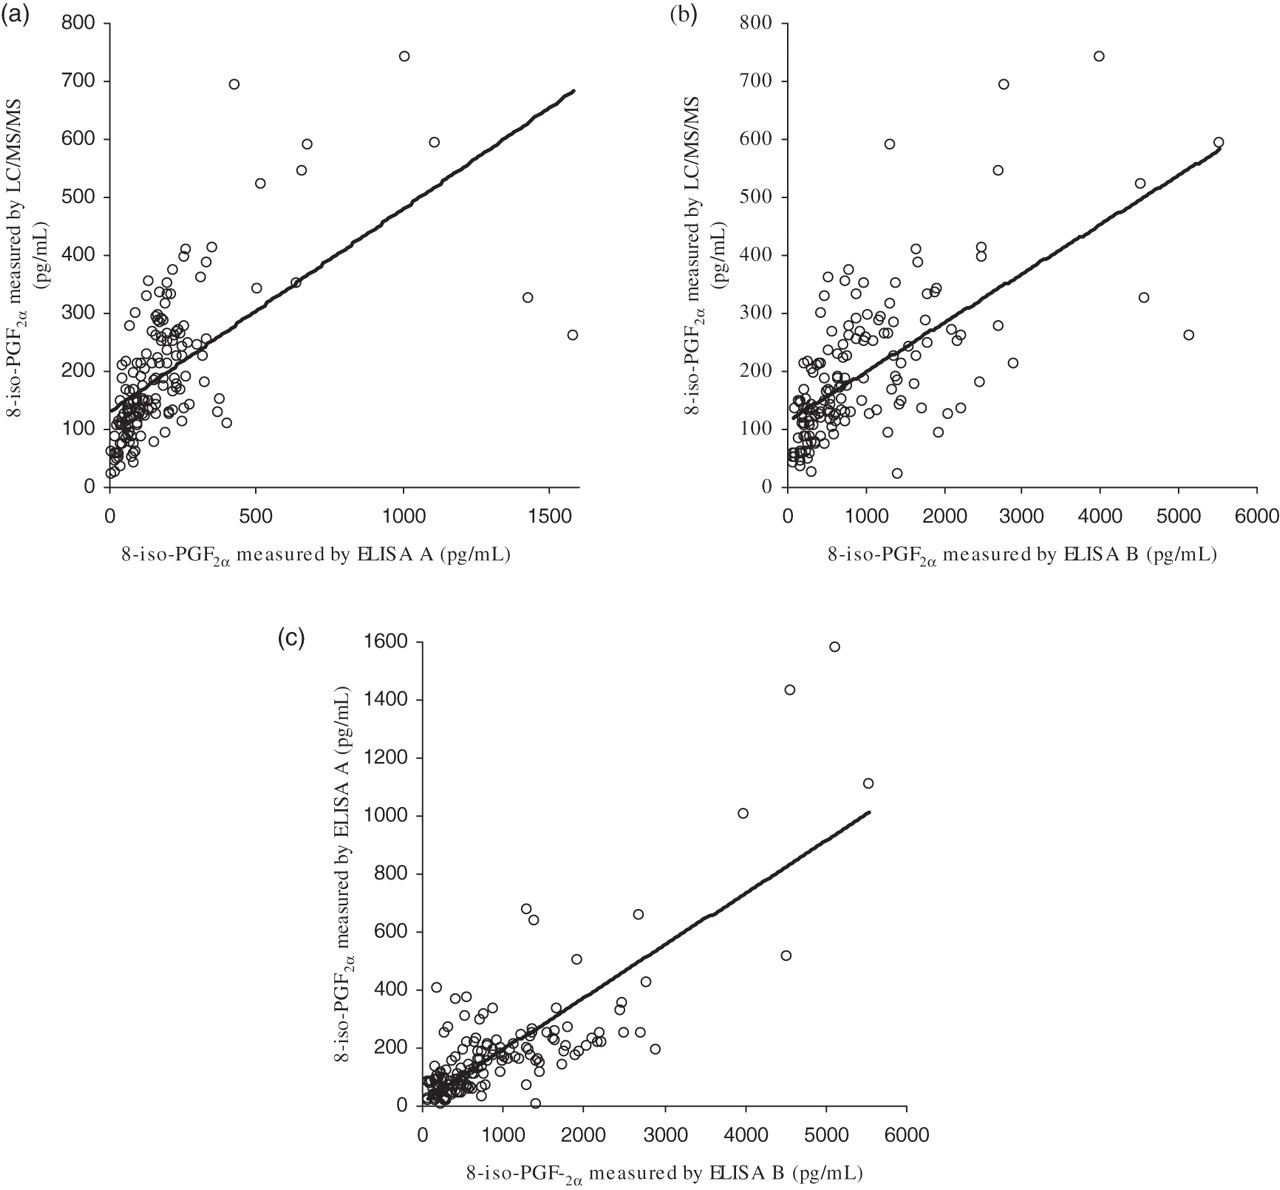
Graphs showing correlation of different methods for measurement of 8-iso-PGF2α in 156 urine samples. (a) ELISA method A against LC/MS/MS. (b) ELISA method B against LC/MS/MS. (c) ELISA method A against ELISA method B. Graphs are fitted with a linear regression line. 8-iso-PGF2α , 8-iso prostaglandin F2α ; ELISA, enzyme-linked immunosorbent assay; LC/MS/MS, tandem-mass spectrometry
Bland–Altman plots were also used to compare the three methods (Figure 4) and showed that ELISA method A and LC/MS/MS correlated rather poorly. ELISA method B has a proportional positive bias when compared with both ELISA method A and LC/MS/MS.
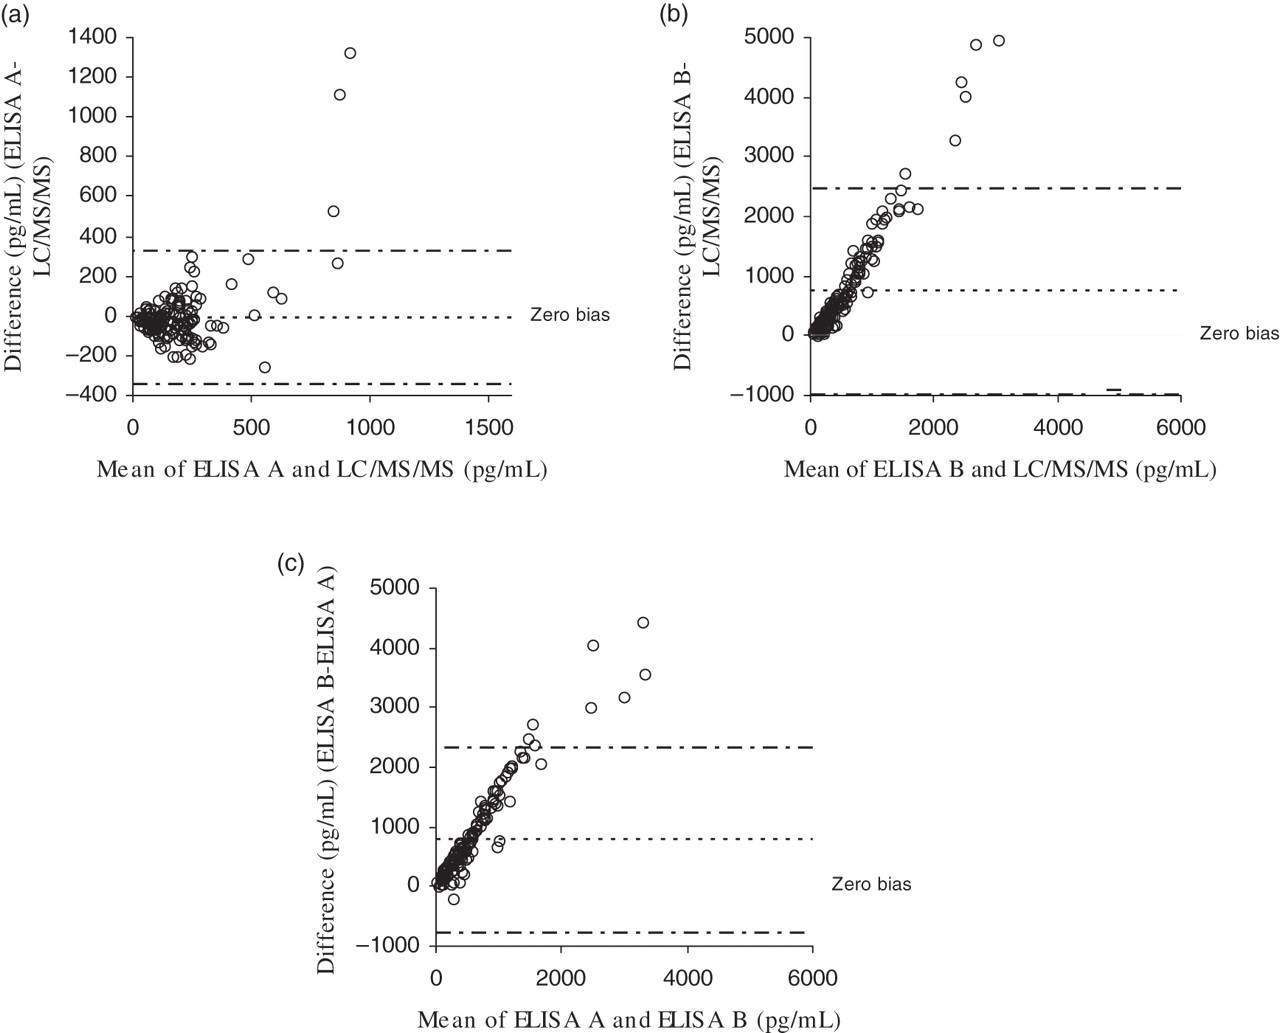
Bland–Altman plots (average versus difference) showing comparison of different methods (LC/MS/MS, ELISA A and ELISA B) for measurement of 8-iso-PGF2α in 156 urine samples. (a) LC/MS/MS versus ELISA A. (b) LC/MS/MS versus ELISA B. (c) ELISA A versus ELISA B. Broken lines (- · -) show 95% confidence intervals. 8-iso-PGF2α , 8-iso prostaglandin F2α ; ELISA, enzyme-linked immunosorbent assay; LC/MS/MS, tandem-mass spectrometry
Conclusions
This aim of this study was to set up an LC/MS/MS method to measure urinary 8-iso-PGF2α and its comparison to two commercial ELISA methods. The LC/MS/MS method was successfully established and optimized to measure urinary 8-iso-PGF2α .
Tuning of the mass spectrometer showed detection of the parent ions of 8-iso-PGF2α at m/z 353 and 8-iso-PGF2α -d4 at m/z 357. The predominant daughter ions were detected at m/z 193 for 8-iso-PGF2α and m/z 197 for 8-iso-PGF2α -d4 and are in agreement with previous studies. 6
HPLC separation of 8-iso-PGF2α was optimized to use a C18 column over a C8 column as it appeared that a standard 8-iso-PGF2α solution was eluted from the C8 column in two peaks, suggesting poor retention of 8-iso-PGF2α on the column, whereas this issue was not encountered using a C18 column. The HPLC mobile phase used (0.15% NH4OH/water [v/v] and 0.15% NH4OH in 95:5 acetonitrile:methanol) was selected on the basis of increased sensitivity of detection, in which NH4OH buffers were superior to buffers with ammonium acetate or formic acid. 11
Sample preparation and HPLC separation is an important step in the measurement of 8-iso-PGF2α as it is one of a group of isobaric F2-isoprostane stereoisomers, which all have the same transition in mass spectrometry (m/z 353/193). There are two main approaches used for sample preparation: SPE or IAC. SPE purifies all F2-isoprostane isomers; therefore they need to be separated by HPLC to specifically measure 8-iso-PGF2α . Efficient separation can be challenging as can be seen by analysis of urine purified by SPE (Figure 2), where there are several peaks, many of which are unresolved. Optimization of HPLC conditions may provide better resolution of the F2-isoprostane isomers and allow specific measurement of 8-iso-PGF2α . However, it was also observed that in the SPE purified urine sample, a compound co-eluted with 8-iso-PGF2α but was only detected with the transition m/z 357/197. As this is the transition used for the internal standard (8-iso-PGF2α -d4), potential problems could be encountered in 8-iso-PGF2α quantification. 12
Sample purification is much improved by the use of IAC as it removes the majority of 8-iso-PGF2α stereoisomers and reduces the number of co-eluting peaks. The antibody in the IAC columns does have some cross-reactivity to other prostaglandin isomers as seen by the presence of a second peak in a urine sample purified by IAC (Figure 2). However, as this peak is easily resolved from the 8-iso-PGF2α peak, possible interference was considered to be unlikely.
The optimized LC/MS/MS method was used for analysis of spiked urine samples to estimate 8-iso-PGF2α recovery, which was calculated as 79–103%. This suggests that there were no matrix-related ion suppression effects encountered in 8-iso-PGF2α quantification.
Linearity was determined by serial dilution of an 8-iso-PGF2α standard and it was determined that 8-iso-PGF2α was diluted in a linear fashion over 200–3000 pg/mL. The lower limit of detection of 8-iso-PGF2α was found to be 20 pg/mL or 5 pg per injection (signal-to-noise ratio of 6). The precision of the assay was also determined. The intra-assay %CV was calculated as 5.7% and the total %CV was 11.1%. These characteristics are in agreement with previous LC/MS/MS assays for measurement of urinary 8-iso-PGF2α . 6,11,13–15
A series of 156 urine samples were used to compare the optimized LC/MS/MS method to two commercial ELISAs. It was found that there was significant correlation between the three methods for measurement of urinary 8-iso-PGF2α : LC/MS/MS, ELISA method A and ELISA method B.
It was observed that although ELISA method B was significantly correlated to ELISA method A and LC/MS/MS, it had a proportional positive bias compared with the other methods. This would have been expected to some extent as ELISA method B contained no sample purification steps to remove isoprostane isomers that may cross-react with the antibody used in the ELISA. This is reflected in the much larger 8-iso-PGF2α concentrations that were obtained with ELISA method B – mean concentration 1764 pg/mL compared with 180 pg/mL and 233 pg/mL obtained by LC/MS/MS and ELISA method B, respectively. The isoprostanes that cross-react in ELISA method B include 11-epi-PGF2α and 13,14-dihydro-15-keto-PGF2α , both metabolites of the enzymatically derived prostaglandin, PGF2α and therefore not derived from reactive oxygen species action.
LC/MS/MS and ELISA method A were significantly correlated; however, the agreement between these methods was not particularly tight and the Bland–Altman plot reveals a large spread of results (Figure 4). The correlation between these two methods would be expected to be improved by the fact that both methods employ the same sample preparation technique and therefore the same amount of interfering isoprostane and prostaglandin isomers are removed. However, the IAC sample preparation, although superior to SPE, still allows carryover of cross-reacting isoprostanes, which may be measured by ELISA but are separated out by HPLC.
GC/MS is believed to be the gold standard for measurement of 8-iso-PGF2α ; however, the derivatization process means measurement of three F2-isoprostane isomers: 8-iso-PGF2α , 9β,11α-PGF2α and 8-iso-15(R)-PGF2α . 4 This accounts for the fact that although GC/MS correlates with LC/MS/MS and ELISA, the values are much higher. 6,8,14
The specificity of GC/MS can be improved by use of a combination of tandem GC/MS and IAC sample preparation. 7 LC/MS/MS offers advantages over GC/MS in that sample preparation is less extensive and 8-iso-PGF2α can be separated from interfering F2-isoprostane isomers by HPLC. 11,12,16
ELISA has been suggested to be a useful method for quantification of 8-iso-PGF2α . However, selectivity for 8-iso-PGF2α is not as good by ELISA unless IAC or SPE sample preparation is used, which comprises the advantages of high throughput offered by ELISA.
The comparison between mass spectrometry and ELISA methods reflects the importance of sample preparation and methodology for specific measurement of 8-iso-PGF2α and removal of potential interfering compounds.
However, it could be suggested that measurement of several F2-isoprostane isomers such as by GC/MS is still valid if all are produced by the action of reactive oxygen species rather than enzymatically. But there is some evidence that different F2-isoprostane isomers are produced and metabolized differently in certain diseases such as congestive heart failure and may have different biological roles. 13 In addition, measurement of specific compounds such as 8-iso-PGF2α would make it easier to compare between studies than those measuring different mixes of F2-isoprostane isomers as is the case currently.
It has been shown that 8-iso-PGF2α is a good marker of oxidative stress; however, the choice of methodology for its measurement is important. LC/MS/MS (with IAC sample preparation) appears to be a superior method for measurement of 8-iso-PGF2α as it gives more specificity compared with other methods, which measure several F2-isoprostane isomers. This study is the first to show a comparison between a highly specific LC/MS/MS method coupled with IAC to available ELISA methods. It may be that this specificity is not needed if all isoprostanes measured are produced by the action of reactive oxygen species; however, measurement of a specific compound makes comparison between studies easier.
DECLARATIONS