
Abstract
Introduction
Normetanephrine and metanephrine are intermediate metabolites of noradrenaline and adrenaline metabolism. To assess whether normetanephrine and metanephrine analysis may aid in the diagnosis of Neuroblastoma, a reference interval for these metabolites must first be established.
Aim
The overall aim of this study was to establish a paediatric age-related reference interval for the measurement of total fractionated metanephrines.
Methods
A total of 267 urine samples were analysed following acid hydrolysis. This releases the metanephrines from their sulphate-bound metabolites. The samples were analysed using reverse phase high-performance liquid chromatography with electro-chemical detection on a Gilson automated sequential trace enrichment of dialysate sample system.
Results
Data were analysed using Minitab Release version 14. Outliers were removed using the Dixon/Reed one-third rule. Partitioning of the age groups was achieved using Harris and Boyd's standard normal deviate test. Non-parametric analysis of the data was performed, followed by the establishment of the 2.5th and the 97.5th reference limits.
Conclusions
The established reference intervals are described in Table 2.
Introduction
Neuroblastomas (NBLs) are neoplasms that occur in neural crest cells of the sympathetic nervous system and account for approximately 7% of childhood cancer. Less than 10% occur in patients older than 10 y. NBL is the most common malignancy in the first year of life with an incidence of 10 cases per million children; the majority of NBLs develop sporadically. 1 Most children present with a palpable abdominal mass. However, there are a wide variety of non-specific symptoms associated with NBL such as fatigue, loss of appetite, malaise, fever and irritability. 2 Therefore, biochemical diagnosis is vital when assessing a child with suspected NBL.
There are high concentrations of urinary catecholamines and/or their metabolites in >90% of NBL cases 3 forming the basis for their biochemical diagnosis. Our laboratory is a tertiary referral centre for the diagnosis of paragangliomas and NBL in the Republic of Ireland. The diagnostic and disease-monitoring protocol of NBL includes the measurement of noradrenaline, adrenaline, dopamine, 4-hydroxy-3-methoxy mandelic acid (HMMA) and homovanillic acid (HVA) on each patient sample. Free fractionated catecholamines and metabolites are measured in the laboratory using a Gilson automated sequential trace enrichment of dialysate sampling system. This procedure allows for the visualization and quantitation of free noradrenaline, adrenaline, normetanephrine, dopamine and metanephrine in each chromatogram.
Normetanephrine is an intermediate metabolite of noradrenaline. It has been suggested that normetanephrine may be a superior marker for the diagnosis of NBL. 4 However, in order to investigate this further, a reference interval for urinary total fractionated metanephrines must first be established.
The current International Federation for Clinical Chemistry (IFCC) guidelines recommend that reference intervals need not be calculated from healthy young adults, but from subjects that resemble the patient population under medical evaluation. 5 Two forms of subject sampling are commonly applied – direct and indirect. Direct sampling is the method that best meets the current IFCC recommendations on establishing reference intervals. 5 However, this process is organizationally difficult and time consuming. These practical problems have forced the development of simpler and less expensive approaches. 6 Indirect sampling uses results from the hospital database (data mining) to establish a reference interval. This method is particularly suited to the paediatric setting. It is conveniently simple and pragmatic.
Reference values are subjected to statistical treatment, including partitioning (physiological factors and age), inspection of the distribution, identification and elimination of outliers. The reference interval is defined by the IFCC as the interval between, and including, the upper and lower reference limits. This is usually 95% of the values for the relevant population. 5 The parametric method assumes that the values included form a true Gaussian distribution. The reference limits are determined as the two standard deviations above and below the mean. 6 The non-parametric method does not assume a Gaussian-type distribution. The percentiles are determined by excluding a required percentage of the values in each tail of the reference distribution. The 2.5th and 97.5th percentiles are determined, representing the lower and upper percentiles. These are the IFCC recommended procedures for establishing reference intervals when the statistical and computational support is limited.
Data mining has been criticized in the literature owing to its potential to misclassify patients. 7 However, others have argued that this form of sampling is most appropriate, provided all relevant patient information is available. 8,9 Barth argues further that a minimum sample number of 120 subjects is inappropriate in certain situations such as in paediatrics. 8 The IFCC themselves acknowledge this, suggesting that data should be calculated by the non-parametric method and reported as percentiles even when 120 sample size is not practical. 5 Therefore, data mining with non-parametric analysis was chosen for this study.
The overall aim of this study was to establish a paediatric age-related reference interval for the measurement of total fractionated metanephrines using data mining and non-parametric analysis.
Patients and methods
Sample handling and collection
Urine samples were collected from 267 paediatric patients undergoing investigation to rule out NBL in whom this diagnosis was subsequently excluded. Known NBL patients, including those in remission, were excluded from the study. As these samples were collected as part of ongoing investigations, ethical approval was not required according to recent guidelines from the Royal College of Pathologists. 10 Spot urine samples were acidified within one hour of voiding with 0.5 mL of 50% HCl per 10 mL of urine collected and separated into two aliquots. One aliquot was stored at 4°C, while the other was stored at −20°C. The total normetanephrine and metanephrine analysis for this study was done on the samples stored at −20°C. Each sample had only one thaw cycle. Acid hydrolysis of each sample was used to release the total metanephrines from their sulphate-bound metabolites. 11
Analytical methodology
Reverse phase high-performance liquid chromatography (HPLC) with Coulometric electrochemical detection was used. 12 The analytes separate in the following order: noradrenaline, adrenaline, DBHA (internal standard), normetanephrine, dopamine and metanephrine. The Empower 2® software is used to process the chromatograms. Urinary creatinine analysis was performed on all patient samples using a Beckman Coulter AU2700. Results were expressed in mmol/mol of creatinine. The % coefficient of variation (%CV) for the two analytes was established over a six-month period using two levels of quality control material, Biorad Lyphochek urine control lot numbers 62251 and 62252. The %CV for normetanephrine was 2.6% at a concentration of 1330.6 nmol/L and 3.6% at a concentration of 6345.5 nmol/L. The %CV for metanephrine was 9.3% at a concentration of 355.0 nmol/L and 4.4% at a concentration of 2458.2 nmol/L. The percentage bias for normetanephrine is −8.5%, while that of metanephrine is +6.0%. This is based on six months of UK NEQAS distributions from February to July 2010.
Statistical analysis
Statistical analyses were performed using Minitab Release version 14.
Results
Outliers
The Minitab statistical package was used to illustrate the data. The frequency distributions for urinary total fractionated normetanephrine (Tnormet) and urinary total fractionated metanephrine (Tmet) were established. Outliers were removed in accordance with the criteria proposed by Dixon 13 and Reed et al. Briefly, Dixon 13 proposed the use of the D/R ratio, where D represents the difference between an extreme observation and the next observation, and R represents the range of all observations including the extremes. An outlier is excluded when D is equal to one-third or greater than the range R. This approach to statistically significant outliers is supported by the IFCC working group. 5
When there are one or more outliers on the same side of the distribution, the one-third rule may fail to identify the extreme outlier and therefore may mask slightly less extreme outliers. In this case, the one-third rule should be applied to the least extreme outlier. If the rule rejects this outlier, then the more extreme outliers will automatically be rejected. If the rule does not reject this outlier, then all the outliers should be included or an alternative technique that considers all the outliers together should be applied. 5
Partitioning of the age groups
The following partitioning of data age was used: <1, 1–3, 3–5, 5–8, 8–11 and >11 y. This was in accordance with the previous paediatric reference ranges for urinary free catecholamines and their metabolites established at this institution.
14
The <1 y age group was subdivided into the following groups: up to 3, 4–6, 7–9 and 10–12 months. These partitions were then subjected to the Harris and Boyd standard deviate test described below:
15
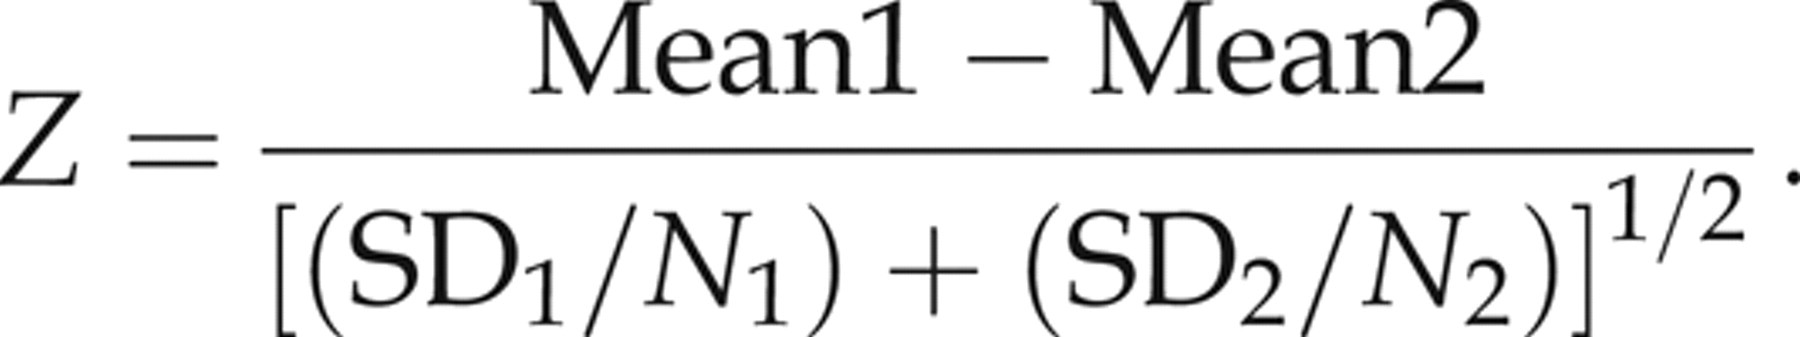
They also compare the statistical Z result with a critical Z* value:
The partitioning calculations show that for urinary total normetanephrine, age groups 7–9 and 10–12 months can be combined as can the age groups 5–8 and 8–11 y. This also applies to the age groups up to 3 and 4–6 months being combined and those of the 8–11 and >11 y for urinary total metanephrine (see Table 1).
Age groups for Tnormet and Tmet after partitioning
Partitioning of gender
The box and whisker plot (Figure 1) shows the data for total normetanephrine and metanephrine for the age group <1 y. The plot shows data representing female (f) n = 12, male (m) n = 13 and unknown (u) n = 5 groups at the time of analysis. It is evident that partitioning based on gender is not required for this age group, as no statistically significant difference was observed between the groups and all plots overlie each other.
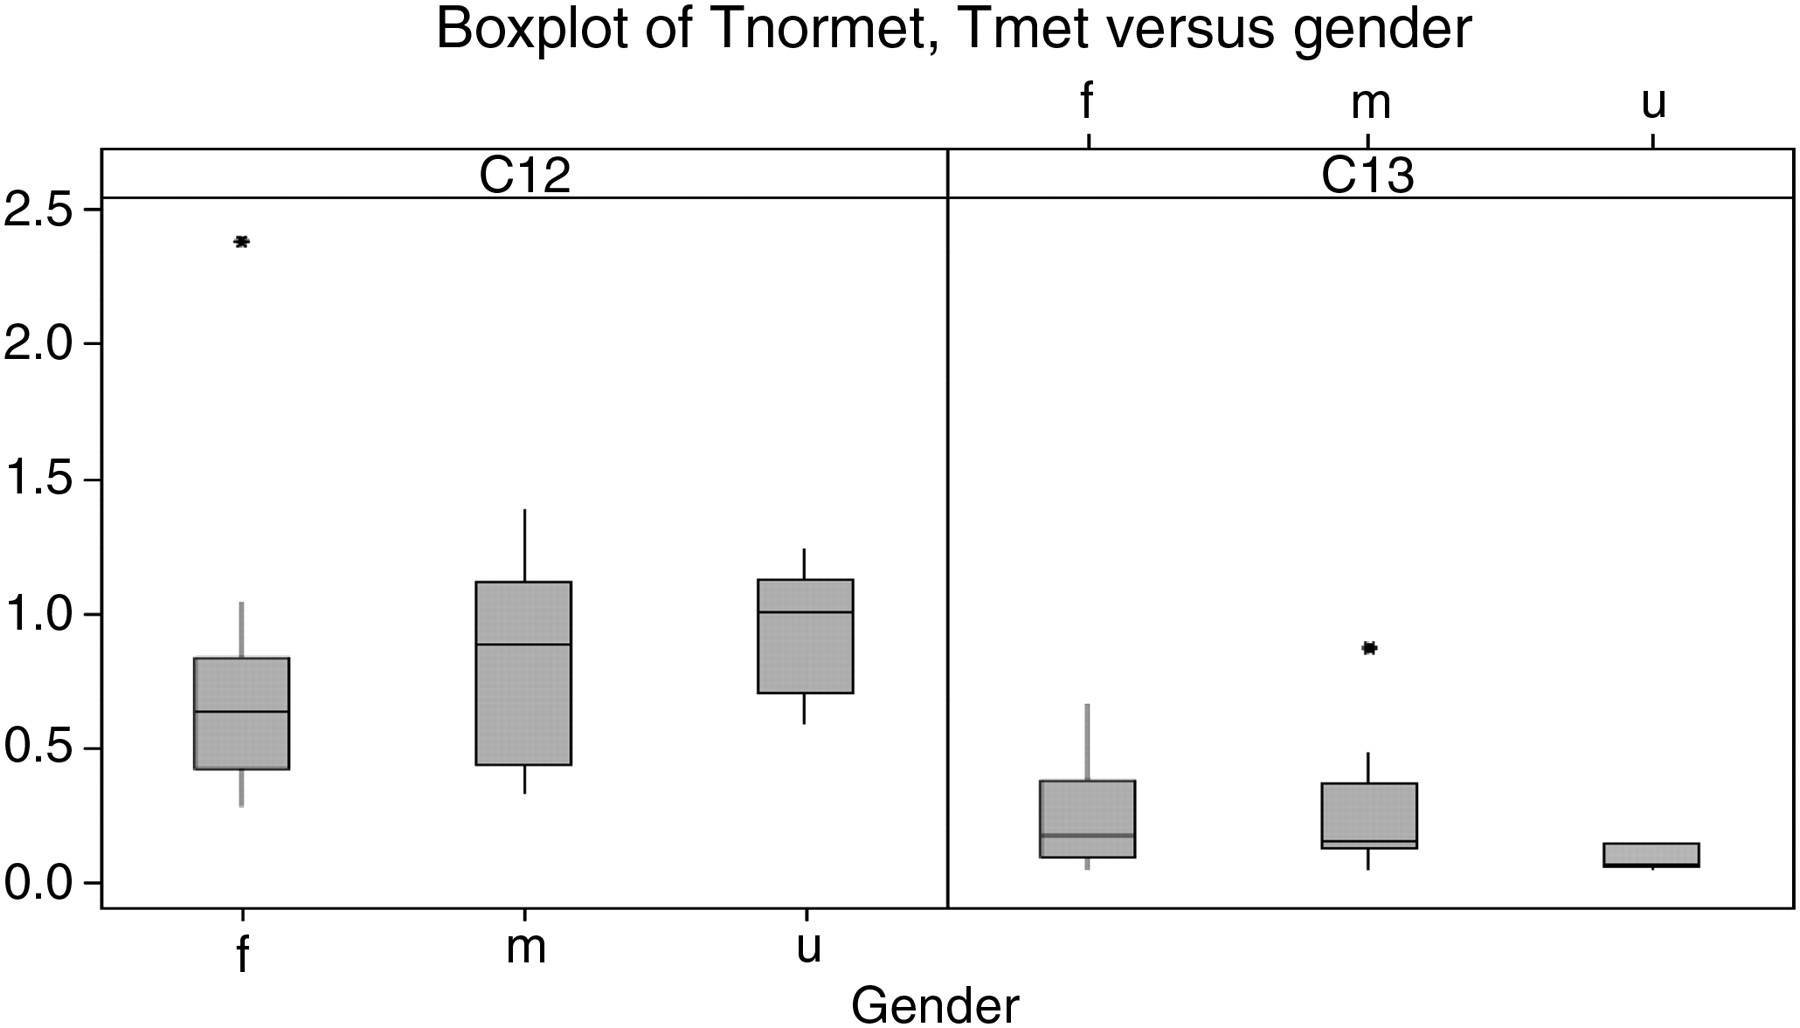
Box and whisker plot for Tnormet and Tmet for the <1 y age group. f, female; m, male; u, unknown
Establishing the reference intervals
Following partitioning, the upper and lower reference limits were established (see Table 2). The values were sorted into ascending order with rank number 1 assigned to the minimum value, rank number 2 to the next and so on until the maximum rank has the rank value equal to n. The limits are determined by the rank number equal to 0.025(n + 1) and 0.975(n + 1), respectively.
Established reference intervals for total fractionated metanephrines
Discussion
The interpretation of laboratory results generally requires a suitable reference interval. The establishment of a reference interval typically involves defining a suitable, usually normal, population, obtaining consent to collect samples and determining these intervals based on statistical analysis of the measured data. This is the conventional approach to establishing adult reference intervals but is not always possible when determining paediatric reference intervals.
The major difficulties associated with establishing paediatric reference intervals include the following:
Obtaining ethical approval for sample collection on healthy paediatric subjects including newborns; The current IFCC guidelines for establishing reference intervals recommend 120 reference subjects per subgroup or partition;
5
Control over preanalytical factors that could potentially cause biological noise that can conceal signs of disease.
1
The current IFCC guidelines advocate direct sampling techniques when establishing reference intervals. This approach is both expensive and time consuming. It highlights the ethical issue of collecting samples from healthy paediatric individuals, and perhaps subjecting them to phlebotomy procedures for the purpose of establishing a reference interval.
In this study, we used redundant urine samples from children who had biogenic amine analysis preformed as part of their clinical work-up. Once the exclusion criteria were applied, it was assumed that the data acquired were from subjects likely to be relatively healthy individuals and unlikely to suffer from conditions that would impact on the metabolism of normetanephrine or metanephrine. 16
Despite the use of data mining in this study, it still proved difficult to collect 120 samples for each age group. While the IFCC do advocate using 120 reference subjects, they also recognize that this may be problematic in certain populations such as children. In these situations, they advise non-parametric analysis of the data, and that the data are reported in percentiles appropriate to the numbers obtained. Therefore, non-parametric analysis and establishment of the 2.5th and the 97.5th percentiles was performed in this study.
Pre-analytical factors were controlled, as all samples analysed had been referred to this institution for diagnostic purposes. This approach is supported by Barth, who advocates that preanalytical factors should reflect the sample collection techniques used in external institutions and therefore reflect the samples that are received by laboratories for diagnostic purposes. 8
Outliers are extreme values that deviate significantly from the bulk of the remaining values. 1 While no statistical evaluation of outliers has the ability to detect outliers in every situation, the ‘Dixon/Reed one-third rule’ was used as it is recommended by the IFCC. Outliers were either excluded or retained, based upon this rule. The IFCC guidelines also recommend that where an outlier is removed from the data, another reference individual must replace it. This was not possible in this study as each age group had only 30 samples and there were insufficient samples available to replace removed outliers. For total metanephrine in the age group of 1–3-y-olds, three outliers were removed leaving 27 samples remaining.
Partitioning according to age was chosen in this study in keeping with the previously established reference intervals for urinary catecholamines and their metabolites HMMA and HVA. 14 The <1 y age group were subsequently divided into three age groups based on Harris and Boyd's standard normal deviate test.
During the course of this study, Pussard et al. 17 published paediatric reference intervals for urinary catecholamines and their metabolites including total normetanephrine and metanephrine. Our data demonstrate that the reference interval for total normetanephrine decreases with age and supports the findings of Pussard et al. However, this is not the case for the reference interval for total metanephrine, see Table 2. Pussard et al. applied direct sampling techniques; volunteers were asked to participate while attending the paediatric outpatient clinics. Data mining was the technique used in this study. The health profile of the reference subjects is comparable to those of Prussard et al. as NBL had been excluded.
In this study, a reference interval for urinary total normetanephrine and metanephrine was established using urine samples collected from patients in whom NBL had been ruled out based on a normal biogenic amine screen and subsequent clinical course. It is envisaged that these reference intervals may be used to aid in the diagnosis of NBL. There is some evidence that normetanephrine may be a superior biochemical marker in the diagnosis of NBL. 4,18 However, further research in this area is required. The establishment of the reference intervals in this study facilitates this.
DECLARATIONS