
Abstract
Background
Thiopurine S-methyltransferase (TPMT) phenotype analysis, expressed as TPMT activity, is established as a routine pharmacogenomic test to screen patients prior to initiating thiopurine drug therapy. Conventionally measured TPMT activity is corrected for red blood cell (RBC) parameters. Here we present evidence that supports the simplification of the TPMT assay: by expressing TPMT activity in mU/L whole blood, without undertaking any haemoglobin (Hb) correction.
Methods
Hb concentrations were compared in consecutive samples that had been received for TPMT phenotype analysis and which were stratified into samples with high (n = 111) and samples with normal (n = 50) Hb-corrected enzyme activity. TPMT activity was also measured in samples received for full blood count determination, stratified into those with low (n = 50) and normal (n = 50) Hb. A reference interval for TPMT activity in mU/L was derived from a correlation between activity expressed in conventional units and that expressed in mU/L (n = 1563), supported by comparison with associated genotype (n = 201).
Results
In the high TPMT activity group, 83% of specimens had a low Hb concentration compared with 14% of specimens in the normal TPMT group. Samples with a low Hb concentration were found to have significantly higher Hb-corrected TPMT activity than samples with a normal Hb concentration: 83 versus 44 nmol 6-methyl thioguanine /g Hb/h, P < 0.0001. These results strongly suggest that misleading high Hb-corrected TPMT activity is found in anaemic patients. Based on the reference interval for enzyme activity of 70–150 mU/L, phenotype–genotype concordance compared well with the conventional approach (88% versus 89%). Furthermore, distribution of TPMT phenotypes with activity expressed in mU/L was identical: 0.5% deficient, 11% low, 86% normal and 2.5% high, to when it was expressed in conventional units.
Conclusion
Expressing TPMT activity in mU/L can overcome misleading high Hb-corrected TPMT results occurring in patients with anaemia, which could lead to inappropriate treatment. Removing the need to measure RBC indices further simplifies TPMT phenotyping, leading to a more robust assay, with reduced turn-around time and cost.
Introduction
Thiopurine S-methyltransferase (TPMT) (EC 2.1.1.67) is an enzyme involved in the metabolism of thiopurine drugs, for example, azathioprine. Thiopurine drugs are widely used to treat chronic inflammatory and autoimmune disease, leukaemia and to prevent rejection post organ transplant. 1–4 The TPMT enzyme metabolizes 6-mercaptopurine to an inactive metabolite, effectively reducing concentrations of the active drug metabolites, 6-thioguanine nucleotides, which in excess are responsible for serious side-effects. 5–8
It has been established that TPMT activity exhibits a trimodal frequency distribution as a result of genetic polymorphism. 9 This pharmacogenomic variation has important consequences for treatment of patients, which has led to TPMT assessment now being accepted as routine practice prior to initiating thiopurine drug therapy. 2,10–14 While the majority of patients have normal levels of the enzyme and are started on a standard drug dose, those who are heterozygous for mutations on the TPMT gene (∼11%) 9 exhibit lower than normal TPMT activity and in clinical practice receive a reduced dose. 1,2,15–17 Patients who are homozygous for a TPMT mutation (∼0.3%), 9 with no demonstrable TPMT activity, are usually not treated with thiopurine drugs since they are at serious risk of developing life-threatening myelosuppression unless given extremely low doses. 2,6,18–21
The upper 2.5% of results are defined as high TPMT activity. Patients in this group are considered to be of potential interest as they may be predisposed to resistance to thiopurine drugs. 17,22,23 However, controversy exists as to whether they should receive an increased dose due to potential accumulation of toxic levels of the inactive drug metabolites, 6-methylmercaptopurine nucleotides. 7,17,24,25
As screening for TPMT status has become established in clinical practice, there has been a requirement in the laboratory to develop robust high-throughput and well-controlled assays, which can reliably assign the patient phenotype and keep up with the demand for testing. The TPMT enzyme is found in many cell types, 26,27 but for routine assessment erythrocyte activity is measured as a surrogate marker of an individual's capacity to metabolize thiopurine drugs. 14,17 Early assays measured enzyme activity in isolated and washed red blood cells (RBCs); 12,28,29 however, this was a laborious process and simpler methods have now been developed using whole blood. 30 Conventionally, TPMT activity has been related to a red cell parameter, for example, RBC count 29,31,32 or haemoglobin (Hb) concentration, 17,28,30 in order to account for the number of TPMT-containing RBCs in the sample. More recently, a semi-quantitative assay has become available, which reports enzyme activity in U/L, with no correction for haematological indices. 33
In this study, it was postulated that when TPMT is expressed conventionally in terms of Hb, there is an association between high TPMT activity and low Hb concentration. This was evaluated through two comparisons: Hb concentration in samples with high versus normal TPMT and TPMT activity in samples with low versus normal Hb. The validity of expressing TPMT activity in simplified mU/L of whole blood, where no RBC indices are required, was then explored. A reference interval for normal TPMT activity in mU/L was derived and this was underpinned by relating TPMT phenotype to the underlying genotype.
Methods
Samples
Samples were selected from whole-blood specimens referred to our laboratory for routine analysis of TPMT activity (reference intervals: deficient <6, low 6–34, normal 35–79 and high >79 nmol 6-methyl thioguanine [6MTG]/g Hb/h) to obtain comparison groups with high activity (consecutive samples >79 nmol 6MTG/g Hb/h, n = 111) and normal activity (consecutive samples 50–56 nmol 6MTG/g Hb/h, n = 50) and for the correlation of conventional units versus mU/L (1563 consecutive samples). Genotype results were available in 201 of the correlation samples, as analysis is routinely performed for internal audit purposes where TPMT is ≤40 nmol 6MTG/g Hb/h. Samples genotyped for any other reason were excluded from the phenotype–genotype concordance data.
The low and normal Hb groups consisted of sample-age-matched specimens taken from routine full blood count analysis, selected using computer-aided searches (<7 g/dL and falling within the laboratory reference interval male: 11.5–16.0; male: 13.2–17.5 g/dL], respectively). Samples were anonymized before entry into the study.
Samples used to obtain precision data were prepared from volunteers and constitute the routine internal quality control material for the assay. The Sandwell and West Birmingham Ethical Committee have given approval for collection of these samples.
Determination of TPMT activity
TPMT activity in whole blood was determined as described previously.
30
In brief, 200 μL of whole blood was lysed by freezing at −80°C before 700 μL of suspension buffer (0.1 mol/L phosphate buffer, pH 7.4, containing 100 mg/L
HPLC analysis
Quantification of the enzyme reaction product, 6MTG, was carried out by reverse phase HPLC (Shimadzu, Milton Keynes, UK), using a Kingsorb 3 μ C18 90A, 75 × 4.6 mm2 column (Phenonomex, Macclesfield, UK) and fluorescence detection (excitation and emission wavelengths, 310 and 390 nm, respectively). The mobile phase consisted of phosphate buffer (0.05 mol/L, pH 6.2; Sigma-Aldrich), acetonitrile (VWR, Lutterworth, UK) and tetrahydrofuran (VWR) in the ratio 89:7:4.
Derivation of TPMT activity
In all cases, TPMT activity was calculated from 6MTG peak heights. For routine analysis, activity is reported in terms of Hb concentration (nmol 6MTG/g Hb/h). Lysate Hb concentrations were measured on the ILab 600 (Instrumentation Laboratory, Warrington, UK). RBC parameters were measured on the Sysmex XE2100 (Sysmex, Milton Keynes, UK) and TPMT was arbitrarily expressed as pmol 6MTG/1 × 108 RBC for comparative purposes. Activity in U/L was defined as the amount of enzyme required to turn over 1 μmol of substrate in one minute under standard conditions (pH 7.4, 37°C).
TPMT genotyping analysis
DNA was extracted from whole blood using a Fujifilm QuickGene-810 system with the DB-S kit (Raytek Scientific Limited, Sheffield, UK). A multiplex amplification refractory mutation system (ARMS) technique was then utilized to screen for the most common TPMT mutations, TPMT*2 and TPMT*3 (A, C and D), which make up between 60% and 95% of mutant alleles for deficient TPMT activity in Caucasian, Asian and African-American populations. 34,35 This analysis was based on the method described by Roberts et al. 36 In order to simplify interpretation, individual ARMS reactions were combined into one TPMT wild-type and one TPMT mutant-specific multiplex reaction. 30
The polymerase chain reaction (PCR) was performed using the QIAGEN Multiplex PCR kit (Qiagen, Qiagen House, West Sussex, UK). Reactions contained a final concentration for each primer of 0.2 μmol/L and approximately 1 μg of DNA. To highlight any PCR failure, an internal control was included in each reaction which constituted primers to the 574 bp sequence of the β 2-microglobulin gene. Water blank controls for both the wild-type and mutant-specific ARMS reactions were also prepared for each batch of analysis. Reactions were performed in a Thermo Px2 thermal cycler (Fisher Scientific, Leicestershire, UK). Following activation (95°C, 15 min), amplification was performed over 30 cycles (template denaturation 94°C, 30 s; primer annealing 60°C, 90 s; primer extension 72°C, 30 s) before a final incubation (72°C, 2 min). PCR products were separated and visualized on 2% agarose containing 0.5 μg/mL of ethidium bromide.
Statistical methods
Statistical analyses were performed using Microsoft Excel and MINITAB Statistical Software Version 1.4 (MINITAB Inc, Coventry, UK). Data were checked for normality using the Shapiro–Wilk W test. Data are represented as median (25th–75th percentile). Non-parametric data-sets were compared using Mann–Whitney U analysis.
Comparison data for high TPMT (n = 111) and normal TPMT (n = 50) groups
TPMT, thiopurine S-methyltransferase; 6MTG, 6-methyl thioguanine; Hb, haemoglobin; RBC, red blood cell
Data represented as median (25th–75th percentile)
Results
High TPMT activity group versus normal TPMT activity group data
Hb concentrations were found to be significantly lower in the samples with high TPMT activity (high TPMT activity group) compared with those with normal activity (normal TPMT activity group) (P < 0.0001) (Table 1). This reflected the observation that in the high TPMT activity group, 83% of patients had an Hb concentration below the reference interval compared with only 14% of samples in the normal TPMT activity group. RBC counts were also significantly lower in the high TPMT activity group compared with the normal TPMT activity group (P < 0.0001).
When TPMT activity was expressed in terms of RBC count, or was expressed with no correction for red cell indices, the high TPMT activity group still had significantly higher (P < 0.0001) activity than the control group (Table 1). However, it was noted that the ratio of activities between the two groups was lowest for results expressed in mU/L (1.3 versus 1.5 and 1.7 for TPMT activity expressed in terms of RBC and Hb, respectively).
TPMT activities in samples with low and normal Hb concentration
TPMT activities, corrected for Hb, were found to be significantly higher (P < 0.0001) in samples with low Hb concentration (median [25th–75th centile]) (6.5 [5.5–6.7 g/dL]) compared with samples with Hb within the reference interval (13.7 [13.0–14.8 g/dL]) (Figure 1). High TPMT activity (>79 nmol 6MTG/gHb/h) was measured in 54% of samples with a low Hb, but in none of those with a normal Hb concentration.
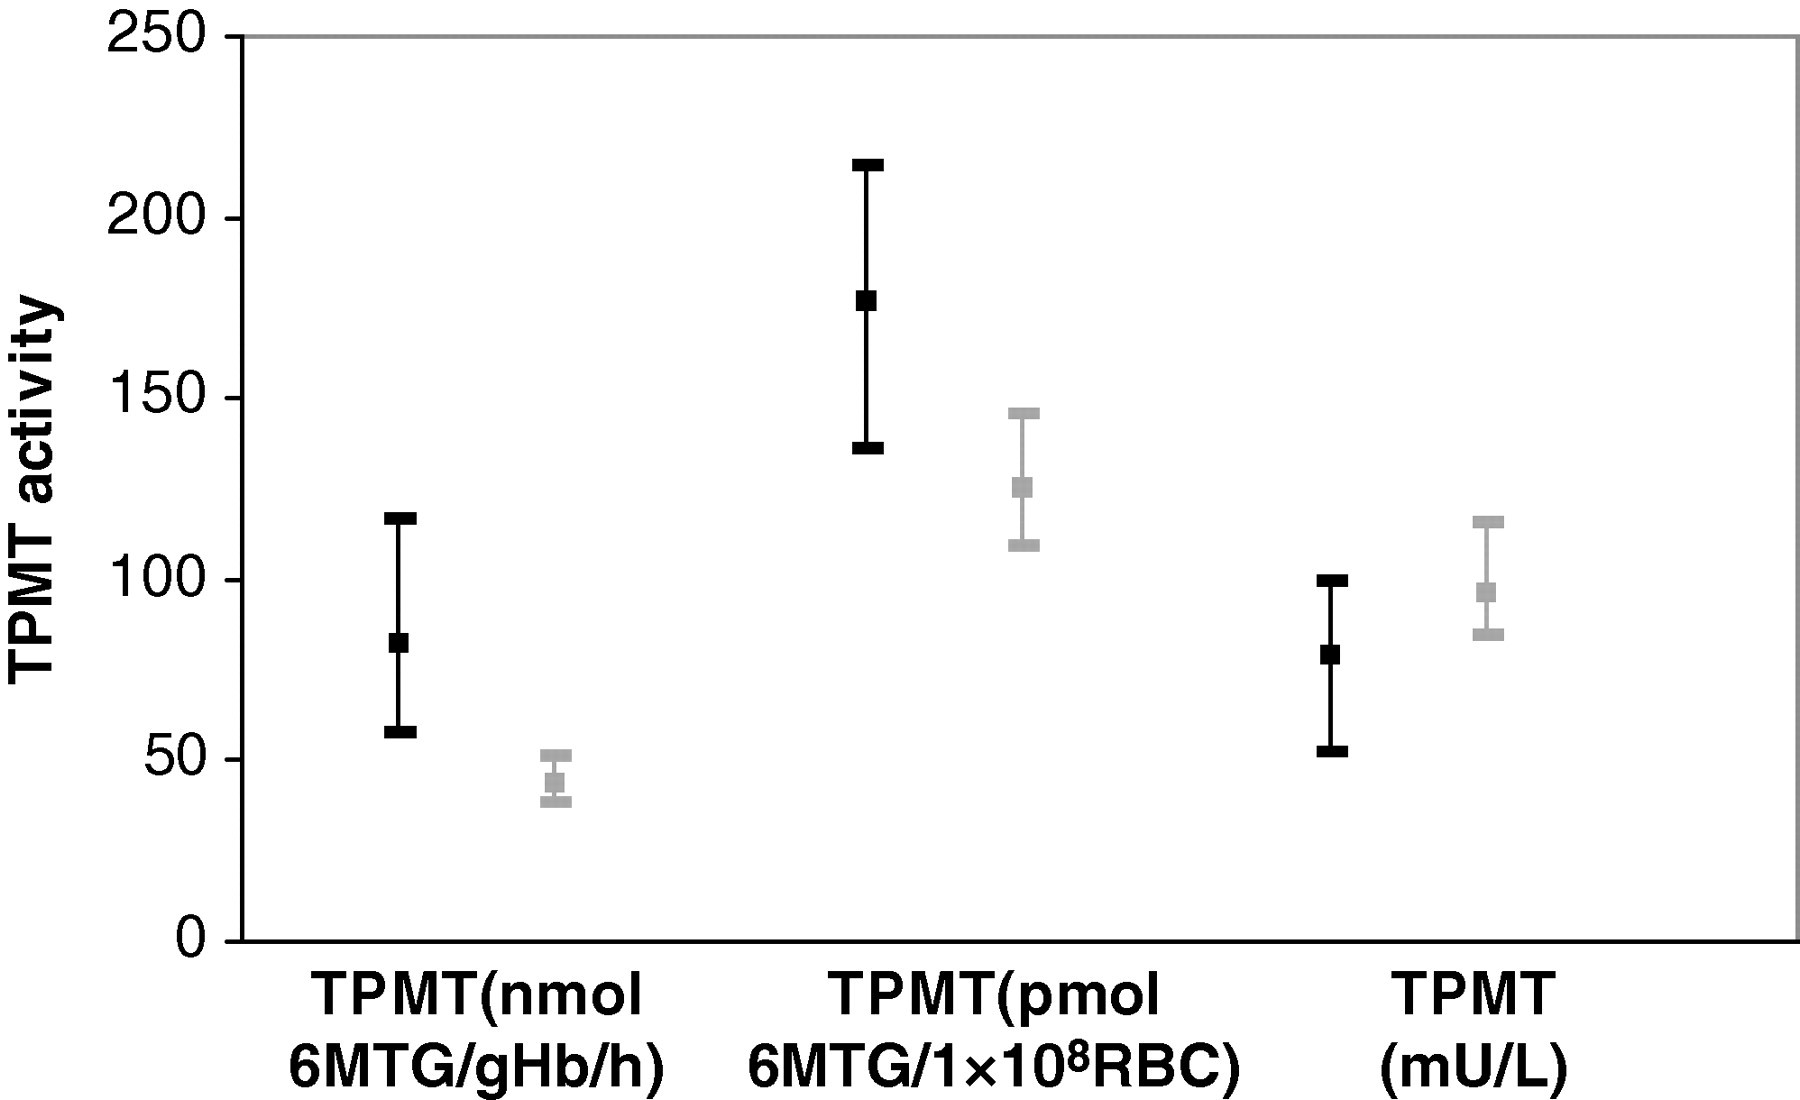
Representation of median and 25th–75th percentiles for thiopurine S-methyltransferase activities, expressed in different units, in the low (black) and normal (grey) Hb groups
When expressed in terms of RBC count, the TPMT activity was also higher in the low Hb group (P < 0.0001). Conversely, when expressed in mU/L, TPMT activity was demonstrated to be lower in the low Hb group (P < 0.001) (Figure 1).
Defining a reference interval
Figure 2 shows the correlation between TPMT activity expressed in conventional units and as mU/L, measured in 1563 consecutive samples.
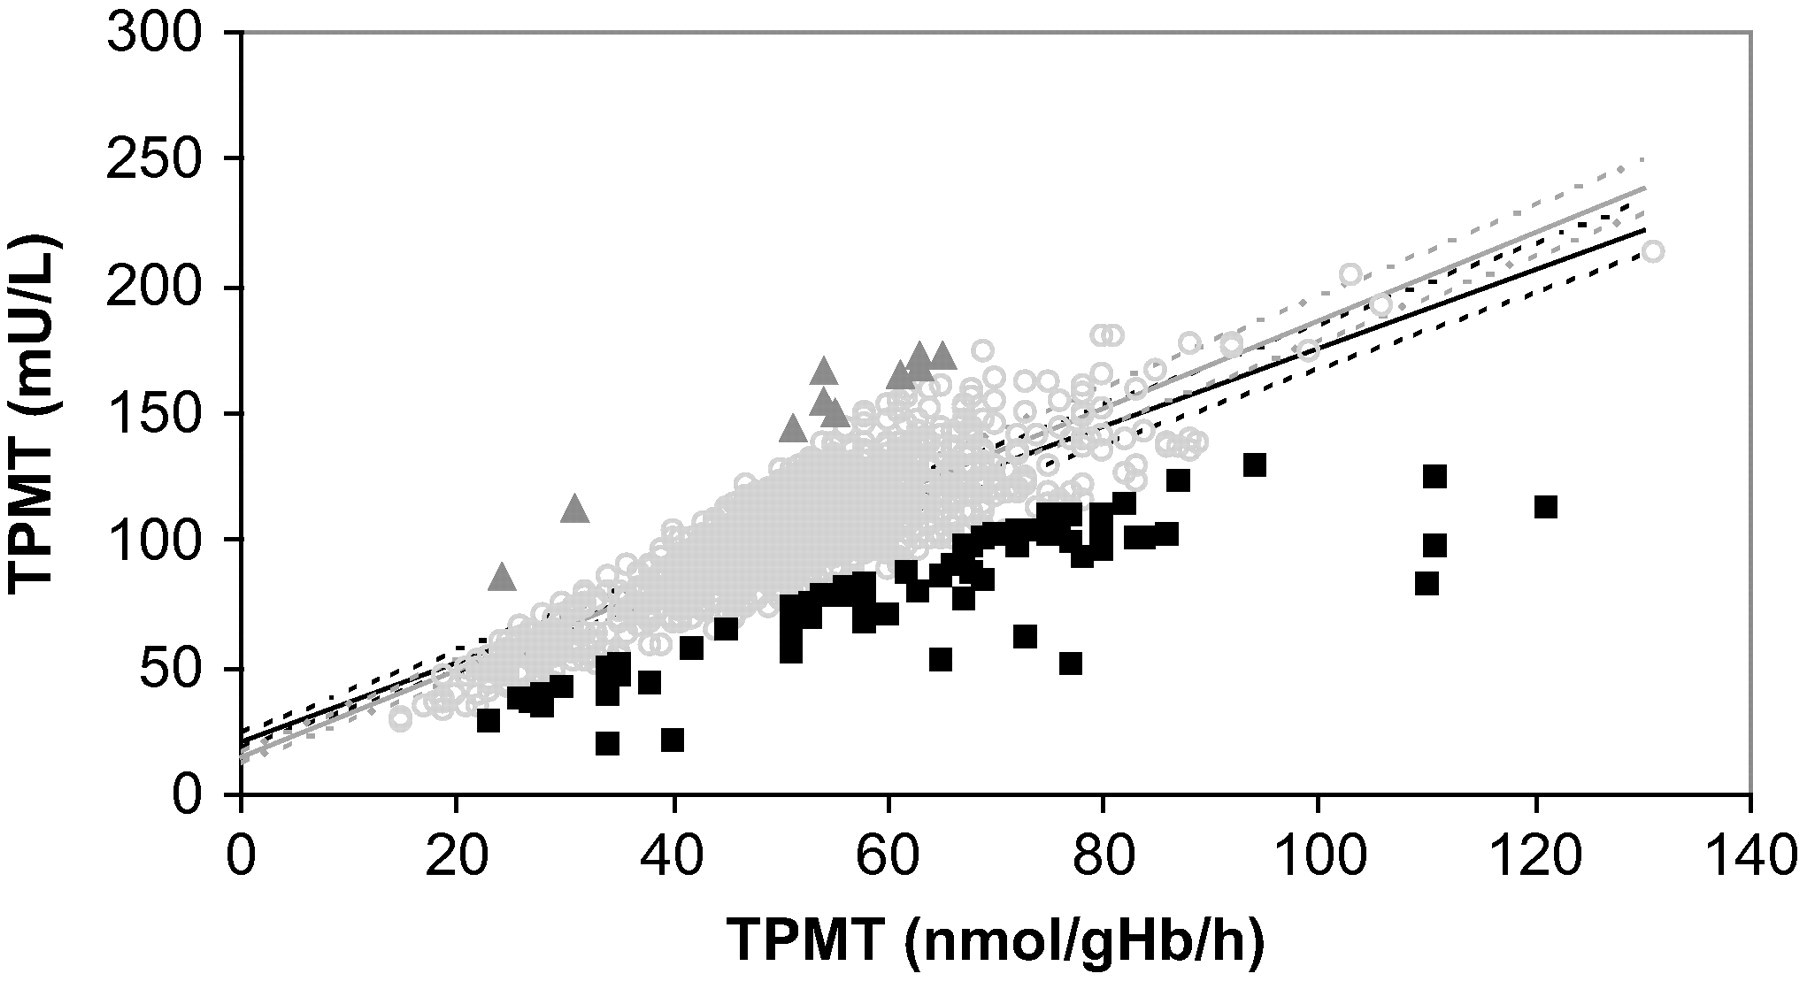
Correlation of thiopurine S-methyltransferase (TPMT) activity expressed in conventional units versus mU/L. Deficient TPMT data (activity <6 nmol 6-methyl thioguanine /g Hb/h) were excluded. Dark grey triangles, light grey open circles and black squares depict data with Hb >3.5, 2.0–3.5 and <2.0 g/dL, respectively. Regression analysis was performed on all data (black line) and excluding data points with lysate Hb <2.0 g/dL (grey line). Dotted lines represent 95% confidence intervals
Removing the correction for RBC indices resulted in samples with low Hb deviating from the linear trend of the data-set (y = 1.54x + 21.6), contributing to the scatter observed (R 2 = 0.63; 95% confidence intervals; slope: 1.48–1.60; intercept: 18.5–24.7). Increasing deviation was observed as TPMT activity increased. When regression analysis was performed excluding data points with lysate Hb < 2.0 g/dL (n = 72) (y = 1.73x + 14.3), scatter was reduced (R 2 = 0.85).
Figure 2 was extrapolated at the upper and lower reference limits in use for the conventional assay (35 and 79 nmol 6MTG/g Hb/h) to give a reference interval of 68–153 mU/L. Based on this, 87 data points (5.6%) disagreed in the classification of the patient between the two methods. All deficient results (undetectable TPMT activity) were classified consistently by both approaches; 1.5% (21) of samples with ‘normal’ TPMT activity would now have low activity (predominantly samples with low Hb concentration), while 11.3% (18) of samples with ‘low’ TPMT activity would now be classified as having normal activity (mainly samples with higher Hb concentration). Considering samples with high enzyme activity, 69% (26) would now be classed as normal (samples with low Hb concentration) and 1.5% (21) of previously normal results would be high when expressed in mU/L.
Phenotype–genotype concordance was compared in 201 samples with genotype data available, using various cut-off values for the lower limit of normal activity (Table 2).
Comparison of cut-off values for the lower limit of normal TPMT activity, expressed in mU/L
TPMT, thiopurine S-methyltransferase; 6MTG, 6-methyl thioguanine; Hb, haemoglobin
*Concordant genotypes: wild type (*1/*1) with normal TPMT activity; heterozygote (*1/*2, *1/*3) with low TPMT activity
The highest overall concordance between phenotype and genotype (88%) was obtained using a cut-off for normal activity of 70 mU/L and compared well with the concordance observed with the conventional approach (89%). Of the 14 low TPMT results with a non-concordant genotype, nine were also non-concordant when expressed as Hb-corrected TPMT activity. Similarly, 10 samples with normal activity in mU/L did not agree with genotype, of which three were discrepant with either approach. However, six low and four normal results became concordant with genotype when TPMT was expressed in mU/L.
Defining high TPMT activity as the upper 2.5% of results yielded an upper reference limit of 150 mU/L. Assuming a reference interval of 70–150 mU/L, the percentage of results in each phenotype classification was broadly similar to that obtained when TPMT activity is expressed in conventional units: deficient 0.51%; low 11.3% versus 10.2%; normal 85.7% versus 86.8%. However, it was noted the percentage classified as having low TPMT activity had increased slightly.
A frequency graph plotted for TPMT in mU/L clearly demonstrates the expected tri-modal distribution in TPMT activity: consisting of deficient, low and normal enzyme activity (Figure 3).
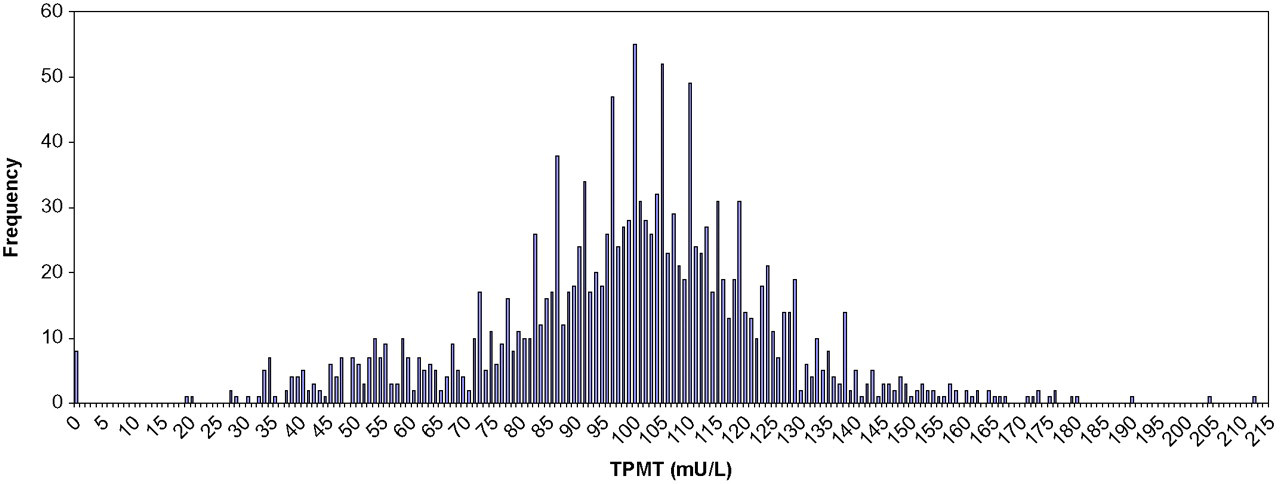
Frequency distribution of thiopurine S-methyltransferase activity (mU/L) in the 1563 consecutive results
A marked gap between samples with no demonstrable TPMT activity and those with low activity was evident. It was also noted that there remained some subjects with exceptionally high enzyme activity that were removed from the Gaussian distribution of activities observed.
Analytical performance of TPMT assay in mU/L
Within-batch coefficients of variation (CVs) for the mU/L assay were 3.3% and 2.4% at 85 and 127 mU/L, which compared with 2.4% and 2.3% at 40 and 57 nmol 6MTG/g Hb/h, respectively (n = 20). Between-batch CVs were 8.3% and 6.3% at 78 and 123 mU/L, which compared with 5.2% and 5.5% at 38 and 60 nmol 6MTG/g Hb/h, respectively (n = 49). The limit of quantitation, based on a signal-to-noise ratio of 6:1 for the 6MTG peak, was 9 mU/L.
Discussion
High versus normal TPMT and low versus normal Hb data
In this study, we have demonstrated that when whole-blood TPMT activity is expressed in terms of Hb, there is a strong association between high activity and low Hb concentration. Since TPMT activity should be independent of haematological indices, this suggests that in patients with anaemia, overcorrection may lead to misleading high TPMT results being reported. A relationship between high enzyme activity and low RBC count, although less pronounced, was observed when TPMT was expressed in terms of RBC.
Red cell indices are conventionally used to correct TPMT activity for the variation in the number of TPMT-containing RBCs in the sample. This was particularly important in early methods using washed cells, where variation in the density of the RBC pellet required a RBC parameter to give a quantitative result. In practice, we have shown that this indeed works well albeit in a relatively complex analysis. 28
However, correcting for red cell indices when measuring TPMT activity in whole blood makes the assumptions that the RBC population is homogeneous and that activity remains constant in each RBC with changing haematology. Lennard and co-workers 37 report that TPMT activity varies with RBC age and that higher activity is found in younger cell populations. A possible explanation for our findings therefore would be relatively increased numbers of young RBCs in the patients with low Hb. Multiple aetiologies may account for anaemia and some are more likely to be associated with increased young red cell populations than others, for example, haemolytic anaemia versus iron deficiency anaemia. We speculate that TPMT activity in the former may be affected to a greater extent by overcorrection with Hb or RBC than in the latter, even if the degree of anaemia is similar. Further work on TPMT activity in different types of anaemia is required to substantiate this.
Discrepancies between Hb and RBC correction were evident, even though the overall pattern was similar. This is not surprising since depending on the type of anaemia, Hb may be a poor marker of RBC content of the blood. Where Hb is low but RBC count is comparatively normal, a greater degree of overcompensation will be observed with Hb versus RBC correction.
Expressing enzyme activity in mU/L avoids misleading high TPMT results due to overcorrection for RBC indices. This has clinical significance, since patients with high TPMT activity may be treated with higher doses of thiopurine drugs and inappropriately increased dosing on the basis of this assay artefact may lead to toxic side-effects. While high TPMT results are relatively easy to identify, of greater concern are heterozygous patients with anaemia who may have a TPMT result raised into the normal reference interval.
Interestingly, TPMT activities in mU/L were found to be slightly lower in the low Hb group compared with the normal Hb group. It is likely that some association between TPMT activity, expressed in mU/L, and haematological parameters remains, particularly in patients with very low RBC counts, due to the lower number of RBCs in the analysis. However, these data indicate that this effect is much less pronounced than when TPMT activity is corrected for red cell indices and any perceived advantages of expressing TPMT in relation to Hb need to be balanced against the misleading results that we have shown may arise in certain patients.
Defining a reference interval
The reference interval for normal TPMT activity, 70–150 mU/L, was derived using two approaches: from the correlation between TPMT in conventional units and mU/L and through maximizing agreement between TPMT phenotype–genotype. The fact that percentages of low and normal TPMT results remained similar and the overall concordance between phenotype and genotype was comparable to that observed with conventional units provided further evidence to support the validity of this approach.
Although agreement between TPMT phenotype and genotype provides a good indication of the accuracy of TPMT enzyme activity determination, 38 it has some limitations. First, some subjects with a wild-type (*1/*1) TPMT genotype may harbour a rare mutation associated with low enzyme activity that is not screened for. A second underlying reason for discordance would be samples from patients who had received blood transfusions that had not been divulged, since TPMT phenotype is strongly influenced by enzyme activity of the donor blood, whereas TPMT genotype remains true to the patient. 39 Furthermore, only patients with TPMT activity ≤40 nmol 6MTG/g Hb/h had genotype analysis performed; hence, overall concordance based on all samples, including those with normal TPMT activity, would be expected to be substantially higher.
The frequency of TPMT activities in this data-set revealed the expected tri-modal distribution of deficient, low and normal activity. A gap between patients with deficient status and those with low activity has also been observed with the conventional TPMT approach. 30 In our experience, activities within this range are seen in deficient patients who have received a blood transfusion, where enzyme activity in the donor RBCs masks the lack of activity in the patient's own blood. From these data, a TPMT activity of <10 mU/L is suggested to define deficient status with a lower limit for low activity of 20 mU/L. It was interesting to note that when expressed in mU/L, there were still patients with exceptionally high TPMT activity. It has not yet been established whether this represents a variation of normal or whether activating mutations exist on the TPMT gene. 17
Determination of TPMT phenotype is the first widely applied example of pharmacogenomic testing and is now advocated in all patients who are to start thiopurine drug therapy. 2,10,14,24 Furthermore, the avoidance of costly adverse drug reactions has been proven to be cost-effective. 40,41 To be fit for purpose in modern health care, a service must produce reliable results within a minimal turn-around time. Reporting TPMT activity in mU/L offers a substantial simplification of the assay procedure since Hb analysis is no longer required. This will enable a greater ability to undertake large numbers of TPMT phenotyping, with a subsequent reduction in analyser and staff time leading to improved turn-around times and reduced cost.
Analytical performance of the new approach to the assay was found to be comparable with that when TPMT activity was expressed in terms of Hb concentration. The slight increase in between-batch CV was thought to be due to settling of the cells during aliquoting of large quantities of the whole-blood quality control material. Whereas this did not present a problem with Hb-corrected TPMT, where Hb acts as an internal standard to overcome such variation, continuous mixing would become of the utmost importance when reporting TPMT in mU/L.
TPMT phenotyping, along with appropriate support from genotyping, is a clinically effective way of operating a TPMT service. Although TPMT assay is relatively complex, in a regional or national centre it is possible to analyse large numbers of samples with excellent precision and with interpretative and scientific support. It is important that as services grow that there is a dynamic facilitating further development of the assay to optimize methods and the quality of the overall service offered.
DECLARATIONS