
Abstract
Background
It is desirable that current assays for cardiac troponin (cTn) are able to meet the recommended criterion that the diagnosis and risk assessment of patients present with symptoms of myocardial infarction requires a rise and fall in cTn with at least one point above the 99th percentile of a reference population. We have evaluated the analytical characteristics of the new highly sensitive troponin T (hs-TnT) assay to see if it meets this criterion and applied it to a carefully defined, cardio-healthy Australian reference population.
Methods
An imprecision profile was determined for the Roche hs-TnT assay (Roche Diagnostics, Sydney, Australia) using multiple samples analysed on nine separate occasions. The distribution of troponin T was determined using 104 samples from a cardio-healthy population.
Results
The new hs-TnT assay meets the specifications of a coefficient of variation of 10% at the 99th percentile of our cardio-healthy reference population. Of the 104 samples analysed 44 showed troponin T concentrations above the manufacturer's quoted limit of detection. Age and gender differences in the median and 99th percentile troponin T concentration were observed.
Conclusions
The new hs-TnT assay shows improved precision and sensitivity at very low troponin concentration. We have shown that a significant number of individuals in this cardio-healthy population had detectable circulating troponin concentration. With many apparently healthy people having detectable troponin, clinical judgement will become more important in interpreting troponin results.
Introduction
Myocyte necrosis can be recognized by the appearance of biochemical markers in the blood. The recommended biochemical marker for the diagnosis and risk assessment of patients with myocardial infarction by the European Society of Cardiology and the American College of Cardiology is a rise and fall of cardiac troponin (cTn) with at least one value above the 99th percentile of a reference population the upper reference limit (URL), and the assays used should have an imprecision, coefficient of variation (CV) of ≤10% at this cut-off point. 1 .The use of the 99th percentile of a reference population as a decision point (URL) has some limitations in that many of the currently used assays lack the sensitivity to measure troponin in healthy individuals. 2
The criteria for defining a reference population are still undefined. 2,3 The National Academy of Clinical Biochemistry suggests that reference values and decision limits should be based on a healthy population without a history of known cardiac disease. 4 Tate 5 has suggested that troponin reference intervals need to be established, which allow differentiation of people at cardiovascular risk using populations that are cardio-healthy.
The new generation of highly sensitive assays with greater analytical sensitivity and precision at low concentration has demonstrated the presence of troponin in the majority of apparently healthy persons. 6–8 . There have, however, been only a limited number of reference interval studies where the population used has been screened and deemed to be cardio-healthy. As these new highly sensitive assays become common in clinical practice, more individuals will be present in emergency rooms, with detectable troponin. It is particularly important that we review the troponin levels in a cardio-healthy reference population to address this issue.
Tate et al. 9 performed a study using 111 apparently healthy Australian community individuals for whom questionnaire, blood tests and stress echocardiography were used to determine cardiovascular health. Of these 111 individuals, three were rejected based on cardiovascular assessment. We have revisited this population using the 5th generation highly sensitive troponin T (hs-TnT) assay from Roche Diagnostics (Sydney, Australia), and report our findings in this paper.
Materials and methods
Ethics
Ethics approval was received from the Princess Alexandra Hospital Ethics Committee, Wooloongabba, Queensland, Australia and a written consent was obtained from the reference subjects.
Reference population subjects
Community volunteers from Brisbane, Australia whose ages ranged between 25 and 74 y completed a questionnaire to determine eligibility. The questionnaire was used to exclude those volunteers with diabetes mellitus, hypertension, known cardiac disease, known or treated hyperlipidaemia and those taking cardio-active medications such as beta blockers, calcium channel blockers and ACE inhibitors. The final population selected for the study was 62 men and 49 women. The subjects underwent stress echocardiography and routine chemistry testing on blood and urine including electrolytes, urea, creatinine, calcium, phosphate, liver enzymes, glucose, iron, ferritin, transferrin, cholesterol, triglycerides, HDL-cholesterol, HbA1c (form of glycosylated haemoglobin) and urine total protein and albumin. Three individuals were identified as not meeting the criteria to be considered cardio-healthy and were excluded. These individuals showed cardiovascular abnormalities by stress angiography such as angina and ST depression with apial/anterior abnormal wall motion, left bundle branch block and apial hypokinesia at rest or apial hypokinesia with probable segmental scar. Sufficient sample was available for further testing on 104 (57 men, 47 women) of these 108 subjects.
Reference population samples
Blood samples were collected into Greiner SST (Serum) tubes (Greiner Bio-one, Sydney, Australia), centrifuged at 3000
Imprecision profile samples
Blood samples were collected from four patients known to have had a myocardial infarct and with detectable levels of troponin into Becton Dickinson PST gel (Becton Dickinson, Sydney, Australia) (lithium heparin) collection tubes. The plasma from these samples was pooled after centrifugation at 3000
Method comparison samples
Blood samples were collected into Vacuette tubes with separator gel (Greiner SST (serum) and PST (lithium heparin)) from 96 patients undergoing either hemo or peritoneal dialysis and having routine cTn test performed. This population was selected, because a much higher proportion of patients have detectable troponin in their blood.
12
All blood samples were collected immediate to predialysis and processed within 2 h of collection. Samples were centrifuged at 3000
Cardiac troponin T assays
Reference population, imprecision and method comparison samples were analysed by hs-TnT (single reagent lot number) and the 4th generation TnT assays on the Roche E411 analyser (Roche Diagnostics, Sydney, Australia), The hs-TnT assay was calibrated thrice during this study.
Data analysis
Troponin concentrations are reported as ng/L. Between-run standard deviation of replicate hs-TnT measurements (n = 18 for each hs-TnT concentration) was used in the variance function program (VFP Version 8.1, W.A. Sadler, Christchurch, New Zealand) to determine the hs-TnT imprecision profile. Troponin concentrations at 10 and 20% CV were determined from the profile. For a comparison of methods, the Passing–Bablok regression analysis was used.
For statistical analysis to determine the 99th percentile URL, all results below the manufacturer quoted limit of blank (LoB; 3 ng/L) were assigned a concentration of 3 ng/L.
Results
Imprecision
Between-run imprecision for the hs-TnT assay using commercial quality control material (PreciControl Troponin, Roche Diagnostics, Sydney, Australia) during the study period was 8.4% at 28.5 ng/L and 5.1% at 2313 ng/L cTnT. Linearly related dilutions in the hs-TnT range 5–340 ng/L were used for the precision study. From the imprecision profile (Figure 1) the 10% CV corresponded to a TnT concentration of 11.9 ng/L and the 20% CV corresponded to a TnT concentration of 6.8 ng/L. Between-run imprecision and the recovery of TnT on sample dilution are shown in Table 1.
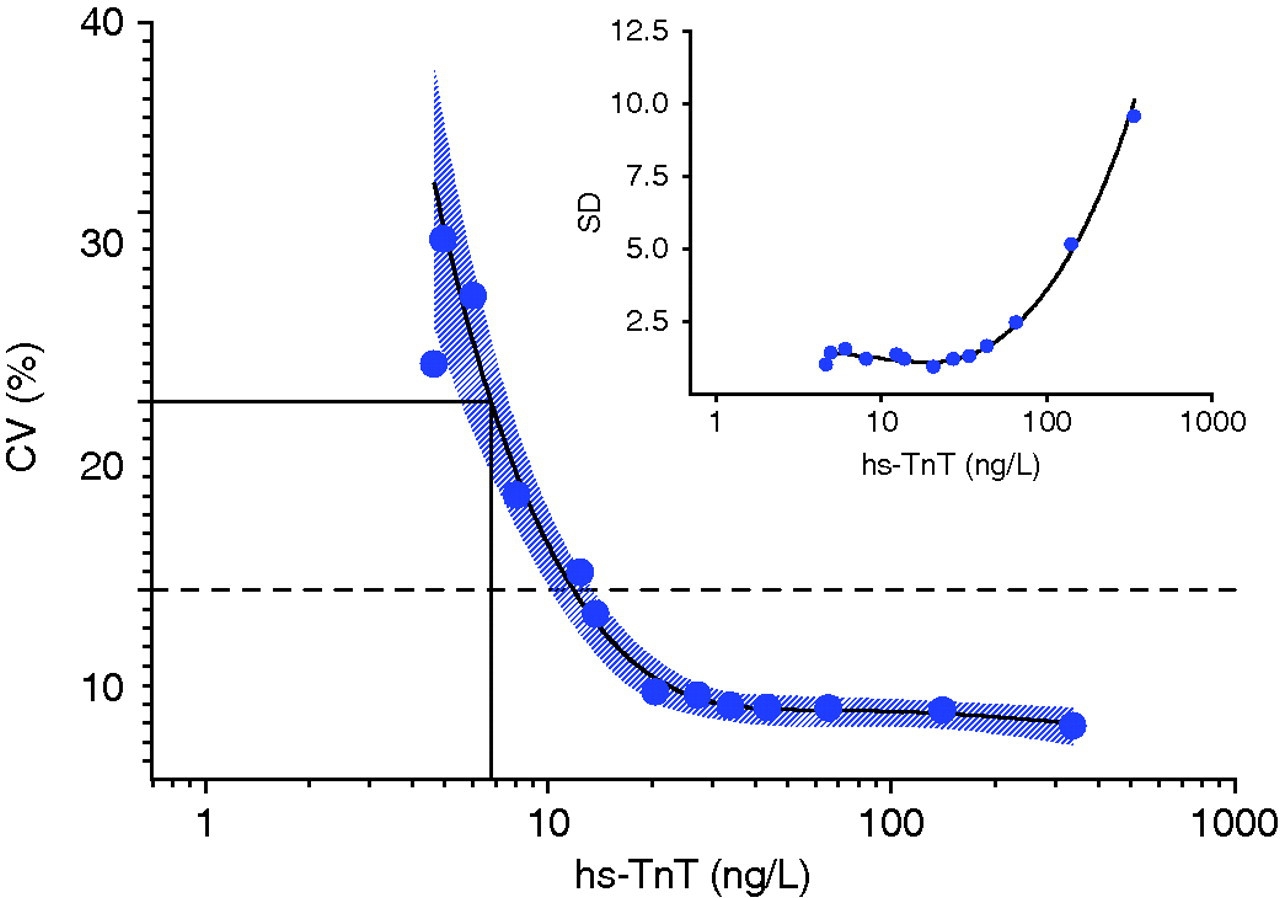
Imprecision profile of % coefficient of variation (CV) and standard deviation (SD) versus troponin concentration (logarithmic scale) determined by the measurement of low-level cardiac troponin (Roche hs-TnT) on nine separate occasions. Troponin concentrations at 10 and 20% CV are shown by the dotted and solid horizontal lines respectively
Measured mean cardiac troponin concentrations, recovery and imprecision for nine daily measurements of 13 linearly related plasma samples
*Sample 1 represents the myocardial infarction patient pool
†Sample 13 represents the healthy donor pool
Method and sample type comparisons
Ninety-six paired samples in the range 27–330 ng/L using hs-TnT assay and 11–500 ng/L using cTnT 4th generation assay were compared. The Passing Bablok regression analysis gave a slope of 0.77 (95% CI [confidence interval] 0.73–0.81), intercept 20.4 (95% CI 18.7–23.9) and r 2 of 0.96 (Figure 2). Bland Altman analysis, seen in Figure 3, shows concentration above a cut-off point of 93 ng/L for the hs-TnT assay were lower than those obtained using the 4th generation TnT assay. Below this cut-off point, hs-cTnT concentration was higher than those obtained by the 4th generation assay.
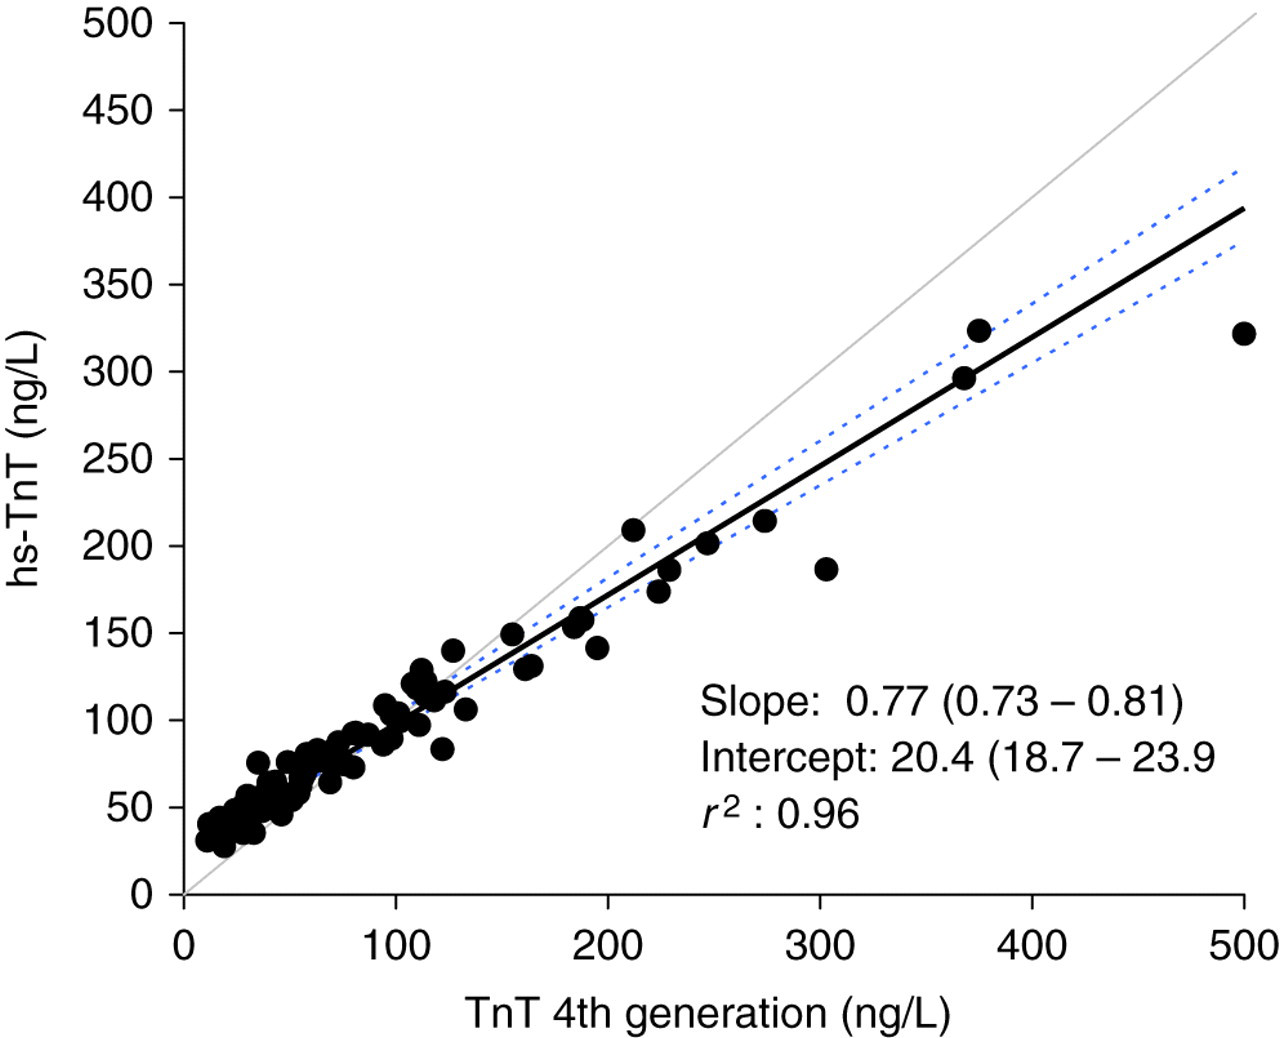
Passing–Bablok regression analysis plot of cardiac troponin T for 96 plasma samples. The values for the regression slope and y-intercept are shown with the 95% confidence intervals given in brackets and as dotted lines on the figure
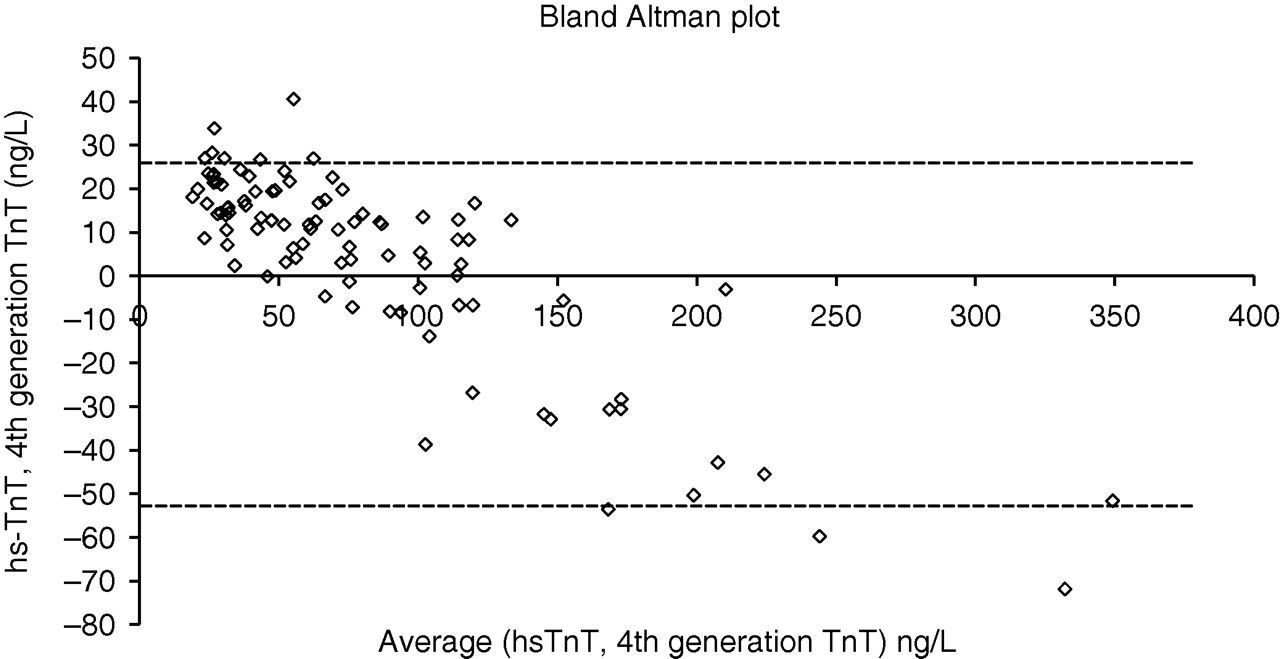
Bland Altman analysis of cardiac troponin T for 96 plasma samples. The 95% confidence intervals are shown by the dotted line. Polynomial regression analysis shows an x-intercept at 93 ng/L
No significant difference was seen between serum and plasma using hs-TnT assay in the TnT range 13–188 ng/L (slope 0.99 [95% CI 0.96–1.02], intercept 0.52 [95% CI −1.92 to 2.95], r 2 0.99).
Reference population
One hundred and four cardio-healthy subjects had samples available for analysis (57 men and 47 women). All samples tested were below the manufacturer quoted LoD for the cTnT 4th generation assay (<10 ng/L), which is consistent with the findings of Tate et al. 9 The concentration distribution for the hs-TnT assay is shown in Figure 4, and shows a non-Gaussian distribution being skewed towards the manufacturer quoted LoB (3 ng/L). Sixty samples gave hs-TnT concentrations below the manufacturer quoted LoD (5 ng/L). Twenty-seven of these were below the quoted LoB with 33 between LoB and the LoD, 43 were between this LoD and the manufacturer quoted 10% CV concentration of 13 ng/L, with one sample greater than the manufacturer quoted 99th percentile URL. For this study cohort, the 99th percentile URL was determined to be 12.5 ng/L.
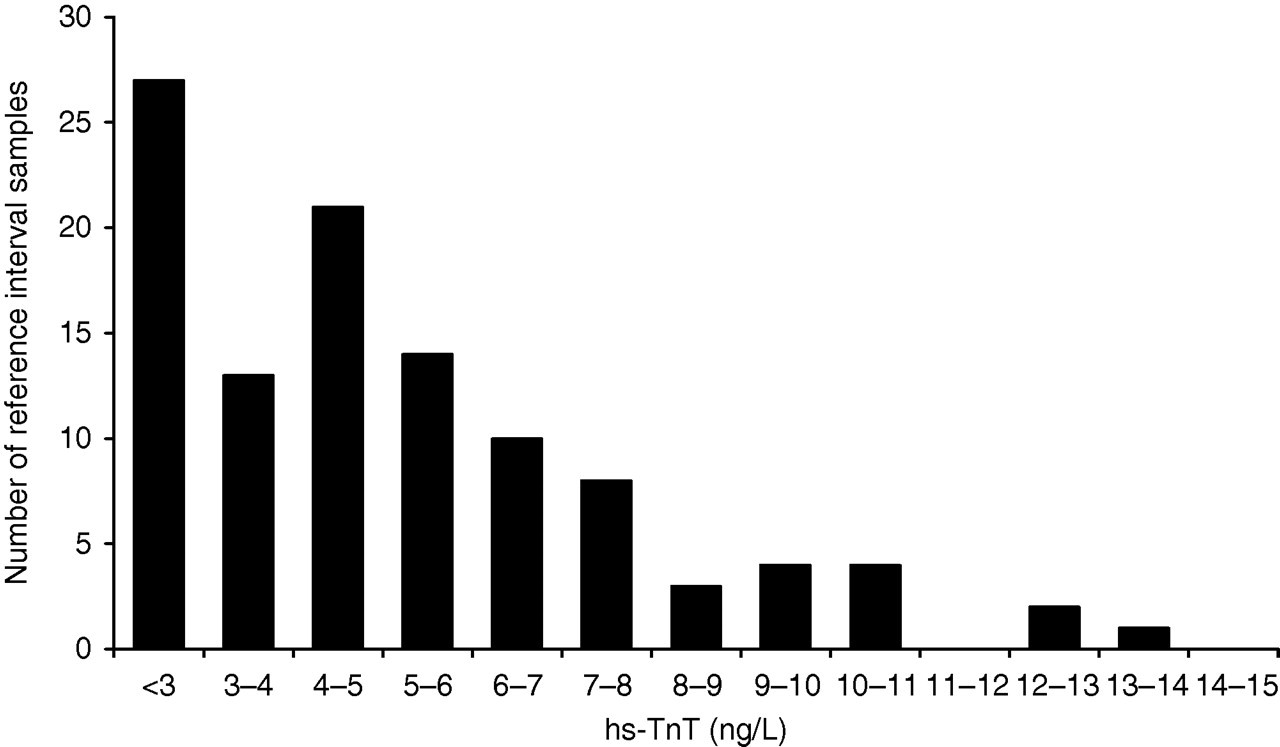
Distribution of serum troponin concentrations for the Roche hs-TnT method
A significant difference in median hs-TnT concentration (P < 0.01, Mann-Whitney U test) was observed between men and women. A difference was also seen between median troponin concentrations and the age range of <60 and 60+ y for both men and women. These relationships are seen in Table 2.
Median cardiac troponin T concentrations and 99th percentile values in men and women younger and older than 60 y
Discussion
The new hs-TnT assay has significantly improved analytical performance at a very low concentration of troponin. In this cardio-healthy population, 42% had cTnT greater than the manufacturer quoted LoD (5 ng/L), whereas the 4th generation TnT assay did not detect troponin in any of these 104 subjects. Jacobs et al. 13 using precommercial hs-TnT reagent and an LoD of 1 ng/L found that 92% of a healthy population had troponin concentrations above the LoD. In a recent study by Reichlin et al. 14 an LoD for the hs-TnT assay of 2 ng/L was used. If the cTnT concentration of the subjects in our study is compared with these detection limits, then at least 74% had detectable troponin. The method of comparison of the 4th generation TnT with the hs-TnT assay showed a good correlation with r 2 > 0.96. The regression analysis was different from that of the manufacturer (y hs−TnT = 0.77 × 4th−gen TnT + 20.4 ng/L) compared with manufacturer (y hs−TnT = 0.99 × 4th−gen TnT + 0.47 ng/L). This difference may reflect the variation in the analytical ranges used (manufacturer 3–8100 ng/L; our study 5–338 ng/L) or the subject groups (i.e. healthy versus dialysis patients). Degraded forms of cTnT have been reported in renal dialysis patients 15 and may react differently in the two cTnT assays. The analysis of paired serum and plasma samples for the hs-TnT assay indicated that there is no significant difference between serum and plasma down to a concentration of 13 ng/L.
International guidelines 1 have recommended that the 99th percentile and the 10% CV need to be validated for each troponin assay by routine testing laboratories. Contemporary troponin assays, which lack analytical sensitivity and accuracy close to the assay detection limit, give undetectable troponin concentration for a large percentage of reference subjects. As a consequence, the 99th percentile URL could be markedly skewed by including subjects with pathology. We found and excluded three such persons from our study. If these subjects had been included, our conclusions regarding the 99th percentile may have been markedly different. Our study has demonstrated that even after using the hs-TnT assay, 60/104 samples were below the manufacturer quoted LoD with 27/104 below the manufacturer quoted LoB contributing to the skewness of this reference population.
There is still the requirement to define what is a normal apparently cardio-healthy reference subject 2,3 and for manufacturers to use the same set of reference subjects to determine the URL for same-generation troponin assays. Eggers et al. 16 have demonstrated that the reference population selected has an effect on the determination of the 99th percentile. Recent reports 9,17,18 have demonstrated that the measurement of cTnI in sample sets from different groups of apparently healthy subjects can produce different 99th percentile values for the same assay. Using the ADVIA Centaur TnI-Ultra™ 2nd generation assay (Siemens Healthcare Diagnostics, Sydney, Australia), in three different reference populations the 99th percentile URLs were 0.021, 0.039 and 0.040 μg/L with the cardio-healthy population who were negative by stress echocardiography giving the lowest cTnI URL. 9,17,18
In our study, using the same reference population, the 99th percentile URL by hs-TnT was 12.5 ng/L, which is similar to the manufacturer's limit. Giannitsis et al. 19 in their study of 616 individuals demonstrated a 10% CV of 13.0 ng/L with the 99th percentile for the entire population of 13.5 ng/L. This study also observed a significant difference (P < 0.01) between the 99th percentile of both men (14.5 ng/L) and women (10.0 ng/L). Mingels et al. 7 using a precommercial version of the hs-TnT assay in a reference population consisting of 546 apparently healthy persons from a health-check hospital programme obtained a 99th percentile URL of 16 ng/L. This study also observed significant differences in age and gender. Although small in number, our study supports both the findings of gender and age differences by Mingels et al. 7 and the findings of analytical performance by Giannitsis et al. 19 .
The objective of our study was to define the analytical characteristics of the new Roche hs-TnT assay and apply it to a carefully defined, cardio-healthy reference population. Of great interest is that the majority of our cardio-healthy subjects had detectable cTnT in their blood. Clerico 18 has suggested that detectable troponin in the healthy population may be due to myocyte turnover and the physiological remodelling of the myocardium. This myocyte turnover may reflect the physiological and pathological processes. 20,21 If troponin is present in the blood of many healthy persons, it requires greater reliance on clinical judgement reminiscent of when CK-MB was the cardiac marker used. The universal definition of myocardial infarction requires a rise and fall in troponin concentration with at least one value greater than the 99th percentile of the reference value distribution. With this in mind, we need to understand the biological variation of cTn in the cardio-healthy population and the physician may need to consider serial sampling to determine the acute or chronic nature of an elevated cTnT.
DECLARATIONS