
Abstract
Background
A steady-state trough plasma itraconazole concentration greater than 500 ng/mL is a therapeutic target for itraconazole. A simple, rapid and sensitive high-performance liquid chromatography-based method was developed for quantitation of itraconazole and hydroxyitraconazole in human plasma.
Methods
Itraconazole and hydroxyitraconazole were separated using a mobile phase of 0.5% KH2PO4 (pH 6.0)-acetonitrile (30:70, v/v) on a CAPCELLPAK C18 MGII column at a flow rate of 0.5 mL/min and ultraviolet absorbance at 260 nm.
Results
The analysis required 200 μL of plasma and involved a rapid, simple solid-phase extraction with an Oasis HLB cartridge, which resulted in recoveries of 87–92% for itraconazole and 91–94% for hydroxyitraconazole. The lower limit of quantification for itraconazole and hydroxyitraconazole was 5 ng/mL each. Intra- and interday coefficients of variation for itraconazole and hydroxyitraconazole were less than 11.3% and 12.2%, respectively, and accuracies were within 11.7% and 4.5% over the linear range, respectively. Although the steady-state plasma concentrations of itraconazole and hydroxyitraconazole ranged from 506 to 2482 ng/mL and from 766 to 2444 ng/mL, respectively, after a two-day loading dose of 400 mg/day intravenous itraconazole followed by the administration of 200 mg/day itraconazole oral solution, calibration curves of itraconazole and hydroxyitraconazole showed positive linearity in a concentration range of 5–2500 and 50–2500 ng/mL, respectively.
Conclusions
Our results indicate that this method is applicable for the monitoring of plasma levels of itraconazole and hydroxyitraconazole in a clinical setting. Furthermore, the regimen presented here might also be effective in preventing infection, but further studies with large sample sizes are necessary to investigate this avenue.
Introduction
Itraconazole (Figure 1) is an oral triazole anti-fungal agent with a broad anti-fungal spectrum covering Aspergillus, Blastomyces, Candida, Coccidioides, Cryptococcus, Histoplasma, Paracoccidioides and others. 1–3 Itraconazole is metabolized by cytochrome P450 (CYP) 3A4 in the gastrointestinal tract and liver to the active metabolite hydroxyitraconazole (Figure 1), which has steady-state plasma concentration two-fold higher than that of itraconazole. 4–6
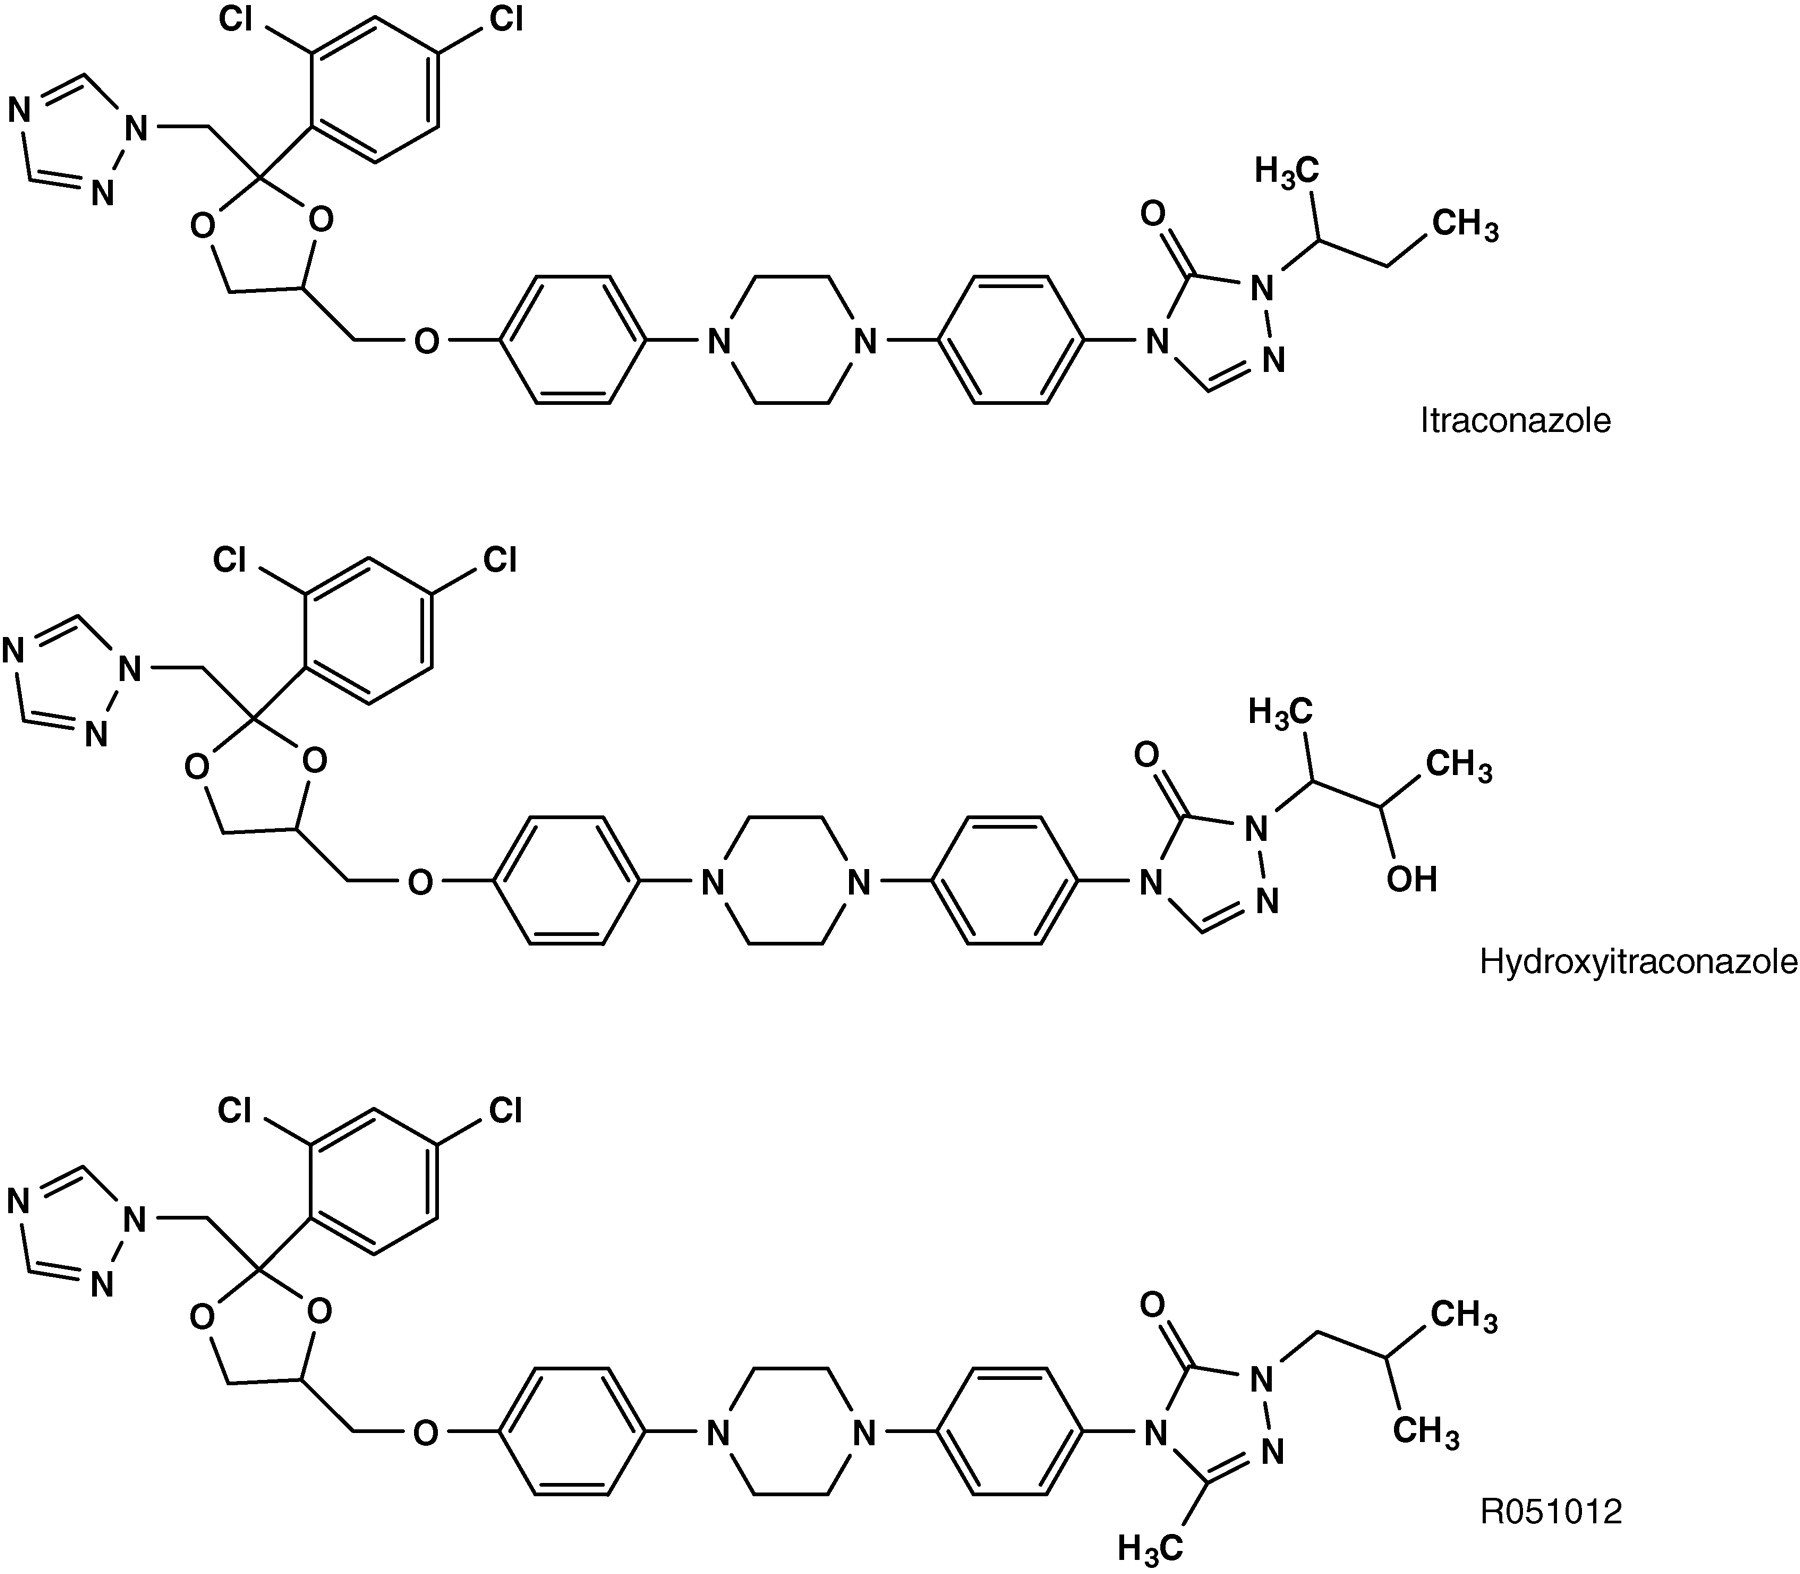
Chemical structures of itraconazole, hydroxyitraconazole and the internal standard R051012
The 90% minimum inhibitory concentration (MIC90) value of itraconazole for Asperigillus species is 500 ng/mL. 7 A steady-state mean trough plasma itraconazole concentration of more than 500 ng/mL is considered a therapeutic target for itraconazole. 8 Itraconazole has three formulations: the capsule formulation, oral solution and intravenous formulation. A proposed regimen that enables this target concentration (500 ng/mL) to be reached rapidly consists of treatment with intravenous itraconazole (200 mg twice daily for 2 d and then 200 mg once daily), followed by treatment with the oral formulation. In two oral formulations of itraconazole, the oral solution of itraconazole has higher bioavailability than the capsule formulation. 9,10 The use of these three formulations should result in therapeutic monitoring of itraconazole plasma concentration.
For quantitative determination of itraconazole and hydroxyitraconazole in human plasma, liquid chromatography-tandem mass spectrometry (LC/MS/MS) and high-performance liquid chromatography coupled with electrospray mass spectrometry (HPLC/MS) have been reported. 11–15 However, laboratories with LC/MS/MS and HPLC/MS are not always available in a standard hospital. Another method, the HPLC-based method with ultraviolet (UV) detection, has been reported for quantitation of itraconazole and hydroxyitraconazole in human plasma. 16–19 The above methods require multistep liquid–liquid extraction or solid-phase extraction and relatively large sample volumes (1 mL) to achieve sensitivity. In the present paper, a simple one-step solid-phase extraction process prior to HPLC-UV analysis allowed us to remove efficiently endogenous interfering substances from plasma. In addition, the extraction procedure used for pretreatment of plasma samples ensures high recovery from a relatively small volume of plasma (200 μL) for complete analysis. The method presented here is rapid and simple, and consists of solid-phase extraction followed by HPLC-UV, allowing the determination of concentrations of itraconazole and hydroxyitraconazole in human plasma. This method is currently being used in our hospital to measure plasma concentrations of itraconazole and hydroxyitraconazole.
Experimental
Chemicals and reagents
Itraconazole, hydroxyitraconazole and the internal standard R051012 were provided from Janssen Pharmaceutical KK (Tokyo, Japan). An Oasis HLB extraction cartridge was purchased from Waters (Milford, MA, USA). All other reagents were purchased from Nacalai Tesque (Kyoto, Japan). All solvents were HPLC grade.
To generate standard curves, stock solutions of itraconazole and hydroxyitraconazole were prepared by dissolving the dry reagents in methanol to yield concentrations of 1.0 mg/mL. Working standard solutions of itraconazole (5, 50, 250, 500 and 2500 ng/mL) and hydroxyitraconazole (50, 250, 500, 1250 and 2500 ng/mL) were prepared by serial dilution with methanol.
Chromatographic conditions
A PU-2080 Plus chromatography pump (JASCO, Tokyo, Japan) equipped with an UV-2075 Plus ultraviolet detector (JASCO) was used. The HPLC column was a CAPCELL PAK C18 MGII (250 mm × 4.6 mm ID; Shiseido, Tokyo, Japan). The mobile phase was 0.5% KH2PO4 (pH 6.0)-acetonitrile (30:70, v/v), which was degassed in an ultrasonic bath prior to use. Before mixing with acetonitrile, the pH of the 0.5% KH2PO4 was adjusted with 2 mol/L potassium hydroxide. The flow rate was 0.5 mL/min at ambient temperature and sample detection was carried out at 260 nm.
Extraction method
Following the addition of R051012 (50 ng) in methanol (10 μL) to a 200 μL plasma sample as an internal standard, the plasma sample was diluted with 800 μL water and vortexed for 30 s. This mixture was applied to an Oasis HLB extraction cartridge that had been activated previously with methanol and water (1.0 mL each). The cartridge was then washed with water (1.0 mL) and 70% methanol in water (1.0 mL), and eluted with 100% methanol (1.0 mL). Eluates were evaporated to dry in a vacuum at 40°C using a rotary evaporator (Iwaki, Tokyo, Japan). The residues were then dissolved in 20 μL methanol and vortex-mixed for 30 s; the mobile phase (20 μL) was added to each sample and samples were vortex-mixed for another 30 s. An aliquot of 20 μL of each sample was then processed on the HPLC apparatus.
Calibration curve
The calibration curves were obtained from spiked blank plasma samples in concentration ranges of 5–2500 ng/mL for itraconazole and 50–2500 ng/mL for hydroxyitraconazole. Blank plasma samples were treated similarly to the spiked samples. Calibration graphs were constructed from the peak–height ratios of itraconazole and hydroxyitraconazole to the R051012 internal standard from the HPLC chromatograms and the nominal concentrations of itraconazole and hydroxyitraconazole.
Recovery
Recovery following the extraction procedure was determined by comparing the peak height of normal plasma samples containing defined quantities of drug extracted according to the calibration curve procedure with those of non-extracted control samples. Control samples were prepared by mixing solutions containing the same amount of compound that was added to the plasma blank; however, this compound was obtained by evaporating to dry directly, rather than by extraction.
Assay validation
Interday precision and accuracy were determined from the analysis of control samples carried out on five different days, whereas intraday precision and accuracy were determined by analysing spiked controls that were run in random order five times over the course of one day. The precision of the method at each concentration was determined by comparing the coefficient of variation (CV), obtained by calculating the standard deviation (SD) as a percentage of the calculated mean concentration. The accuracy estimated for each spiked control was obtained by comparing the nominal concentration with the assayed concentration. The limits of quantification (LOQ) were determined as the lowest non-zero concentration measured with an intraday CV less than 20% and an accuracy of ±20%. 20 The limit of detection (LOD) was determined as the lowest concentration with a signal-to-noise ratio of 3.
Stability
Concentrations of itraconazole and hydroxyitraconazole in aliquoted quality control plasma samples (500 ng/mL), kept frozen at −20°C, were measured over six months. Concentrations of itraconazole and hydroxyitraconazole in a plasma sample (500 ng/mL) were measured for 48 h at room temperature. Concentrations of itraconazole and hydroxyitraconazole in control plasma samples were determined with five samples.
Study protocols
The study protocol was approved by the Ethics Committee of Akita University School of Medicine, and all participants gave their informed written consent before participating. Hematopoietic stem cell transplant patients were used for this study. These patients had identical drug administration regimens, which involved cyclosporine, rabeprazole and sulphamethoxazole-trimethoprim. After intravenous itraconazole of 200 mg twice daily (10:00 and 22:00) (ITRIZOLE 200 mg Injection 1%®, Janssen Pharmaceutical KK) for the first two days, the patients received oral itraconazole (ITRIZOLE Oral Solution 1%®, Janssen Pharmaceutical KK) after getting up at 6:00 on the third day. In succession for eight days, venous blood samples were drawn to determine the plasma concentration of itraconazole and hydroxyitraconazole. The samples were taken one and four hours after itraconazole intake every day.
For the full pharmacokinetic analysis of itraconazole, six healthy Japanese male subjects who did not take any medication participated in this study. All subjects received an oral dose of 200 mg/day of itraconazole (ITRIZOLE Capsules 50®, Janssen Pharmaceutical KK) at 8:00 for 10 d. All subjects fasted for 10 h before the administration of itraconazole and had a standard meal four hours later. None of the subjects received drug or food that affected CYP3A function. Beverages containing alcohol and caffeine were forbidden during the test period. After 10 d of itraconazole intake,
21
venous blood samples (200 μL) for the determination of the steady-state plasma concentration of itraconazole and hydroxyitraconazole were collected prior to the intake of itraconazole and 0.5, 1, 1.5, 2, 3, 4, 6, 8, 12 and 24 h after. Plasma was isolated by centrifugation at 1900
Pharmacokinetic analysis
Pharmacokinetic analysis of itraconazole and hydroxyitraconazole was carried out by a standard non-compartmental method using WinNonlin (version 4.0.1; Pharsight Co, Mountain View, CA, USA). The elimination half-life was obtained by log-linear regression of the terminal phase of the concentration–time data for the least points (elimination half-life = ln 2/ke; ke = elimination rate constant). The total area under the observed plasma concentration–time curve (area under the curve [AUC]) was calculated using the linear trapezoidal rule. The maximum plasma level (C max) and time required to reach the peak (t max) were directly obtained from the profile.
Results
Chromatograms
Typical chromatograms obtained for blank plasma and for plasma samples spiked with itraconazole and hydroxyitraconazole are shown in Figure 2. The separation of itraconazole and hydroxyitraconazole was satisfactory and free of interfering peaks in the biological matrix. The peaks of itraconazole and hydroxyitraconazole were clearly separated using a mobile phase of 0.5% KH2PO4 (pH 6.0)-acetonitrile (30:70, v/v) on a CAPCELL PAK C18 MGII column at a flow rate of 0.5 mL/min.
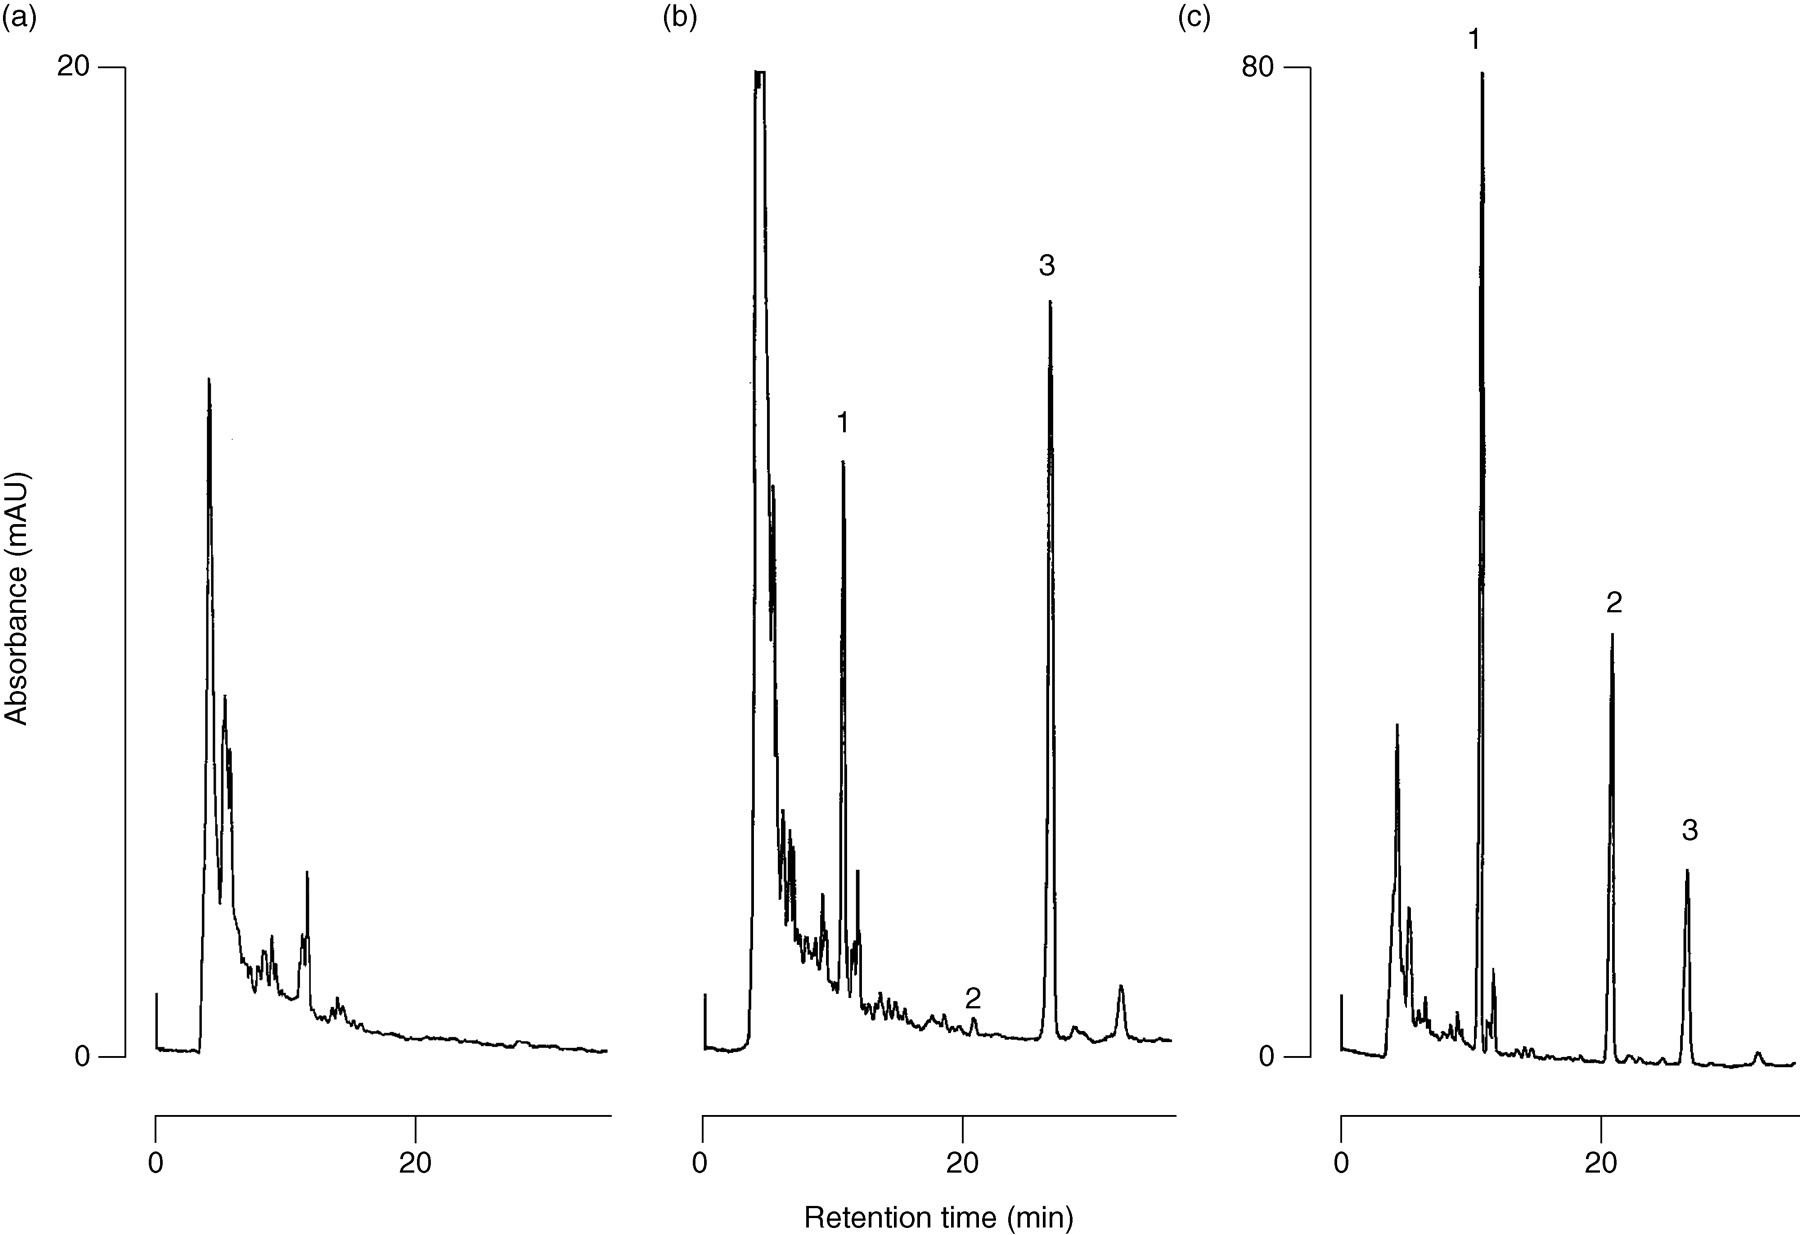
Typical chromatograms of (a) plasma blank, (b) 200 μL plasma spiked with itraconazole (1 ng), hydroxyitraconazole (10 ng) and R051012 (50 ng), and (c) 200 μL plasma spiked with itraconazole (100 ng), hydroxyitraconazole (100 ng) and R051012 (50 ng). Peaks:
Calibration curve
Calibration curves in plasma were linear over a concentration range of 5–2500 ng/mL for itraconazole and 50–2500 ng/mL for hydroxyitraconazole. Typical calibration curves (obtained using the least-squares method) could be expressed as Y = 0.0045X − 0.0038 (r 2 = 0.9991) for itraconazole and Y = 0.0132X + 0.0738 (r 2 = 0.9999) for hydroxyitraconazole, where Y is the peak height ratio and X is the concentration in ng/mL.
Recovery
The results of recovery studies from human plasma are shown in Table 1, with the recoveries of itraconazole and hydroxyitraconazole determined by adding known concentrations of itraconazole (5, 50, 250, 500 and 2500 ng/mL) and hydroxyitraconazole (50, 250, 500, 1250 and 2500 ng/mL) to drug-free plasma. The extraction recovery values for itraconazole and hydroxyitraconazole were 87–92% and 91–94%, respectively (Table 1).
Accuracy and precision of HPLC assay for the determination of itraconazole and hydroxyitraconazole in human plasma (n = 5)
HPLC, high-performance liquid chromatography; CV, coefficient of variation; SD, standard deviation
Precision, accuracy and sensitivity
The CV and accuracy for intra- and interday assays were determined at concentrations of 5–2500 ng/mL for itraconazole and 50–2500 ng/mL for hydroxyitraconazole. CVs for intra- and interday assays were less than 11.3% for itraconazole and 12.2% for hydroxyitraconazole (Table 1). Accuracies for intra- and interday assays were within 11.7% for itraconazole and 4.5% for hydroxyitraconazole (Table 1). The LOQ and LOD values for itraconazole were 5 and 2.5 ng/mL, respectively. The LOQ and LOD values for hydroxyitraconazole were 5 and 2.5 ng/mL, respectively.
Stability
The stability of plasma samples left at room temperature was ascertained up to 48 h. The variations of the levels of itraconazole and hydroxyitraconazole were less than ±5% (−1.2% and −0.4%, respectively), indicating that at room temperature, the plasma samples are stable for at least 48 h. No evidence of decomposition of itraconazole or hydroxyitraconazole was found during plasma samples' storage in the freezer at −20°C for at least six months. Plasma concentrations of itraconazole and hydroxyitraconazole after six months of storage at −20°C were 98.8% and 99.6%, respectively, of the starting concentrations. This indicates that patient plasma samples can be confidently stored at −20°C for a long period of time prior to HPLC analysis. In addition, itraconazole, hydroxyitraconazole and R051012 in extracts from plasma samples reconstituted in a mixture of methanol and mobile phase (50:50, v/v) were stable at room temperature for 24 h.
Application
A typical chromatogram of a plasma sample collected from a patient one hour after administration of 200 mg oral dose of itraconazole in steady state is shown in Figure 3. The peaks corresponding to itraconazole and hydroxyitraconazole were separated, and no interfering peaks were detected in the vicinity of either analyte (Figure 3). Potential interference from co-administered drugs (cyclosporine, tacrolimus, lansoprazole, rabeprazole, omeprazole, prednisolone, sulphamethoxazole and trimethoprim) was tested by determining their retention times in this chromatographic system. There was no chromatographic interference of these drugs in relation to retention times similar to the peaks of itraconazole, hydroxyitraconazole and R051012. Our results indicate that this method is applicable to the monitoring of plasma levels of itraconazole and hydroxyitraconazole in a clinical setting when administered at 200 mg/day.
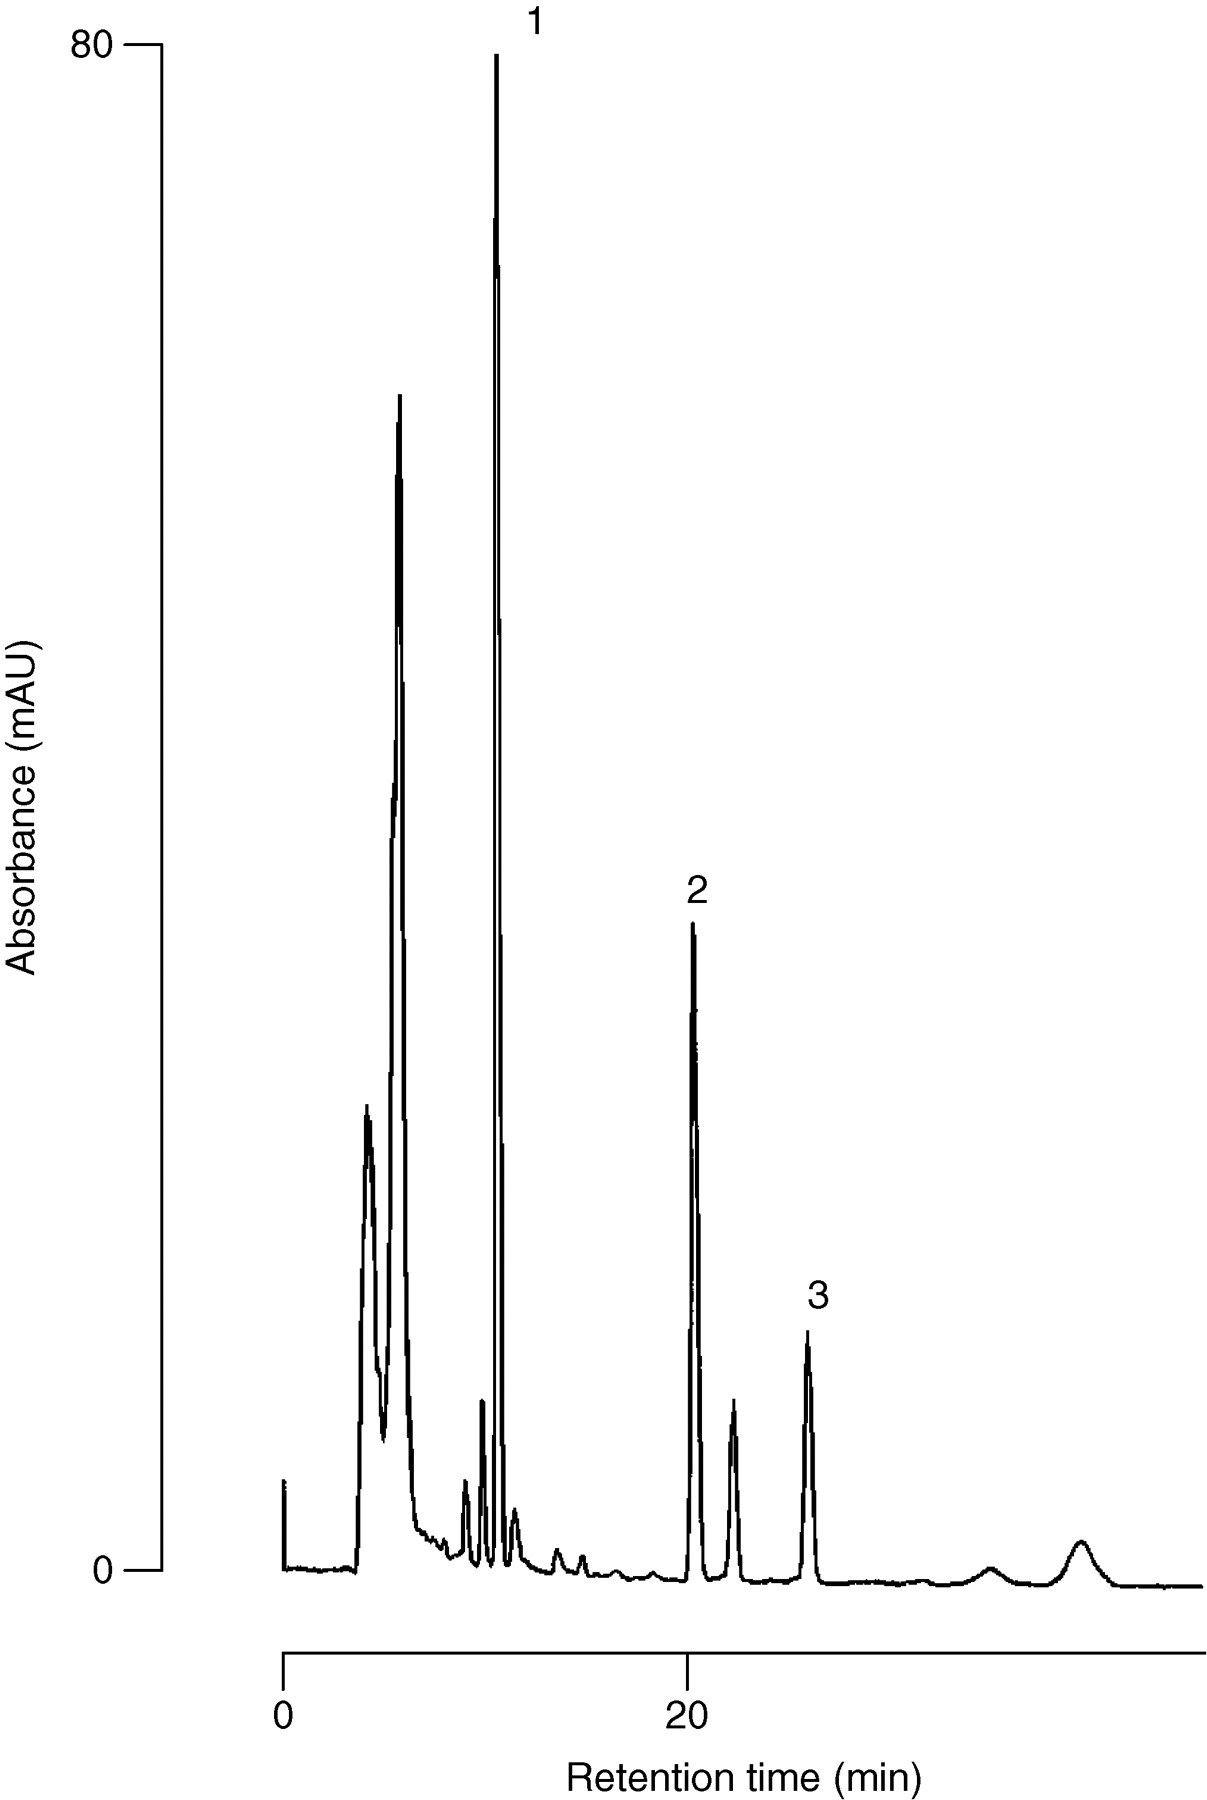
Typical chromatograms of a plasma sample one hour after oral administration of 200 mg itraconazole. The calculated concentration is 578 ng/mL for itraconazole and 443 ng/mL for hydroxyitraconazole. Peaks:
Pharmacokinetics of itraconazole and hydroxyitraconazole
Time courses of the mean steady-state plasma concentrations of itraconazole and hydroxyitraconazole in six healthy subjects receiving 200 mg itraconazole capsules for 10 days are shown in Figure 4, and the pharmacokinetic parameters for itraconazole and hydroxyitraconazole are given in Table 2. The plasma concentrations of hydroxyitraconazole at all time points were higher than those of itraconazole (Figure 4, Table 2). The mean C max for itraconazole and hydroxyitraconazole in the 200 mg capsules dose were 653 and 1059 ng/mL, respectively. The elimination half-life (t 1/2) values for itraconazole and hydroxyitraconazole were 14 and 24 h, respectively; the mean AUC0−24 values were 7908 and 15,795 ng h/mL, for itraconazole and hydroxyitraconazole, respectively.
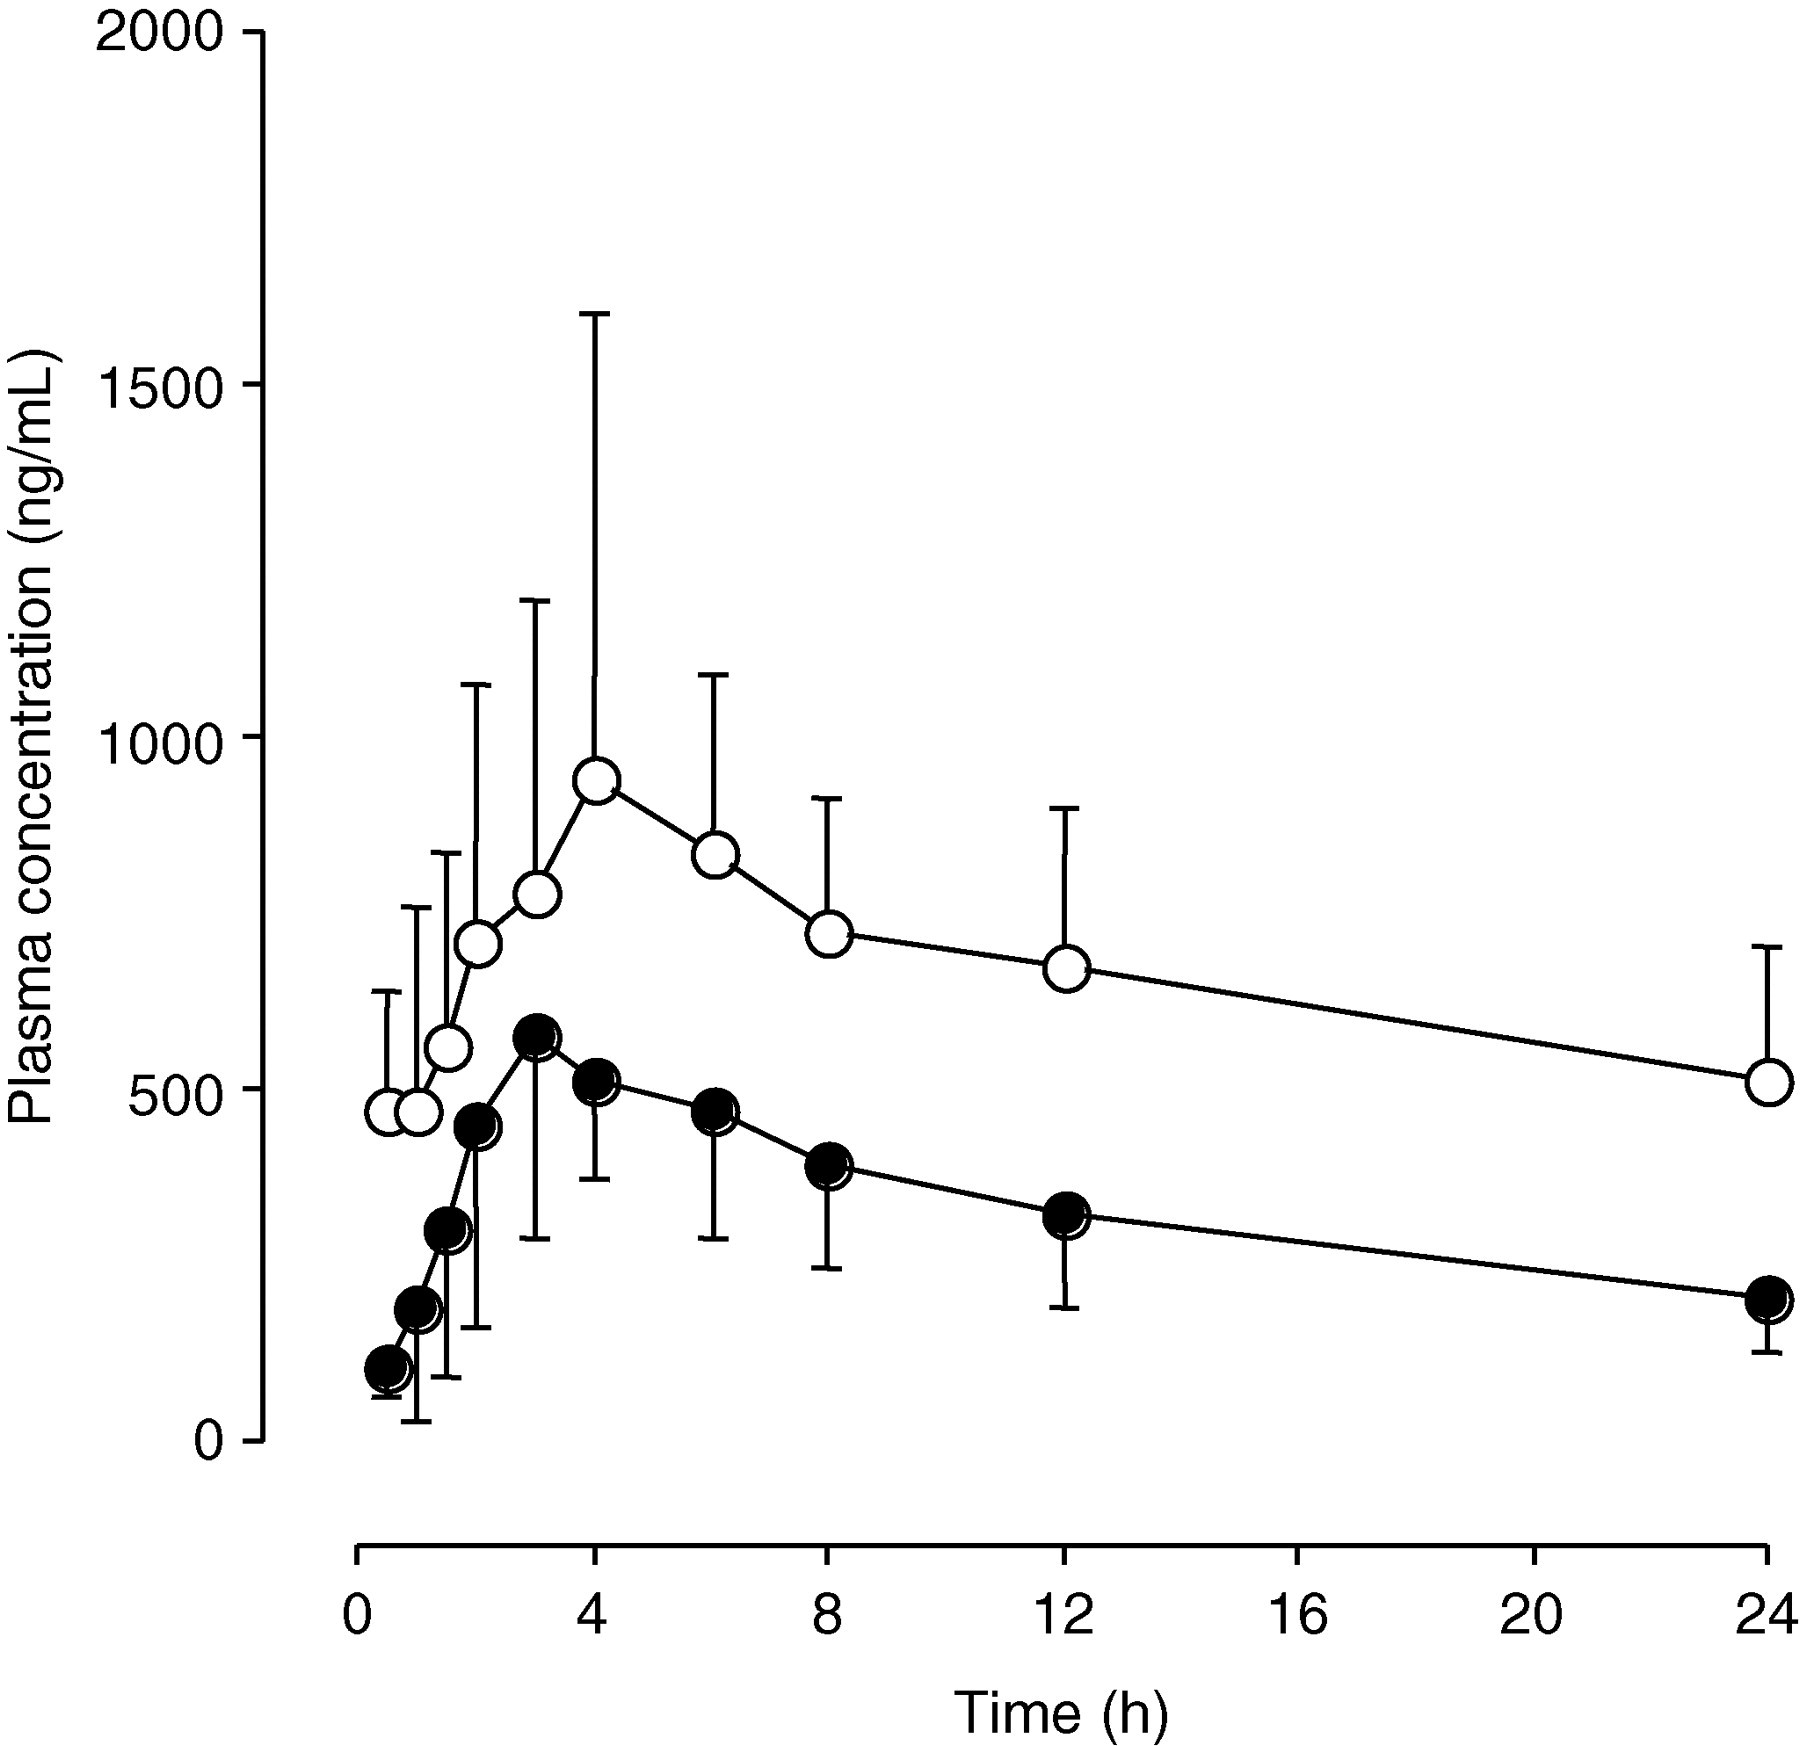
Plasma concentration–time profiles of itraconazole (solid circles) and hydroxyitraconazole (open circles) in six healthy subjects who received 200 mg itraconazole capsules
Pharmacokinetic parameters of itraconazole and hydroxyitraconazole
The values are shown as the mean ± SD
C max, maximum plasma concentration; C 0, trough plasma concentration; T max, time to reachC max; AUC0–24, area under the plasma concentration–time curve from 0 to 24 h
Time plots of the mean plasma concentrations of itraconazole and hydroxyitraconazole in three patients are shown in Figure 5. Each patient received a loading dose of 400 mg/day itraconazole intravenously for two days followed by treatment with 200 mg oral solution once daily. Compared with taking only itraconazole capsules consecutively, the plasma concentrations due to the use of intravenous loading dose were extremely high (Figure 5); the plasma concentrations of itraconazole were above 500 ng/mL and the concentration was maintained throughout the oral phase.
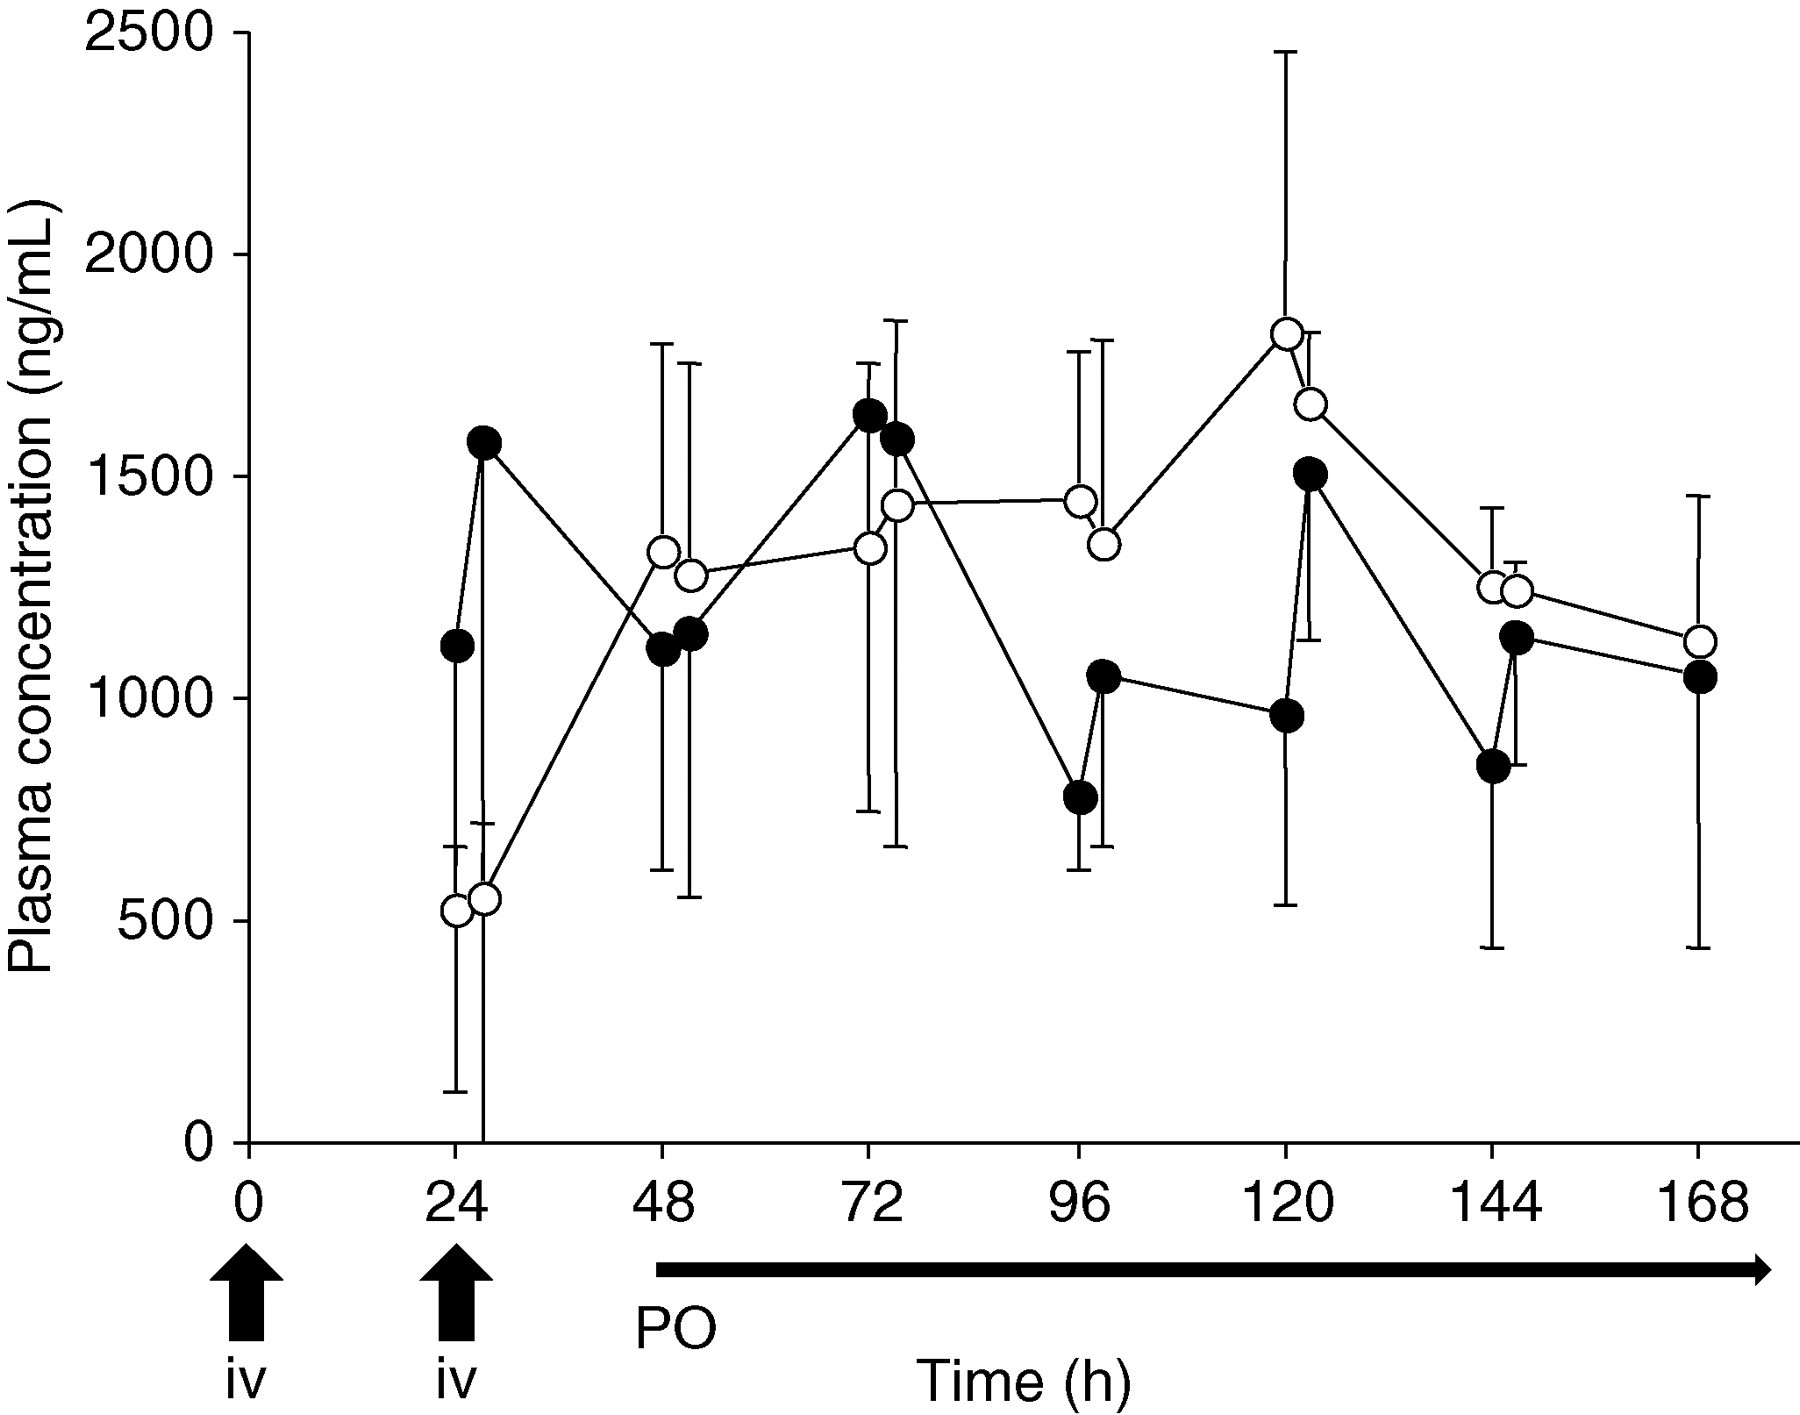
Plasma concentration–time profiles of itraconazole (solid circles) and hydroxyitraconazole (open circles) in three hematopoietic stem cell transplant patients who received a tw|o-day administration of 400 mg/day intravenous itraconazole followed by administration of 200 mg/day itraconazole oral solution
Discussion
In the present study, we described a sensitive and specific HPLC-UV method for the simultaneous determination of concentrations of itraconazole and hydroxyitraconazole in human plasma. The separation of itraconazole, hydroxyitraconazole and the internal standard R051012 was satisfactory; it was free of interfering peaks in the biological matrix using our extraction method and chromatographic system. The LOQ value for both itraconazole and hydroxyitraconazole was 5 ng/mL. The precision and accuracy of this HPLC assay is suitable for both routine therapeutic drug monitoring applications and clinical pharmacokinetic studies.
Until now, many studies concerned with only sensitivity have calculated the calibration curve with low concentrations of itraconazole and hydroxyitraconazole. Previous studies have generally calculated the calibration curve with itraconazole concentrations less than 1000 ng/mL and aimed for precision and accuracy. 11–13,16–18 For monitoring patients taking 200 mg itraconazole capsules, these methods may possibly be adapted to assay itraconazole plasma concentration. However, in the clinic, continuous infusion of itraconazole is often used followed by oral itraconazole. A steady-state concentration in plasma of 500 ng/mL is considered a desirable target for itraconazole. 7,8 The intravenous itraconazole regimen is suitable for rapid achievement of a target mean steady-state trough plasma concentration in the region of 500 ng/mL. 7,8 In our study, the steady-state plasma concentrations of itraconazole and hydroxyitraconazole ranged from 506 to 2482 ng/mL and from 766 to 2444 ng/mL, respectively, after administration of 400 mg/day intravenous itraconazole for two days followed by administration of 200 mg/day itraconazole oral solution. Therefore, preparation of the calibration curve with concentrations of itraconazole and hydroxyitraconazole to 2500 ng/mL was necessary.
Assays that require small sample volumes are useful for routine drug monitoring of patients. Previously published extraction procedures developed for the analysis of itraconazole in human plasma have been based on multi-step liquid–liquid extraction, which requires plasma volumes of at least 1 mL. 16,17 In contrast, the solid-phase extraction procedure described here was simple and quick compared with other methods; it needed only a small amount of plasma (200 μL) for one complete analysis while providing good selectivity and high extraction recovery (>87% for two compounds). Our method requires only one hour between the sampling of blood to the calculation of itraconazole plasma concentration. In clinical situations, convenience is often given priority over precision, but in the present method we achieve both precision and convenience.
The once-daily oral itraconazole capsule regimen fails to maintain trough plasma itraconazole concentrations above 500 ng/mL. In the present study, the steady-state mean itraconazole trough concentration in the multiple doses of 200 mg capsules was 112 ng/mL. However, a regimen consisting of two days of itraconazole intravenous treatment (200 mg twice daily) followed by 200 mg itraconazole oral solution once daily seems to maintain itraconazole trough concentration above 500 ng/mL. The therapeutic target is achieved through the use of a loading dose (200 mg/12 h for the first two days) of itraconazole. In addition, the oral solution of itraconazole has 30–33% greater bioavailability than the capsule formulation. 9,10 The combination regimen of these two formulations of itraconazole might be effective in preventing infection. Maximum plasma concentration of itraconazole has been reported at 4–5 h after administration of itraconazole oral solution. 22 The plasma concentration of itraconazole at one hour after intake is slightly higher than its trough concentration. 23 In our study on three patients, itraconazole trough concentrations of 500 ng/mL were reached during one week of therapy. In addition, plasma concentrations of hydroxyitraconazole, the active metabolite, were maintained above 1000 ng/mL. However, our results might be interpreted within the context of the study limitations. Hematopoietic stem cell transplant patients who received a loading dose of itraconazole intravenously for two days followed by treatment with 200 mg oral solution had identical drug administration regimens that involved cyclosporine, rabeprazole and sulphamethoxazole-trimethoprim. Pharmacokinetic interaction occurs between cyclosporine and itraconazole because itraconazole inhibits both CYP3A4 and P-glycoprotein activity. 23,24 However, the influence of cyclosporine on itraconazole pharmacokinetics has not been reported. Therefore, it is thought that there is little influence of concomitant drugs in our results. However, further studies using large sample sizes are necessary.
Conclusions
The HPLC-UV method with solid-phase extraction reported here is simple, highly sensitive and rapid. The precision and accuracy of the HPLC assay is suitable for pharmacokinetic studies of itraconazole and hydroxyitraconazole. This method is currently being used for therapeutic drug monitoring of itraconazole and hydroxyitraconazole.
DECLARATIONS