
Abstract
Background
In a network of laboratories analytical variability between instruments, even of the same type, may exist for reasons beyond the control of laboratory staff. Controlling variability is a prerequisite for the application of shared reference ranges and for ensuring the transferability of patient test results. Controlling variability requires a robust, non-conventional quality system to detect poor performance of analysers that are geographically distant. Essential to this quality system is a set of well-defined quality specifications.
Methods
The approach used in our study started with (1) selection of a model for quality specifications based on biological variation; the ‘three-level model’ (TLM) was selected on the basis of its flexibility to accommodate various levels of analytical performance; (2) determination of the performance characteristics of the 71 analytes measured in core biochemistry in terms of imprecision and bias; (3) defining quality requirements in the form of imprecision, bias and total error for 71 analytes measured routinely in core biochemistry; and (4) developing software to assist a consistent wide application of the quality specifications and to monitor analytical indices to the common quality specifications.
Results
In this paper we describe how we have implemented this model across our network. Forty-six of the 71 analytes in our core laboratory repertoire were allocated to the TLM. We were able to demonstrate equivalence of results on all analysers, for 42 out of 46 analytes allocated to this model.
Conclusions
We propose that other networked laboratories should investigate the suitability of this quality system for use in their network.
Introduction
An important point in improving laboratory analytical quality is the definition of performance indicators which can be monitored as measures of laboratory analytical performance. In this era of evidence-based medicine, where laboratory tests are important for evidence-based clinical decision-making, the quality specifications of biochemical tests also need to be based on the best scientific evidence. The necessity for quality specifications based on both clinical requirement and biological variation has been reviewed. 1,2
The review of National Health Service (NHS) pathology services in England by Lord Carter proposed that managed networks should be the optimal model for delivering pathology services. 3,4 It is now almost a decade since the appearance of the first managed networks in laboratory medicine in the UK. In addition to consolidating financial resources, networks aim to improve patient clinical care by facilitating patient transfer between primary care and different hospitals within the network.
One of the clinical imperatives in a laboratory network is to generate test results that are comparable between the participating laboratories (transferability of test results). One of the basic requirements for achieving transferability is a comprehensive set of common reference intervals, but this is only applicable if the analytical variability within all components of the laboratory network is closely controlled. This has been endorsed by the International Federation of Clinical Chemistry and Laboratory Medicine, 5 and the accreditation criteria established by Clinical Pathology Accreditation (UK) Ltd (CPA) standards demands that a network has to implement a means of measuring variability between laboratories of the same network. 6
In a move to reduce analytical variability (and cost), most of the established networks within the UK have sourced their analytical platforms from a single manufacturer which might have been expected to reduce analytical variability within the network. However, this has not always been the case. For some time, the external quality assurance (EQA) data for our networked laboratories has shown evidence of lack of comparability of quality indicators. The analytical variability within a network is believed to be related to several factors, such as (1) variable deterioration in hardware due to differential workloads across the network; (2) the use of different operating protocols and suboptimal coordination of reagent batches; and (3) the presence of inherent differences in the components and build of each instrument.
For all the aforementioned reasons, it is apparent that there is a need for a quality system that is designed to support the change in service delivery from small independent laboratories to larger networks in order to meet the demand of managing analytical performance to support optimal clinical care. In this paper, we suggest the use of a science-based quality system. This system is based on two components: (1) evidence-based analytical quality specifications and (2) a tool to enable a consistent and network-wide application of the quality specifications and permit the sharing and exchanging of performance indices between networked laboratories to assist in the detection and control of variability. We also describe how we have implemented the chosen model in our own network and show data for seven analytes as examples for setting quality specifications based on models incorporating biological variation, pharmacokinetics and expert opinion.
Description of network
Our laboratory network serves three teaching hospitals and associated district general hospitals across two NHS trusts serving a population of 1.3 million. Each laboratory acts as a receiving area for other hospitals in the network and for external samples (primary care, other hospitals). Analytical work is performed on each site. Britannia House is an offsite laboratory providing only specialist non-urgent work centralized on that site. All other sites, e.g. Leeds General Infirmary (LGI), St James' University Hospital (SJUH), Wharfedale General Hospital (WGH) and Bradford Royal Infirmary (BRI), provide core services and distributed specialist services. The test repertoire for core biochemistry laboratories includes general blood and urine chemistries, endocrinology, therapeutic drug monitoring, tumour markers and cardiac troponin (cTnI): a total of 71 analytes, although not all are measured on all sites. There are 16 analysers in core biochemistry: nine general chemistry, Advia 1200, 1800 and 2400, and seven immunoassay analysers, all Centaur XP. All analysers are from a single manufacturer procured at a single tender action (Siemens Healthcare Solutions, Camberley, UK) and use identical assay methods. All 71 analyte reagents and calibrators were also from Siemens, with the exception of creatinine, salicylate and lithium, which were from Audit Diagnostics, Carrigtwohill, Co., Cork, Ireland; Stanbio Laboratory, TX, USA; and Thermo Scientific, West Sussex, UK, respectively. Internal quality control (IQC) materials were from Bio-Rad Laboratories Ltd, Hemel Hempstead, UK.
The quality specification model
The first step in the design of any quality system is to define the limits within which the analytical performance is deemed acceptable. Ideally, the performance characteristics should be compared objectively to well-documented analytical specifications and all analytical components of the network should be assessed using the same set of standards and quality specifications.
Numerous quality requirements have been defined over the last three decades in order to establish quality specifications. In 1999 an international conference in Stockholm, ‘Strategies to set global analytical quality specifications in laboratory medicine’, led to a consensus agreement defining a hierarchy of models. Where available, and when appropriate for intended use, models higher in the hierarchy are preferred to those at the lower levels. 1 The two highest models describe firstly a clinical requirement-based specification and secondly analytical specifications based on biological variation. The second model in the hierarchy is the most widely accepted candidate due to its practicality and potential wide applicability. 7 Furthermore, a biological variation database is available for around 316 tests. 8 These data which are available on the Westgard website 9 are regularly updated and can be used to calculate the analytical goal for imprecision and bias and total error.
From a number of models for biological variation-based quality specifications, the three-level model (TLM), as described by Fraser, was selected to derive our network quality specifications.
7
This model defines three levels of acceptable analytical performance:
Optimal performance: analytical imprecision <0.25 CVI and bias <0.125(CVI
2 + CVw
2)1/2
Desirable performance: analytical imprecision <0.5 CVI and bias <0.25(CVI
2 + CVw
2)1/2
Minimum performance: analytical imprecision <0.75 CVI and bias <0.375(CVI
2 + CVw
2)1/2
The biological variation-based total allowable error (TEallowable) is derived from the performance requirements of the TLM above. The equation is: TEallowable = 1.65(k CVI
2) + k′(CVI
2 + CVw
2)1/2, where k values are 0.25, 0.5 and 0.75, and k′ values are 0.125, 0.25 and 0.375 for optimal, desirable and maximal levels, respectively. CVI and CVw are intra- and interindividual variation, respectively.
The three levels of performance, optimal, minimal and maximal, in this model form a scale that allows the acceptable quality goal to become more stringent with time and with improvement in technology. Allocation of a test to one level of the model should not be permanent; in fact, this should be considered a dynamic exercise, and the allocation should change with improvement of analytical performance. Furthermore, the TLM has important advantages over all other biological variation-based models such as being operational, and providing stable quality specifications over time and geography.
Since therapeutic drugs do not have biological variation, the TLM is not applicable and the quality specifications requirements were derived using the following equation: CVA < 1/4 [(2 T/t − 1)/(2 T/t + 1) × 100, where T is the time interval between doses and t is the half-life of the drug. 10
Implementation process
Operational standardization
For any cross-site quality system there needs to be a commonality of operational procedures. To make this possible, it was essential to establish a team to lead the standardization process. A project team was established to bring together the technical and scientific expertise and support necessary to evaluate and implement the change. The team consisted of senior technical staff to represent all sites, the clinical lead for core biochemistry and a clinical scientist. The team met on a regular basis and this was the mechanism for defining the quality specifications, collecting the data and reviewing performance characteristics of control procedures.
Standardization of operating protocols began with mapping the similarities and differences in the existing operating protocols across sites. The standardization processes included the analyser and laboratory logistics operating procedures, EQA procedures and IQC procedures, including frequency of IQC analysis throughout daily operation. Liaison with the manufacturer was a vital requirement for setting up a procedure to obtain the same lot of reagent for all sites and coordinate reagent lot changes. Similarly, a single batch of IQC was used across the whole network and common procedures used for the derivation of running means.
All the laboratories in the network joined the same EQA service provider for the same group of analytes and each individual analyser in the network participated in the EQA scheme.
Quality specifications derivation
The process of the selection of a test quality specification required the following:
The analytical imprecision (CVA) data for the 16 analysers in the networked laboratories were collected. Imprecision of 30 general chemistry, 12 urine chemistry, nine therapeutic drug monitoring and 20 immunoassay analytes had previously been monitored by analysing two levels of commercial quality control (QC) material daily and were available for the previous six-month period; The bias data for the 16 analysers in the network were collected from EQA returns data over the previous year. For all analytes the mean bias (B
M) was calculated to the method group mean. (B
M = (result–method group mean)/method group mean × 100); The analytical total error (TEanalytical) for each analyte is calculated as B
M plus Z times the analytical imprecision. The equation is: TEanalytical = B
M + Z × CVA. In the clinical laboratories the Z multiplier is typically chosen at the 95% probability level, being 1.65. CVA is analytical CV and B
M is the bias to the mean of our method group users in the UK National External Quality Assurance Scheme (NEQAS); The intra- and interindividual (CVI and CVw, respectively) biological variation data have been collected;
8
Calculation of the biological CVallowable, Biasallowable (B
allowable) and TEallowable for all the analytes (except the TDM analytes) at the three levels as defined by Fraser (optimal, desirable and maximal);
11
The mean analytical BM and CVA were compared with the B
allowable and CVallowable across the TLM. This step assisted the initial decision-making about the possibility of applying the biological variation-based quality specification for an analyte; The pharmacokinetics-based quality specifications for therapeutic drugs were obtained from a reliable source for six out of nine therapeutic drug-monitoring analytes.
10
The quality specifications for the remaining three analytes (paracetamol, salicylate and phenytoin) were calculated as described by Fraser CG
10
(see the Appendix; phenytoin example).
The effect of observed method imprecision and the imprecision of TLM on the dispersion at the clinical decision limit were studied for the analytes allocated to the TLM model. The level of performance in terms of TE, B and CV (judgement criteria) that can deliver the clinical requirement was selected on the basis of this process.
Software development
A robust tool was needed to provide a consistent application of the quality specifications and to monitor and compare analytical indices to the common quality specifications. Since software that is capable of performing across site quality comparisons was not commercially available, we developed our own. The software makes use of three different data streams to provide us with the information we require:
EQA: the calculation of analytical total error necessitates the availability of bias data electronically. Following collaborative work with a number of UK NEQAS scheme organizers, agreement was reached for them to deliver our EQA returns data electronically in a pre-agreed format compatible with our database. These data are uploaded electronically into the database whenever available.
IQC: IQC data are captured on a regular basis from all the analysers in the core biochemistry laboratories. These data are then automatically imported into a file on the pathology network's information system and uploaded electronically into the database.
The derived quality specifications: these were calculated as shown above and electronically fed into the database.
The capacity of this database is sufficient to store 10 y of IQC and EQA data. From the above data streams the software automatically performs the following actions:
From the IQC data the CVA is calculated and evaluated against the allocated specifications for CVallowable. The CVA will be highlighted if its value exceeds the target value for the analyte. From EQA data the B
M data for each analyte are calculated and evaluated against the selected bias values derived from the TLM. The B
M will be highlighted if it exceeds the target value for the analyte. The TEanalytical is calculated for every analyte, using CVA and B
M, and is then evaluated against the TEallowable derived from the TLM. TEanalytical will be highlighted if it exceeds the allowable limits.
The software presents these data in both tabular (Figure 1) and graphical formats (Figures 2a–c). IQC tables give a cumulative summary of the calculation of the monthly mean, SD, number of outliers and the reagent lot number for every test/analyser in the core biochemistry laboratories. It also gives access to the IQC raw data tabulated in an Excel™ spreadsheet. These raw data may be needed for further statistical analysis to help in the troubleshooting of poor performance. Navigation tools provide easy access to all results stored in the database and allow performance to be monitored over time. IQC data are retrievable by individual test, analyser, date or control lot number (Figure 1).
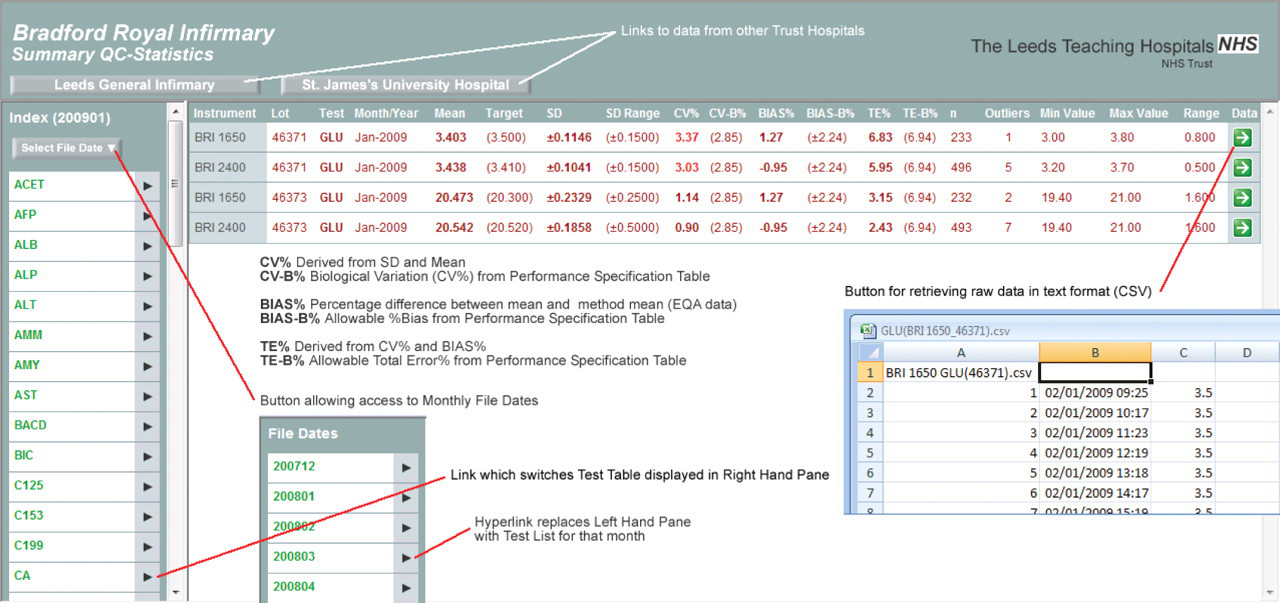
The data table screen. This is hyperlinked to the top page. Data are retrievable by site, analyser, and date and IQC lot number. Analytical CV, bias and TE are compared with the biological variation-driven CV, bias and TE. This table is hyperlinked to the raw data tables. IQC, internal quality control; TE, total error; EQA, external quality assurance; CV, coefficient of variation
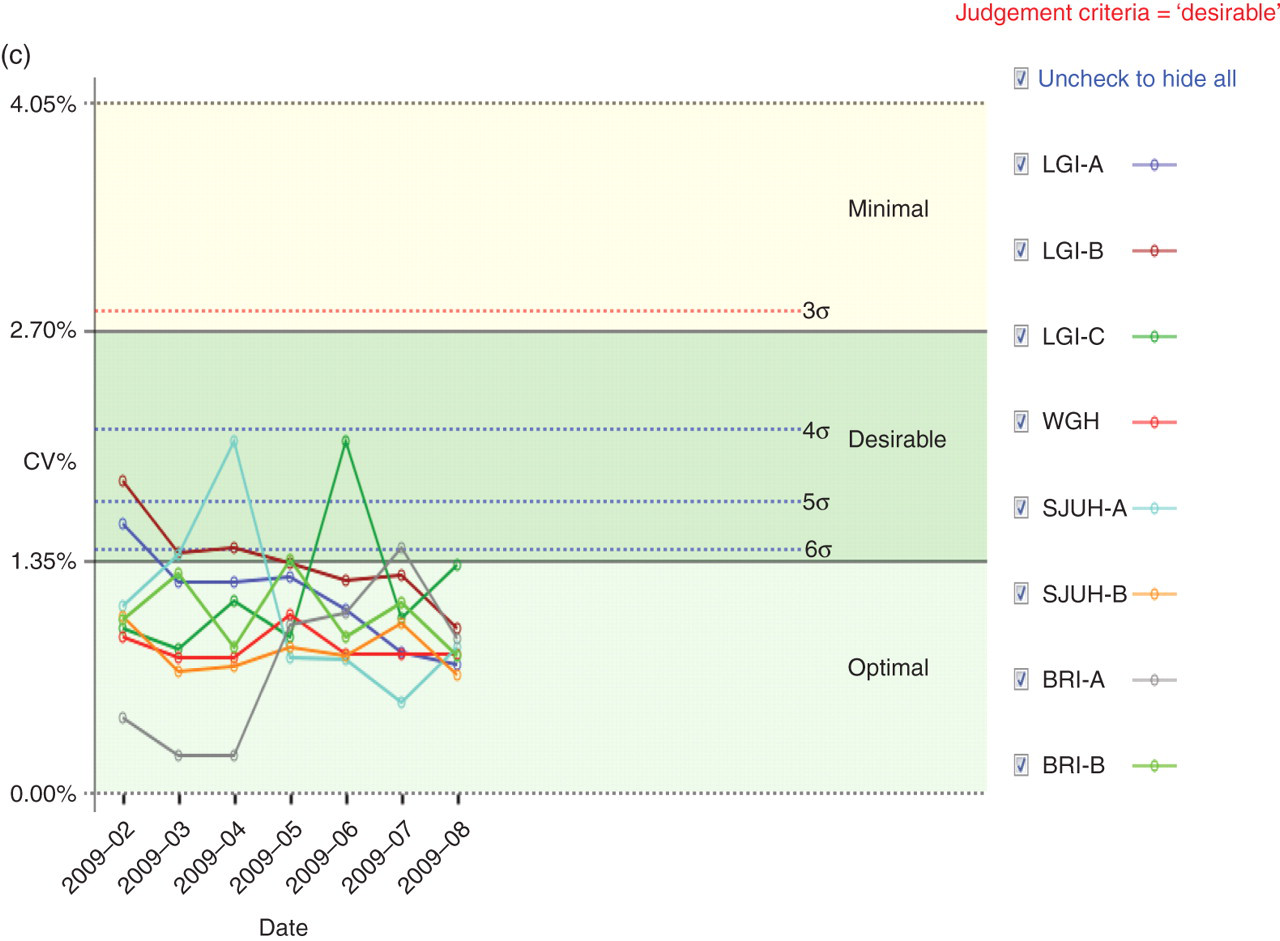
(a) An example Levey–Jennings graph as generated by the quality improvement software. The example shows the glucose IQC monthly mean measured on eight analysers over an eight-month period. The IQC target mean is 3.5 mmol/L. The analytical goal was determined as the desirable level. The biological CV for glucose at the desirable level is 2.9%. SD for this graph was derived as following: SD = (mean × CV%)/100. Each point on the graph represents the mean of 200–400 results per month. The shaded areas represent 1 SD, 2 SD and 3 SD. Although the mean for glucose varies between instruments, this is considered not clinically significant because they all lie within the desirable limit of performance. (b) Network bias graph. This example shows TnI bias over time as presented by the software. The shaded areas in this graph represent the optimal, desirable and minimal performance levels. The graph shows at a glance performance across all instruments in the network. It also shows the improvement in performance post new quality system introduction. (c) Network imprecision graph. This example shows cholesterol imprecision over time as presented by the software. The shaded areas in the graph represent the optimal, desirable and minimal performance levels. The broken lines represent different levels of sigma. The red broken line represents the CVanalytical that ensures analytical process consistent with 3σ. The limit for the imprecision recommended by NCEP was selected as the judgement criteria for this analyte. The NCEP imprecision limit is almost the same as the desirable limit derived from the TLM. This graph shows at a glance that the performance across all instruments in the network is within the clinically acceptable limits with the CV% variation being narrowed over time. IQC, internal quality control; BRA, Bradford Royal Infirmary; SJUH, St James' University Hospital; LGI, Leeds General Infirmary; WGH, Wharfedale General Hospital; TnI, troponin; NCEP, National Cholesterol Education Panel; TLM, three-level model; CV, coefficient of variation
The IQC data are also presented in modified Levey–Jennings plots. This is used to show the monthly mean of each test/analyser and to give the cumulative monthly mean within a time window. The software compares the IQC performance for every test over all sites against the allowable performance and presents this graphically with SD limits derived from CVallowable (Figure 2a).
The software was designed to generate one summary report on a monthly basis. This gives a list of tests that have exceeded the permitted limit for TE and hyperlink buttons enable the generation of a data table or graphic display for the affected tests to give access to the IQC and EQA data to help identify the source of error.
Assessment of results
Transferability between laboratories/analysers was considered to have been achieved if the performance of an analyte for all the laboratories and analysers in the network met the biologically derived quality specifications; An analyte was considered to have met the biological variation-based specification if at least two analysers within the networks complied with the derived specifications; An analyte was considered to be failing the biological variation specifications if none of the analysers across the network complied with the allowable performance.
Transferability
Our data showed that our analysers could meet the quality specifications which have been derived from the TLM for 46 out of 54 analytes that were initially allocated to the TLM model. Eight analytes failed to meet the biological variation-derived quality specifications. Four of these, sodium, calcium, chloride and magnesium, exhibit a narrow CVI so that it may not be possible for quality specifications to be achieved by the current technology. Four analytes (free T4, albumin, Ca15.3 and oestradiol) had a performance (bias and imprecision) that did not meet the biological variation specifications.
Five tests (prolactin [PRL], progesterone, human chorionic gonadotrophin, bicarbonate and ammonia) lack biological variation data, so that quality specifications cannot be calculated using the TLM system. For all these tests and those that failed the TLM, the performance was assessed against quality targets based on a model lower in the hierarchy, e.g. views of expert or EQA specifications (see the Appendix for PRL as an example for this group).
Transferability between laboratories was achieved for 42/46 analytes that were allocated to TLM-derived specification. These were the 30 analytes presented in Table 1 plus 12 urine biochemistry analytes. Seven out of nine analytes that were allocated to the pharmacokinetics model achieved transferability between sites. These were paracetamol, salicylate, phenytoin, phenobarbiton, theophyline, valporate and carbamazepine.
Imprecision for 30 analytes obtained by our laboratories evaluated against the target imprecision derived from the objective criteria based on biological variation
The number of QC data points for each analyte ranged from 600 to 1200 for general chemistry analytes and from 90 to 140 for immunoassay analytes. Only low IQC data are presented. The numbers in bold represent the current level of performance. Asterisks indicate assays temporarily out of control. Data for therapeutic drugs and urine chemistry are not presented here due to space limitations
BRI, Bradford Royal Infirmary; SJUH, St James' University Hospital; LGI, Leeds General Infirmary; WGH, Wharfedale General Hospital; LH, luteinizing hormone; FSH, follicle-stimulating hormone; TSH, thyroid-stimulating hormone; PSA, prostate-specific antigen; TnI, troponin; AFP, alpha-fetoprotein; CV, coefficient of variation
Quality specifications
With regard to the TLM-based specifications, the initial decision about the level of specification required was made for each individual analyte based on its analytical performance with regard to precision (Table 1), and the effect of method imprecision on the dispersion at the clinical decision limit and how the test was used in the clinical setting. The appendix shows examples to describe this process for five tests allocated to the TLM model; these are glucose, cholesterol, prostate specific antigen (PSA), alpha-fetoprotein (AFP) and cTnI.
We studied 71 analytes that were measured routinely in the core biochemistry laboratories in our network. Quality specifications for our network were derived from three models: (1) the biological variation-based model, the TLM (46 analytes); (2) the pharmacokinetic model as described by Fraser (nine therapeutic drugs); and (3) a mixed quality specifications model based on expert opinion and external QC specifications, which included 16 analytes. Three analytes did not fit with any form of specification due to poor performance. Table 2 shows the distribution of the 71 studied analytes across the three types of quality specifications. The allocation of the 46 analytes with biological variation derived TEallowable to each level of the TLM model was as follows:
Summary of our network analytical quality specifications in terms of allowable total error
EQA, external quality assurance; TEallowable, allowable total error; CEA, carcinoembryonic antigen; CV, coefficient of variation
Eight analytes had TEallowable allocated to the optimal level, 18 analytes had TEallowable allocated to the desirable level and six analytes were allocated to a mixed TEallowable. For analytes in the mixed category, the bias and CV goals were selected from different levels in the TLM, for example, CVallowable for TnI was allocated to the minimal (<10%) and B allowable allocated to the optimal. Fourteen analytes had TEallowable allocated to the minimal level. Seven out of 14 were allocated to this level of performance due to unsatisfactory current analytical performance. The other seven were allocated to the minimal level because allocation to the desirable level would not result in an improvement in quality (as shown in the AFP example in the Appendix).
Discussion
The development of computer networking has allowed linked laboratories with multiple analytical systems to feed large amounts of test results into a single database and enabled the generation of a large number of performance indices. To enhance across site analytical results comparability, it is essential that performance indicator data are accessible to all the laboratories in the network and that these do not remain within an individual laboratory.
In our networked laboratories, a robust system has been set up for the management of analytical quality data, which allows samples to be processed in any of our laboratories, on any platform, with the knowledge that results will not be clinically significantly different. The cornerstone of this system was developing quality specifications based on a biological variation model. Although the concept of biological variation-based quality specifications is not new, the translation into everyday laboratory practice in the UK is not widespread.
In agreement with other studies, we have shown in this paper that quality specifications for analytical control, based on biological variation, can be successfully implemented for most general chemistry tests. 12,13 Furthermore, we have demonstrated that transferability between laboratories is achievable if a robust quality system is available and common quality specifications are established. In-house developed software has permitted the application of common quality specifications across laboratories and enables rapid access to data from all sites despite the geographical distance.
In our network, the biological variation model has a wide range of applications. Apart from the development of IQC control limits based on the biological variation model and total error concept which allowed standardization of practice, with similar limits for each analyser in the network, we also used it to derive acceptable limits for performance in EQA. We have used it to set limits for satisfactory analytical performance when a new method or instrument is evaluated, and it has the potential to be used in the tendering process for new equipment.
In the longer term, wider implementation of quality systems based on biological variation rather than analytical variation may discourage the unnecessary clamour for even better analytical performance replacing it with the more clinically relevant performance. Furthermore, it may change the approach by which performance requirements in EQA schemes are set.
Our software was designed to calculate and evaluate the analytical total error. This feature of the software has two advantages. First, the availability of total error data permits derivation of analyte-specific Westgard rules based on the observed analytical performance. Second, the software helps identify which component of TE, i.e. bias or imprecision, requires attention; for example, for those assays with inherent bias, the laboratory may achieve acceptable performance by improving the analytical precision. Finally, one major advantage of this system is that we have been able to reduce the number of EQA reports from about 400 reports each month for all the sites to one report per month.
The default page of the data table in the software is a list of tests that have exceeded the permitted limit for TE, and hyperlink buttons generate a data table or graphic display for the affected test. The software displays three types of graphs for each test. These are (1) the modified Levey–Jennings plot with SD limits derived from the biological variation, which enables the comparison of mean IQC for each analyser on all sites at a glance; (2) the network CV graph with a link to performance in terms of sigma; and (3) the cumulative bias graphs, which allow us to assess the degree of bias between our network analysers (see Figures 2a–c). This significantly reduces the amount of time the reviewer needs to spend validating analytical performance and detecting errors. This software is accessible on all sites and enables laboratory staff from one site to compare performance with the other sites. It also provides easier managerial oversight and a rapid access for information about method performance when needed for clinical validation.
In our system, reports are generated in realtime which reduces requirements for database storage and allows the most recent data to be incorporated as soon as these are available. This system was designed to have the flexibility to upgrade if more strategies based on clinical requirements were developed. Furthermore, it runs automatically and requires no maintenance or intervention.
Although this quality system has been developed for our network the same principles can be applied to any multianalyser laboratory and can provide a remote QC mechanism for point of care testing devices in the community or hospital. It would also allow the manufacturer to have a remote and direct access to laboratories analytical performance data.
DECLARATIONS