
Abstract
Background
The relationship between plasma angiopoietin-like protein 3 (ANGPTL3), and lipoprotein lipase (LPL) activity and hepatic triglyceride lipase (HTGL) activity has not been investigated in the metabolism of remnant lipoproteins (RLPs) and high-density lipoprotein (HDL) in human plasma.
Methods
ANGPTL3, LPL activity, HTGL activity, RLP-C and RLP-TG and small, dense LDL-cholesterol (sd LDL-C) were measured in 20 overweight and obese subjects in the fasting and postprandial states.
Results
Plasma TG, RLP-C, RLP-TG and sd LDL-C were inversely correlated with LPL activity both in the fasting and postprandial states, but not correlated with HTGL activity and ANGPTL3. However, plasma HDL-C was positively correlated with LPL activity both in the fasting and postprandial states, while inversely correlated with HTGL activity. ANGPTL3 was inversely correlated with HTGL activity both in the fasting and postprandial states, but not correlated with LPL activity.
Conclusion
HTGL plays a major role in HDL metabolism, but not RLP metabolism. These findings suggest that ANGPTL3 is strongly associated with the inhibition of HTGL activity and regulates HDL metabolism, but not associated with the inhibition of LPL activity for the metabolism of RLPs in human plasma.
Introduction
The regulation of triglyceride (TG)-rich lipoprotein metabolism by angiopoietin-like protein 3 (ANGPTL3) was first reported by Koishi et al. 1 in KK obese mouse, which is known to have abnormally high levels of plasma insulin (hyperinsulinaemia), glucose (hyperglycaemia) and lipids (hyperlipidaemia). They observed an abnormally low plasma lipid level in one strain (KK/San), which carried the defected hypolipidaemia locus in the middle of chromosome 4 encoded as ANGPTL3 gene. The overexpression of ANGPTL3 or intravenous injection of the purified protein in KK/San mice elicited an increase in circulating plasma lipid levels, especially TG. These data suggested that ANGPTL3 regulates TG-rich lipoprotein metabolism in mice through inhibiting lipoprotein lipase (LPL) and hepatic triglyceride lipase (HTGL) activities. 2,3 Ono et al. 4 reported that the mechanism of LPL inhibition by ANGPTL3 in mouse plasma was highly associated with the cleavage of N-terminal ANGPTL3 (17–165), especially in the region of 61–66. Therefore, we first paid attention to ANGPTL3 as an inhibitor of LPL activity associated with remnant lipoprotein (RLP) metabolism in humans.
However, Shimamura et al.
5
and Moon et al.
6
recently found that plasma ANGPTL3 levels were not correlated with TG levels in human plasma unlike in mice and was shown to be more strongly associated with high-density lipoprotein (HDL) metabolism. Furthermore, we found that ANGPTL3 was more frequently associated with increased HDL-C rather than c
From these results, we investigated if ANGPTL3 really regulates TG-rich lipoprotein metabolism through inhibiting LPL and HTGL activities in human plasma as in mice. LPL has been known to hydrolyse chylomicrons and very low-density lipoproteins (VLDL) to form their remnants in human plasma, 7,8 and HTGL has been known to hydrolyse β-VLDL or intermediate density lipoproteins (IDL) to form small, dense LDL (sd LDL). 9 HTGL is also known to hydrolyse TG in LDL and HDL, especially to hydrolyse HDL2 to form HDL3. 10,11 Therefore, we speculated that if ANGPTL3 regulates both LPL and HTGL activity to form RLPs and sd LDL, the inverse correlations between ANGPTL3 concentration and LPL and HTGL activities could be found in human plasma.
Here, we have analysed the concentrations of ANGPTL3, TG, RLPs, sd LD-C and HDL-C in human plasma, together with LPL and HTGL activity recently developed by Imamura et al. 12,13 For the analysis of LPL and HTGL activities, we used post-heparin plasma in the fasting and postprandial states to measure the lipase activities associated with RLP metabolism. For sd LDL analysis, we have used the sd LDL-cholesterol (sd LDL-C) assay, which is a quantitative assay based on the density rather than particle size. 14 The detection method of LPL activity, HTGL activity and sd LDL-C we used in this study are newly developed methods in Japan and different from the previous methods reported on these interactions. The analysis was conducted in the plasma of 20 overweight and obese volunteers who were generally healthy and susceptible to be postprandial remnant hyperlipoproteinaemia, appropriate for the study of interactions among lipase activities and other parameters. Especially as the fructose intake is known to increase postprandial TG and decrease HDL-C, 15 we have investigated the cases under these conditions.
Taken together, we have investigated the role of ANGPTL3 on LPL and HTGL activities in RLPs, sd LDL and HDL metabolism in humans and discussed the differences between the mouse studies reported previously. 1–4
Materials and methods
Study subjects
The study in 20 healthy volunteers who were overweight and obese and were susceptible to be postprandial remnant hyperlipoproteinaemia was performed in men (n = 10) (age 54.3 ± 4, body mass index [BMI] 29 ± 1, waist circumference 101 ± 2 cm, body fat 29 ± 1%, systolic blood pressure 120 ± 2 mmHg, diastolic blood pressure 77 ± 1 mmHg) and postmenopausal women (n = 10) (age 54 ± 2, BMI 30 ± 1, waist circumference 92 ± 6 cm, body fat 41 ± 2%, systolic blood pressure 117 ± 2 mmHg, diastolic blood pressure 76 ± 2 mmHg) at the University of California, Davis. The UC Davis Institutional Review Board approved the experimental protocol, and subjects provided informed consent to participate in the study. All the volunteers were generally healthy and did not take any medications during this study. Blood samples were provided to analyse this study from the fructose and glucose comparison study reported by Stanhope et al. 15
Fasting blood samples were collected at 8:00 in the morning and postprandial blood samples were collected at 20:00 in the evening on the same day. Between sampling, each subject consumed a standardized breakfast (9:00), lunch (13:00) and dinner (18:00) provided by study staff containing 55% of energy as carbohydrate, 30% fat and 15% protein. The energy content of the meals was based on each subject's energy requirement as determined by the Mifflin equation. 16 The carbohydrate was provided as 25% of energy as glucose- or fructose-sweetened beverages (two different treatment groups) and 30% complex carbohydrate. Each volunteer participated in fasting and postprandial pre- and post-heparin blood collections (heparin was infused before 15 min at each blood withdrawal) on two different days over a period of 12 weeks. Therefore, from 20 volunteers under different conditions at each time two fasting bloods and two postprandial bloods were withdrawn for analysis on different days before and after fructose and glucose treatment. As shown in the study by Stanhope et al. 15 there was no statistical difference on lipid parameters among the before glucose, after glucose and before fructose group. Only the after fructose group was statistically different on lipid parameters from the other groups. However, the statistical trends were the same with and without the after fructose group. Therefore, all the data were pooled for a total of 40 pairs of fasting and postprandial time points.
Measurements of lipids, lipoproteins, ANGPTL3 and lipase activities
The plasma samples for the measurement of TC, TG, HDL-C, LDL-C, RLP-C, RLP-TG and sd LDL-C were withdrawn immediately before heparin infusion and kept frozen at −80°C until analysis. As LPL and HTGL activities were not detectable in pre-heparin plasma, 12 all the lipase activities in this study were determined in post-heparin plasma. Post-heparin plasma in 15 min after an intravenous injection of 50 U of heparin/kg body weight was withdrawn for the assay of LPL activity, HTGL activity and ANGPTL3. Plasma samples were kept frozen at −80°C until analysis. TC and TG concentrations were determined enzymatically. LDL-C and HDL-C concentrations were measured using a homogeneous method (Kyowa Medex, Tokyo, Japan). Glucose and insulin were determined by PolyChem (Polymedco, Cortlandt Manor, NY, USA). RLP-C and RLP-TG were determined by the immunoseparation method (JIMRO II, Otsuka, Tokyo, Japan). 17 Sd LDL-C was determined by the method of Hirano et al. 14 ANGPTL3 was measured by the enzyme-linked immunosorbent assay method by Moon et al. 6 LPL and HTGL activities were measured by the method of Imamura et al. 13
Briefly, lipase activities were assayed by measuring the increase in absorbance at 546 nm due to the quinoneine dye. Reaction mixture-1 (R-1) contained dioleoylglycerol solubilized with lauryldimethylaminobetaine, monoacylglycerol-specific lipase, glycerolkinase, glycerol-3-phosphate oxidase, peroxidase, ascorbic acid oxidase and apolipoprotein C-II (apoC-II). R-2 contained Tris-HCl (pH 8.7) and 4-aminoantipyrine. An automated assay of lipase activities was performed with an automatic clinical analyser. In the assay for HL + LPL activity, 160 μL R-1 was incubated at 37°C with 2 μL of sample for five minutes, and 80 μL R-2 was added. HTGL activities were measured under the same conditions without apoC-II.
Statistical analysis
Data were analysed with Dr SPSS II (SPSS, Chicago, IL, USA). Quantitative variables are reported as mean ± standard deviation values. The statistical significance of difference was determined by the Mann-Whitney U test. Pearson's correlation coefficients (r-value) were determined and single linear regression analysis was performed to detect associations between variables. P < 0.05 was statistically significant.
Results
Plasma lipids, lipoproteins, LPL activity, HTGL activity and ANGPTL3 analyses in the fasting and postprandial states
The fasting and postprandial plasma levels of lipids and lipoproteins in 20 volunteers recruited in UC Davis, CA are shown in Table 1. The mean total cholesterol and LDL-C levels were within normal range and did not change between the fasting and postprandial states. TGs, RLP-C and RLP-TG levels were significantly elevated and sd LDL-C and HDL-C significantly decreased in the postprandial state. LPL and HTGL activities did not change significantly. ANGPTL3 levels decreased significantly in the postprandial plasma compared with in the fasting plasma. A single regression analysis of these parameters in 20 volunteers is shown in Table 2. ANGPTL3 did not correlate significantly with TG and RLP-C and RLP-TG in the fasting state and with those in the postprandial state (except RLP-C), while it was significantly correlated with HDL-C in the fasting state.
Plasma lipids, lipoproteins, lipases and ANGPTL3 in 20 volunteers
HDL-C, high-density lipoprotein; RLP, remnant lipoprotein; TG, triglycerides; sd LDL-C, small-dense LDL-cholesterol; LPL, lipoprotein lipase; HTGL, hepatic triglyceride lipase; ANGPTL3, angiopoietin-like protein 3; NS, non-significant
P value means fasting state versus postprandial state
Single linear regression analysis of plasma lipids, lipoproteins, lipases and ANGPTL3 in 20 volunteers
TG, triglycerides; RLP, remnant lipoprotein; sd LDL-C, small-dense LDL-cholesterol; HDL-C, high-density lipoprotein; LPL, lipoprotein lipase; HTGL, hepatic triglyceride lipase; ANGPTL3, angiopoietin-like protein 3
*P < 0.001
**P < 0.01
***P < 0.05
TG correlations between LPL activity, HTGL activity and ANGPTL3
Plasma TG concentration was inversely correlated with LPL activity (Figure 1a) both in the fasting (r = −0.63, P < 0.001) and postprandial (r = −0.68, P < 0.001) states, respectively, while no correlation was found with HTGL activity (Figure 1b) both in the fasting (r = 0.04, not significant [NS]) and postprandial (r = 0.18, non-significant [NS]) states. No correlation was found with ANGPTL3 both in the fasting and postprandial state (Figure 1c, Table 2).
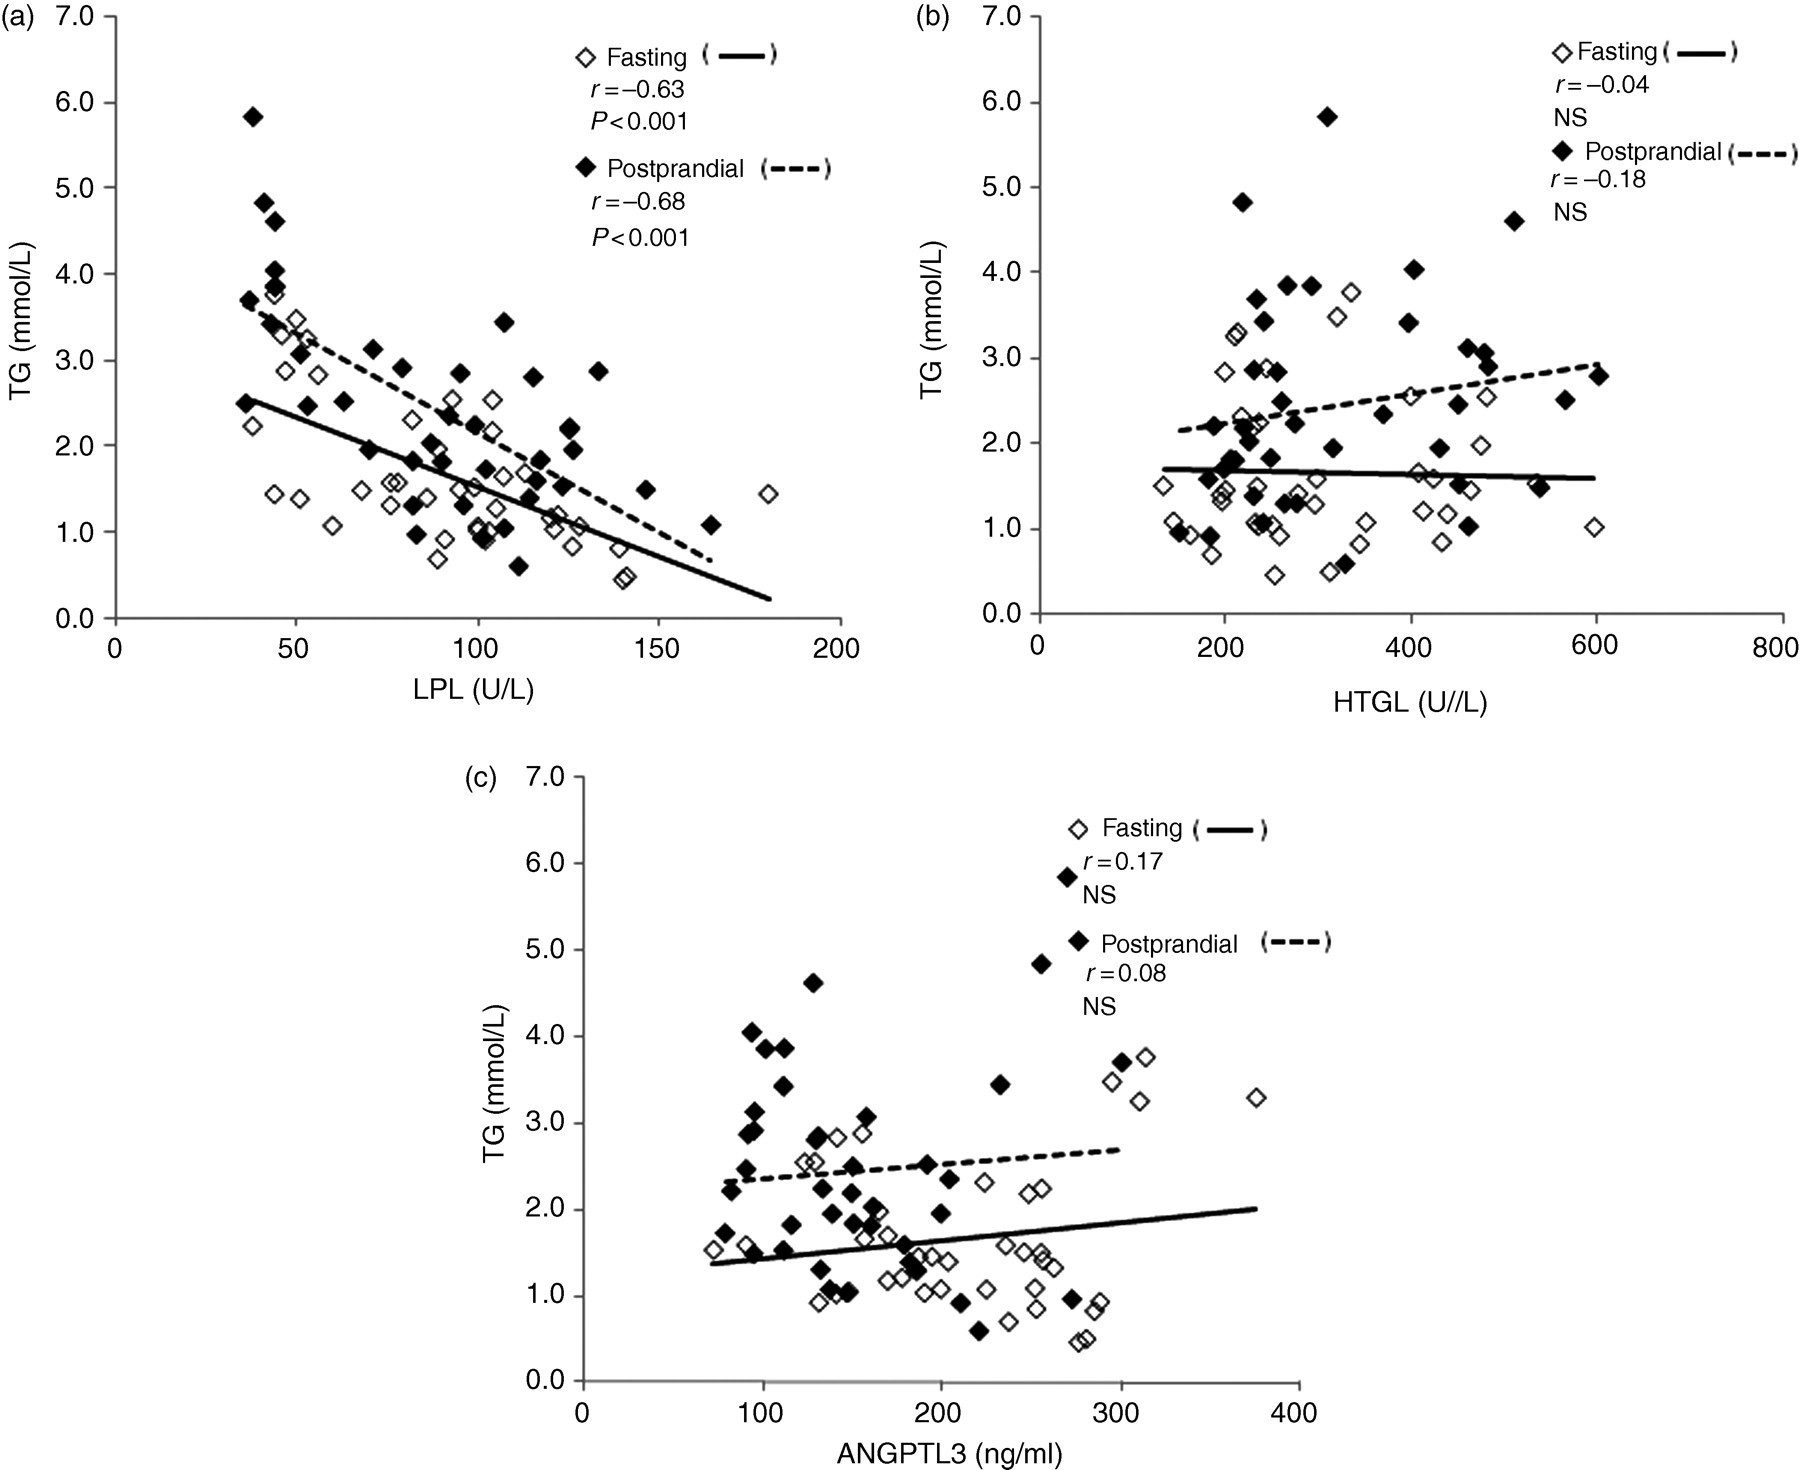
TG correlations between LPL activity, HTGL activity and ANGPTL3 in 20 subjects. Plasma TG was inversely correlated with LPL activity (a). No correlation was found between TG and HTGL activities (b). No correlation was found between TG and ANGPTL3 (c). Eighty plots reflect the total of four plots in each volunteer in the fasting (n = 40) (open square) and postprandial (n = 40) (closed square) states, before and after glucose and fructose treatment study during 12 weeks. TG, triglyceride; ANGPTL3, angiopoietin-like protein 3; HTGL, hepatic triglyceride lipase; LPL, lipoprotein lipase
RLP-C correlations between LPL activity, HTGL activity and ANGPTL3
RLP-C was inversely correlated with LPL activity (Figure 2a) both in the fasting (r = −0.42, P < 0.001) and postprandial (r = −0.58, P < 0.001) states, respectively, while no correlation was found with HTGL activity both in the fasting and postprandial states (Figure 2b). No correlation was found with ANGPTL3 in the fasting and postprandial states (Table 2).
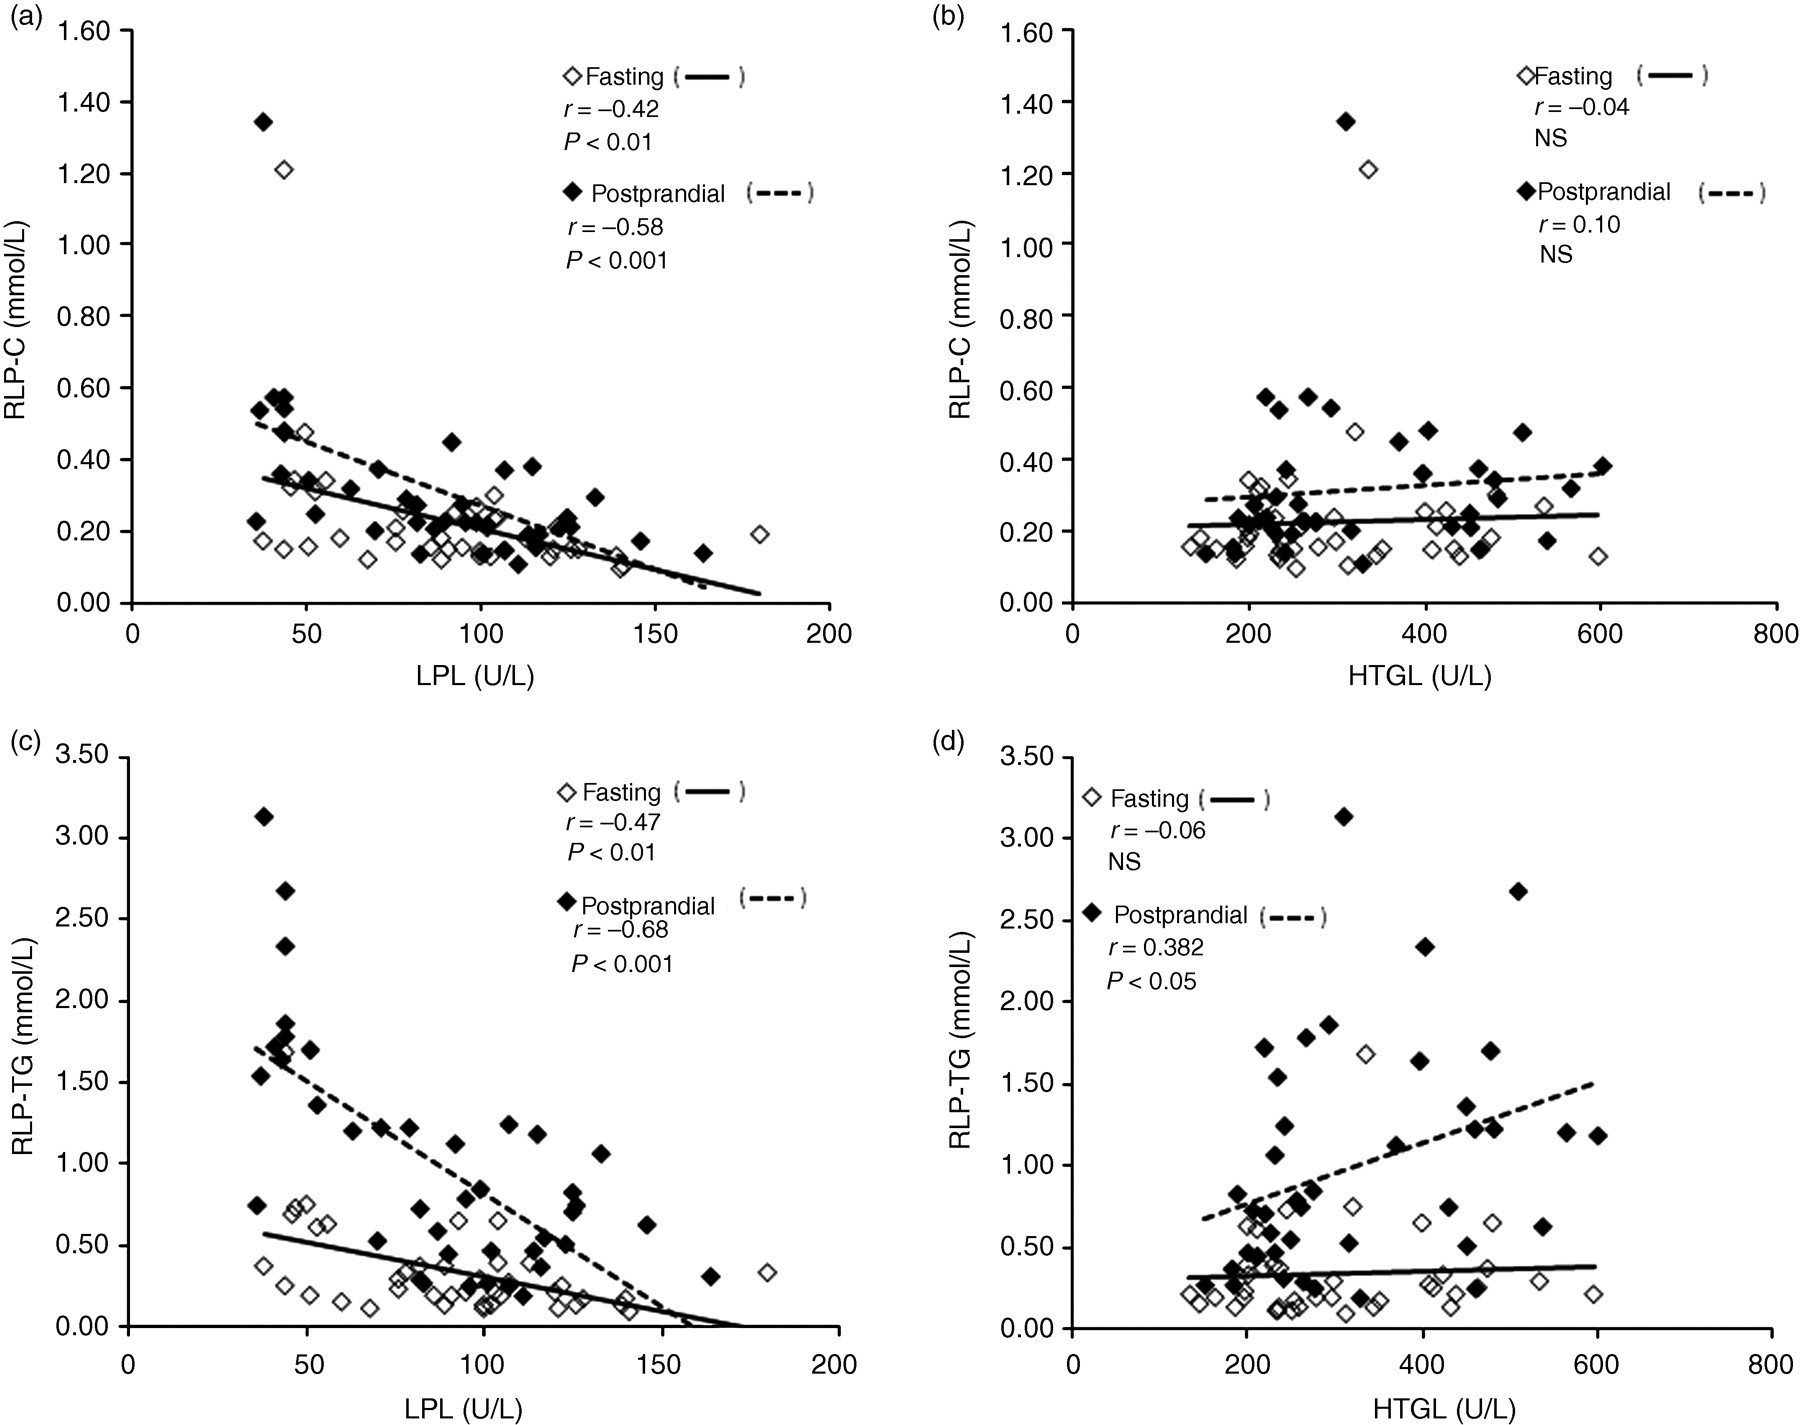
RLP-C and RLP-TG correlations between LPL activity and HTGL activity in 20 subjects. Plasma RLP-C was inversely correlated with LPL activity (a). No correlation was found between RLP-C activity and HTGL activity (b). Plasma RLP-TG was inversely correlated with LPL activity (c) and positively correlated with ANGPTL3 in the postprandial state (d). Eighty plots reflect a total of four plots in each volunteer in the fasting (n = 40) (closed square) and postprandial (n = 40) (open square) states, before and after glucose and fructose treatment study during 12 weeks. RLP, remnant lipoprotein; TG, triglyceride; ANGPTL3, angiopoietin-like protein 3; HTGL, hepatic triglyceride lipase; LPL, lipoprotein lipase
RLP-TG correlations between LPL activity, HTGL activity and ANGPTL3
RLP-TG was inversely correlated with LPL activity (Figure 2c) both in the fasting (r = −0.47, P < 0.01) and postprandial (r = −0.68, P < 0.001) states, respectively, and correlated with HTGL activity in the postprandial state (r = 0.33, P = 0.03) (Figure 2d); not correlated in the fasting state, but slightly correlated in the postprandial state. Slightly positive correlation between RLP-TG and HTGL activities means that HTGL does not hydrolyse RLP-TG. No correlation was found with ANGPTL3 in the fasting and postprandial states (Table 2).
Correlations of sd LDL-C between LPL activity, HTGL activity and ANGPTL3
Table 2 shows that sd LDL-C was inversely correlated with LPL activity, both in the fasting (r = −0.43, P < 0.001) and postprandial (r = −0.35, P < 0.05) states, respectively, while no correlation was found with HTGL activity both in the fasting and postprandial states. No correlation was found with ANGPTL3 in the fasting and postprandial states. Furthermore, sd LDL-C with TG, RLP-C and RLP-TG were positively correlated both in the fasting (r = 0.55, P < 0.001; r = 0.28, NS; r = 0.38, P < 0.01) and postprandial (r = 0.38, P < 0.01; r = 0.33, P < 0.05; r = 0.27, P < 0.05) states, respectively. Although sd LDL-C levels significantly decreased, and RLP-C and RLP-TG levels significantly increased in the postprandial state (Table 1), positive correlations were shown among them.
HDL-C correlations between LPL activity, HTGL activity and ANGPTL3
HDL-C was positively correlated with LPL activity in the fasting (r = 0.38, P < 0.01) and postprandial (r = 0.45, P < 0.01) (Figure 3a) states and inversely correlated with HTGL in the fasting (r = −0.49, P < 0.001) and postprandial states (r = −0.50, P < 0.01) (Figure 3b). HDL-C was positively correlated with ANGPTL3 in the fasting (r = 0.36, P < 0.05) but not in the postprandial (r = 0.32, NS) states (Figure 3c).
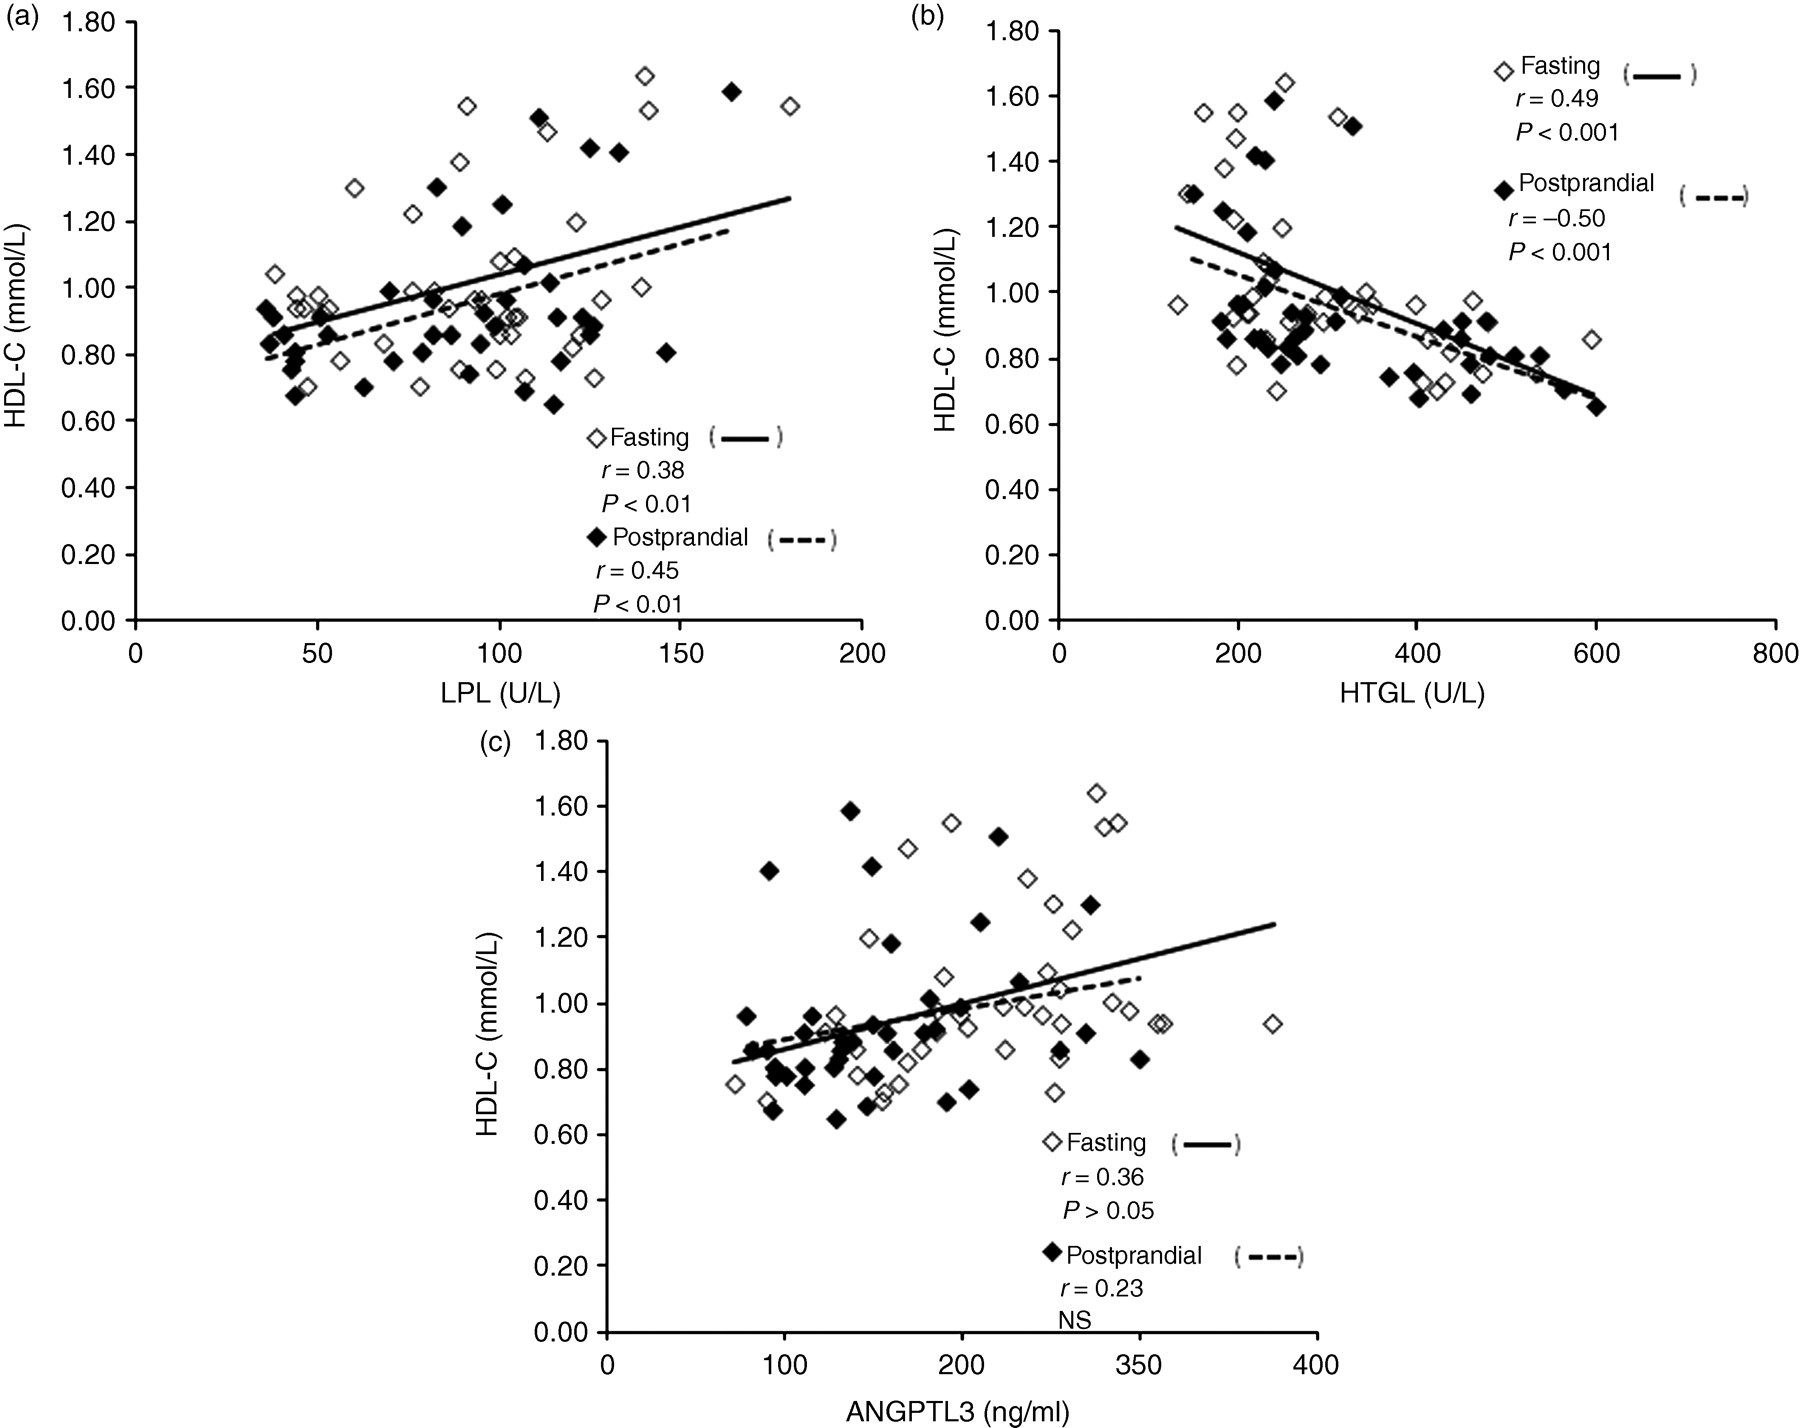
HDL-C correlations between LPL activity, HTGL activity and ANGPTL3 in 20 subjects. HDL-C was positively correlated with LPL activity (a) and inversely correlated with HTGL (b). HDL-C was positively correlated with ANGPTL3 in the fasting state (c). Eighty plots reflect the total of four plots in each volunteer in the fasting (n = 40) (open square) and postprandial (n = 40) (closed square) states, before and after glucose and fructose treatment study during 12 weeks. HDL-C, high-density lipoprotein-cholesterol; ANGPTL3, angiopoietin-like protein 3; HTGL, hepatic triglyceride lipase; LPL, lipoprotein lipase
ANGPTL3 correlations between LPL activity and HTGL activity
As the plasma concentrations of ANGPTL3 were not affected by heparin infusion, ANGPTL3 was determined in post-heparin plasma together with LPL and HTGL activities. ANGPTL3 concentration was not correlated with LPL activity (Figure 4a) both in the fasting (r = −0.21, NS) and postprandial (r = −0.20, NS) states; however, it was inversely correlated with HTGL (Figure 4b) both in the fasting (r = −0.50, P < 0.001) and postprandial (r = −0.31, P < 0.05) states. These results strongly suggest that ANGPTL3 is not an inhibitor for LPL activity in humans, but an inhibitor for HTGL activity in human plasma.
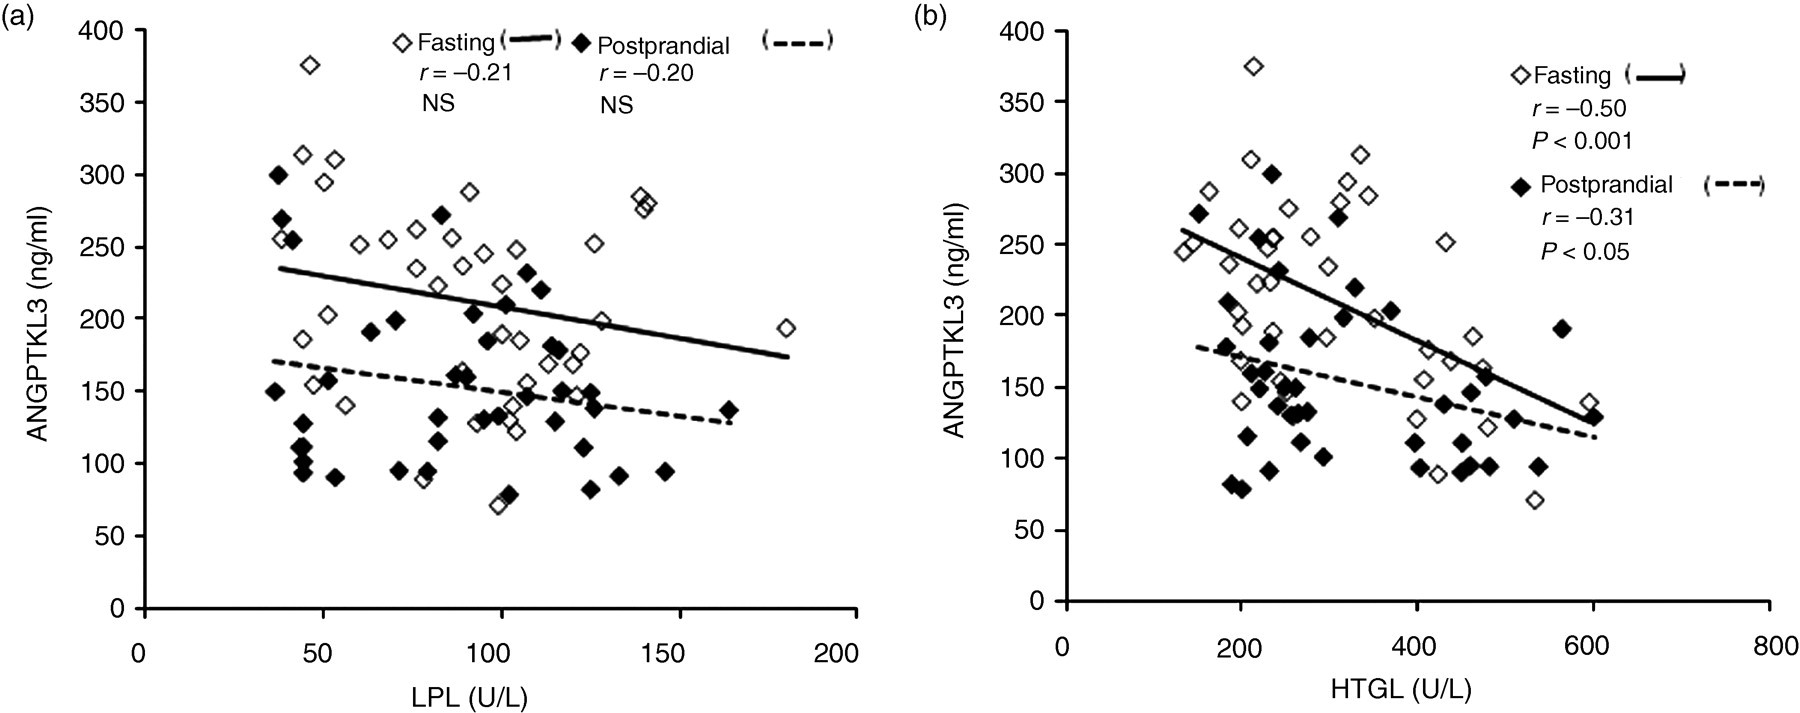
ANGPTL3 correlations between LPL activity and HTGL activity in 20 subjects. ANGPTL3 concentration was not correlated with LPL activity (a) both in the fasting and postprandial states; however, it was inversely correlated with HTGL (b) both in the fasting (r = −0.50, P < 0.001) and postprandial (r = −0.31, P < 0.05) states. Eighty plots reflect the total of four plots in each volunteer in the fasting (n = 40) (open square) and postprandial (n = 40) (closed square) states, before and after glucose and fructose treatment study during 12 weeks. ANGPTL3, angiopoietin-like protein 3; HTGL, hepatic triglyceride lipase; LPL, lipoprotein lipase
Discussion
RLPs have been recognized as the metabolized products of TG-rich lipoproteins by lipoprotein lipase (LPL) and hepatic TG lipase. ANGPTL3 was considered to be the inhibitor of both LPL and HTGL activity and to cause the delayed metabolism of TG-rich lipoproteins in animal studies. 1–4 However, the interactive roles of ANGPTL3 on LPL and HTGL activity in humans have not been reported yet.
In this manuscript, we have shown the correlation between the lipase activities and its inhibitor ANGPTL3 in RLP and HDL metabolism in human plasma, using the newly developed LPL, HTGL activity assay method, 12,13 which are highly correlated with the currently used radioisotope methods. The previous investigators have all used the radioisotope method for the LPL and HTGL activity assay developed by Brunzell et al. 18 in their ANGPTL3 studies, which are labour intensive and known to typically have within- and between-run coefficients of variation of over 10%. Our analyses of LPL and HTGL activities were carried with a high-throughput activity assay performed on an automated analyser, with coefficients of variation of 3% or less. Therefore, it was possible to measure a large number of plasma samples at one time to compare the correlations with these parameters.
The study was conducted in the fasting and postprandial states in 20 healthy volunteers to investigate the relationship between lipase activities and ANGPTL3, mainly in RLP metabolism. As LPL and HTGL activity assay requires post-heparin plasma, it has been difficult to measure the lipase activities in the postprandial state time dependently, neglecting heparin influence on lipid metabolism. Several articles reported pre-heparin plasma LPL mass in the postprandial state, indicating that LPL levels were negatively correlated with TG and positively correlated with HDL-C. 19–21 A recent research revealed the significant increase of VLDL-bound LPL after meal in pre-heparin plasma. 22
However, Table 1 shows no change in LPL levels between fasting and postprandial states, which reflected the dissociated stored LPL attached to endothelial cells. Therefore, the interpretation of the results may be different between pre- and post-heparin LPL activities in the postprandial state. Insulin is known to increase the synthesis of LPL in adipose tissue. 23 However, as reported by Sadur and Eckel, 24 insulin has no short-term regulatory effect on adipose tissue LPL, based on the observation that it took several hours for any significant change in LPL. These studies could explain the result for no difference of LPL levels between the fasting and postprandial states.
ANGPTL3 was found as an inhibitor for both LPL and HTGL in mice. 1–4 ANGPTL3-null mice revealed markedly low plasma lipid concentrations, especially plasma TG concentration with a normal, high-fat or high-calorie diet. Fujimoto et al. 3 reported that lipoprotein lipase and hepatic lipase activities in the post-heparin plasma of ANGPTL3-null mice were 1.57- and 1.42-fold higher than those of wild-type mice, respectively. When ANGPTL3 was overexpressed or injected in mice, the plasma TG and NEFA levels increased significantly within a few hours, indicating the inhibition of LPL and HTGL activity by ANGPTL3. 3 Therefore, ANGPTL3 has been recognized as an inhibitor for both LPL and HTGL in mice and associated with the metabolism of RLPs. ANGPTL3 and TG concentrations in plasma were highly correlated in mice; 1–4 however, it was not observed in human plasma as reported by Shimamura et al. 5 and by Moon et al. 6
In this study, we found that the plasma RLP and sd LDL-C concentrations were inversely correlated with LPL activities. Unexpectedly, HTGL activities were not correlated with RLPs and sd LDL-C in human plasma, which may differ from the previous literatures. 25–30 HTGL has been reported to have a role to hydrolyse small VLDL remnants or IDL to form sd LDL. 25 However, we could not find a correlation between HTGL activity and sd LDL-C concentration, as well as RLPs. Previously, higher HTGL activity was reported to be correlated with higher sd LDL concentration in plasma. 26,27 Therefore, it has been considered acceptable that inhibition of HTGL activity decreases the formation of sd LDL and reduces the risk of cardiovascular disease. The determination of sd LDL in previous studies has been conducted by size or charge separation methods described as patterns A and B. 29 However, we used a new detection method of sd LDL in this study, which determines the cholesterol concentration quantitatively in sd LDL fraction isolated by the density and particle size separation developed by Hirano et al. 14 Using the quantitative sd LDL-C assay method, we could not find any correlation between HTGL activity and sd LDL-C concentration, although we found a strong inverse correlation between LPL activity and sd LDL-C concentration in the same cases, similar to the correlation between LPL activity and RLPs. As is known that sd LDL is positively correlated with RLPs in plasma, 30 these data stand on the same line that RLPs are the precursor of sd LDL and metabolized in the same pathway by LPL. From these data, HTGL does not seem to play a significant role in the metabolic pathway of RLPs unlike reported previously, but plays a definitive role in HDL metabolism in humans. Namely, ANGPTL3 showed a significant inverse correlation with HTGL activity as shown in Figure 4b and positively correlated with HDL-C concentration. 5,6 Furthermore, Shimamura et al. 5 and Jin et al. 31,32 emphasized the role of ANGPTL3 on the inhibition of endothelial lipase (EL) in HDL metabolism. However, the inhibition of EL by ANGPTL3 in human plasma is still unknown because of the difficulty of measuring EL activity. This is the first report that ANGPTL3 is strongly associated with HTGL activity and HDL metabolism in human plasma. The significantly higher frequency of elevated HDL-C associated with elevated ANGPTL3 levels in human plasma could be explained by low HTGL activity, compared with those with low CETP levels as shown by Moon et al. 6
An interesting possibility of the different role of ANGPTL3 on LPL activity in humans and mice is the cleavage of ANGPTL3 in plasma. The cleavage of ANGPTL3 by proprotein convertase is reported to be important for the activation of ANGPTL3 to inhibit LPL activity. 31,32 Ono et al. 4 reported that a majority of ANGPTL3 detected in mouse plasma was cleaved fragments of N-terminal ANGPTL3 (17–165), while only a small amount of N-terminal fragments with a majority of full-length ANGPTL3 were detected in human plasma. They speculated that full-length ANGPTL3 is not able to inhibit LPL in vivo unless it is cleaved to the N-terminal fragment. Therefore, full-length ANGPTL3, which is present mainly in human plasma, may not play a role for inhibiting LPL activity. We now study the role of full-length and N-terminal fragment of ANGPTL3 on LPL activities in human plasma.
Probucol is known to decrease plasma HDL-C levels significantly. As a new mechanism of probucol on HDL-C reduction in addition to the previously known mechanisms, 33 Miida et al. 34 have shown that probucol treatment significantly decreased serum ANGPTL3 concentration. Decreasing ANGPTL3 may enhance HTGL or EL activity 5 and decrease HDL-C significantly. Therefore, probucol could increase HTGL activity through the decrease of ANGPTL3. Homma et al. 35 reported that probucol markedly reduced plasma HDL2 levels. The reduction rates of TC, TG and apo A-I levels in HDL2 were 43.0%, 43.6% and 47.0%, respectively. These results suggested the increased HTGL activity by probucol treatment, possibly through the decrease of ANGPTL3. These findings also suggest that ANGPTL3 does not inhibit LPL activity in human plasma; however, it inhibits HTGL or EL activity to increase HDL-C. Another possibility that probucol reduces the HDL-C level may associate with its inhibitory effect on ABCA1. 36 As the inhibition of ABCA1 is known to disturb cholesterol efflux, HDL concentration may be reduced. However, the plasma concentration of HDL-C may be more strongly dependent on the cholesterol metabolism in the liver or intestine rather than the efflux from the atherosclerosis lesions.
As plasma ANGPTL3 levels reflect HTGL activity inversely and HDL-C positively, ANGPTL3 could be a therapeutic target for raising HDL-C levels like CETP. Because the HTGL activity assay requires heparin infusion before blood withdrawal, ANGPTL3 may take the place of the HTGL activity assay as a therapeutic target, which is not required for heparin infusion analysis.
As for LPL inhibitors associated with RLP metabolism, ANGPTL4 reported by Kersten et al. 37 or recently discovered glycosyl phosphatidyl inositol-anchored high-density lipoprotein-binding protein 1 38 may inhibit LPL activity directly in human plasma and increase the plasma concentration of RLPs, independent of ANGPTL3.
In conclusion, ANGPTL3 was not associated with LPL activity and RLPs in human plasma unlike in mice; however, ANGPTL3 was strongly associated with HTGL activity. Therefore, ANGPTL3 may be strongly associated with HDL metabolism by inhibiting HTGL activity, but not associated with RLP metabolism in humans.
DECLARATIONS