
Abstract
Background
Circulating levels of bioavailable oestradiol and testosterone are often desirable for clinical practice or investigational studies of children. However, assays to measure circulating hormone levels might not always be accessible. We sought to validate the empirical calculation of circulating bioavailable testosterone and oestradiol in children.
Methods
Six hundred and sixty-three eight- to 10-year olds were recruited to the Dietary Intervention Study in Children (DISC). DISC was a randomized clinical trial designed to test efficacy of a dietary intervention to reduce serum cholesterol (LDL-C) in children with elevated cholesterol. Assay measures of oestradiol, testosterone, sex hormone-binding globulin concentration (SHBG) and albumin concentration in girls as well as dihydrotestosterone in boys were measured for up to 10 y. We calculated measures of circulating non-SHBG bound oestradiol and testosterone from total hormone levels using the law of mass action. We compared proportional differences in assay measured minus calculated non-SHBG bound hormone levels versus their averages using generalized estimating equations-estimated linear regressions.
Results
On average, calculated values overestimated assay measured values (−11.7% for non-SHBG bound oestradiol in girls and −2.6% for non-SHBG bound testosterone in boys). The intercept and slope of the regression for non-SHBG bound oestradiol in girls were −0.13 (95% confidence interval [CI] −0.14 to −0.12) and 0.005 (95% CI 0.003–0.007), respectively. The intercept and slope for non-SHBG bound testosterone in boys were −0.16 (95% CI −0.17 to −0.14) and 0.0006 (95% CI 0.0005–0.0006).
Conclusion
While calculated values might be useful for research purposes, they are generally not close enough for clinical purposes.
Introduction
The bioavailable fractions of oestradiol (E2) and testosterone (T) include hormones that are freely circulating and bound to albumin but not bound to sex hormone-binding globulin (SHBG) and are collectively the non-SHBG bound fraction. Circulating levels of non-SHBG bound E2 and T are desirable for clinical practice or investigational studies. However, assays to measure circulating levels of these hormones are often not done because the tests are not always readily accessible, might require more serum than is available or might be considered too expensive. In addition, some methods of direct measurement are reported to be too inaccurate to be effective. 1,2 As a result, a number of authors have published or validated formulae for estimating bioavailable T and bioavailable E2 using total hormone levels in blood. 3–5 DeVan and colleagues 6 estimated that using calculated rather than directly measured bioavailable T in one medical centre would save in excess of $60,000/y if such calculations are accurate. It must be noted that calculated estimates using formulas are only as accurate as the measured values input into the formula making accurate and specific measures of T, E2 and SHBG an absolute requirement.
We know of no study that has validated the empirical calculation of circulating bioavailable T and E2 in children. In this paper, we investigate the validity of estimating non-SHBG bound E2 and T in children using formulas based on the law of mass action.
Subjects and methods
Data came from the Dietary Intervention Study in Children (DISC). DISC was a multicentre randomized controlled clinical trial sponsored by the National Heart, Lung and Blood Institute to test safety and efficacy of a dietary intervention to reduce serum low-density lipoprotein cholesterol (LDL-C) in children with elevated LDL-C. Design and results of DISC have been described. 7–9 Briefly, between 1988 and 1990, 663 eight- to 10-year olds with elevated LDL-C were randomly assigned to a dietary intervention to reduce fat intake or to usual care at one of six DISC clinical centres. The initial DISC protocol was designed for three years and was subsequently extended with planned intervention and follow-up of all participants until 18 y of age. The timing of the last blood draw relative to study initiation was variable due to early termination of the study in 1997 for lack of a treatment effect.
DISC recruited 362 boys and 301 girls through schools, health maintenance organizations and paediatric practices. Boys were eligible if they were 8.6–10.8 y old and girls were eligible if they were 7.8–10.1 y old. Eligibility requirements stipulated that children have serum LDL-C level in the 80th to 98th percentiles, had no major illness, were not taking medications that affect lipid levels or growth, were at least in the 5th percentile for height and in the 5th–90th percentiles for weight for height, were Tanner stage 1 for genital and pubic hair development and had normal psychosocial and cognitive development.
Assent was obtained from DISC participants and written informed consent was obtained from their parents or guardians prior to randomization and again when the study was extended. The DISC protocol and Hormone Ancillary Study were approved by Institutional Review Boards at all participating centres, and a National Heart, Lung and Blood Institute-appointed independent data and safety monitoring committee provided oversight.
Hormone assays
Blood was collected at a visit through a single blood sample by venipuncture in the morning after an overnight fast. Serum was separated by centrifugation after the blood sample was kept at room temperature for at least 45 min to allow complete clotting. Serum was then aliquoted and stored in glass vials at −80°C.
Dorgan and colleagues 10,11 provide extensive details of the assays used for this study. We summarize some of their characteristics here. Hormone assays were performed by Esoterix Endocrinology Inc (Calabasas Hills, CA, USA) using standard procedures. E2 was measured using a modification of the procedure developed by Wu and Lundy. 12 Serum samples were extracted with hexane:ethyl acetate, 80:20 (vol/vol). The extract was then washed with dilute base, concentrated and chromatographed on Sephadex LH20 microcolumns (Sigma, St Louis, MO, USA). E2 was specifically eluted using benzene:methanol, 85:15 (vol/vol). E2 was quantified by radioimmunoassay (RIA) in duplicate using antiserum raised to an E2–6-oxime–bovine serum albumin (BSA) conjugate.
T was measured using a modification of the procedure developed by Furuyama et al. 13 Samples were extracted with hexane:ethyl acetate, 90:10 (vol/vol), and the extracts were applied to aluminium oxide microcolumns. The columns were washed with hexane containing 0.55% ethanol, and T was specifically eluted using hexane containing 1.4% ethanol. T in eluates was quantified in duplicate by RIA using antiserum raised to a T–3-oxime–BSA conjugate.
To measure dihydrotestosterone (DHT), serum samples were first extracted with seven volumes of hexane:ethyl acetate. Extracts were then evaporated to dryness and redissolved in potassium permanganate to oxidize steroids containing conjugated ketones. DHT was then selectively re-extracted. Duplicate aliquots of each purified sample were measured by RIA using antiserum raised to a DHT–3-oxime–BSA conjugate.
SHBG was measured by a radioimmunometric assay. The serum sample and an SHBG monoclonal antibody labelled with 125I were incubated with plastic beads coated with a different SHBG monoclonal antibody. The beads were washed to remove unbound label and the bound radioactivity was measured.
The per cent non-SHBG bound E2 and the per cent non-SHBG bound T were determined by ammonium sulphate precipitation as described by Mayes and Nugent. 14 The concentration of non-SHBG bound steroid was then calculated as the product of its total concentration and the per cent that was non-SHBG bound. In the paper, we refer to these as assay measured values. Assay measured non-SHBG bound T was collected for boys only, while assay measured non-SHBG bound E2 was collected for girls only.
Serum albumin was not measured in all subjects at all visits; however, the subjects were healthy, allowing for its approximation when missing using the average measured albumin level.
For external quality assurance, three sex-specific external quality controls indistinguishable from participant samples were included in each hormone batch. Lab personnel were blinded to which samples were participant samples and which were quality control samples. As reported by Dorgan et al., 10,11 coefficients of variation (CV) of these assays, as estimated from the external quality control samples, were 6–30% for E2 for girls, 6–26% for T for both sexes, 13–24% for DHT for boys and 15% for SHBG for girls. Higher CVs were generally related to lower mean hormone levels. The limits of detection for T, E2 and DHT were 3.0, 0.5 and 2.0 ng/dL, respectively.
RIA and mass spectrometry (MS) estimates of E2, DHT and T at levels commonly seen in children showed good agreement as described by Dorgan and colleagues. 11 This was similar to unpublished adult data from Esoterix Endocrinology that found a regression slope of MS on RIA of 1.14 for E2 (coefficient of determination, R 2 = 0.98) and a slope of RIA on MS of 1.09 for T (R 2 = 0.99), indicating some bias.
Calculating non-SHBG bound E2 and T
Assay measures of total E2, T, SHBG concentration (C SHBG) and albumin concentration (C a) used to calculate the bioavailable fractions of E2 including free and non-SHBG bound levels of E2 in girls were collected at years 1, 3, 5, 7 and the last follow-up visit of the study. Assay measures of total E2, T, C SHBG, C a and DHT used to calculate free and non-SHBG bound levels of T in boys were collected at years 3, 5, 7 and the last follow-up visit of the study. Because few children completed both a seven-year follow-up and a last visit due to early study termination, we do not present the seven-year follow-up data from children with both visits in tables. However, these values were used in plots described below.
We used the methods detailed in Rinaldi et al. 3 to first estimate the amount of free T (fT) and free E2 (fE2) for boys and girls using these data. We then used these results to estimate the amount of non-SHBG bound T and non-SHBG bound E2 for comparison with assay measured values. As cited in Rinaldi et al., 3 we used the single equation models, 4 and the multiequation models (3 equations for boys, 2 equations for girls) 5 to estimate fT and fE2. We could not use the three-equation model in girls since DHT data were not collected for them. However, girls' DHT concentrations remain low throughout puberty.
The equations are based on the mass action law. T, DHT and E2 circulate in serum free or are bound to albumin or SHBG. The equations use the following affinity constants in litres/mol for albumin as cited in Rinaldi and colleagues
3
: KaT = 4.06 × 10⁴ (T), KaE2 = 4.21 × 10⁴ (E2) and KaDHT = 3.5 × 10⁴ (DHT), and the following respective constants in litres/mol for C
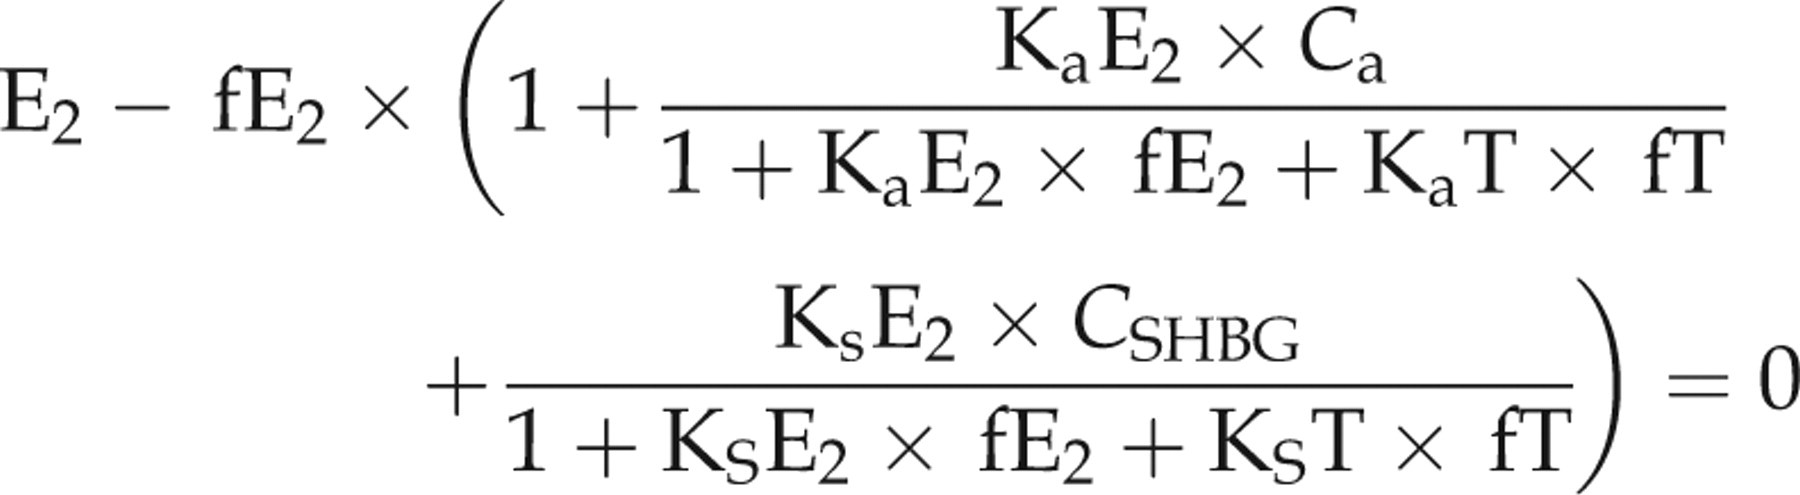
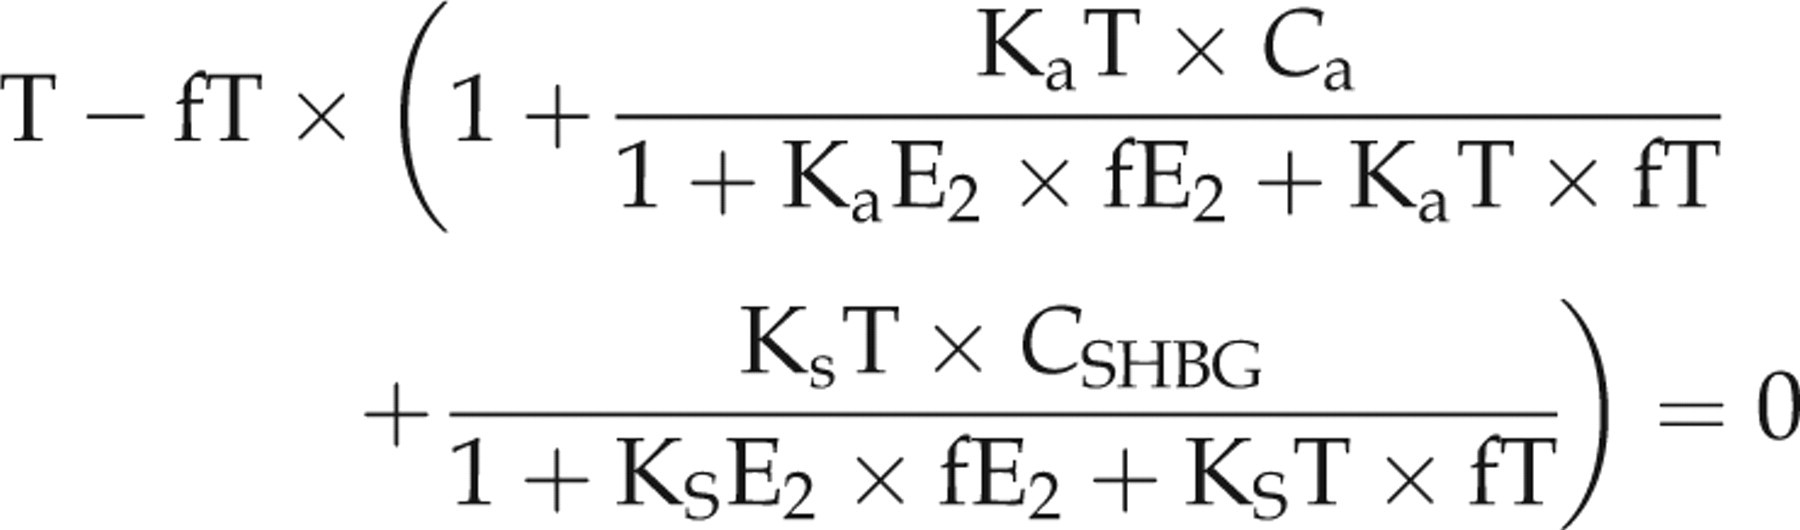
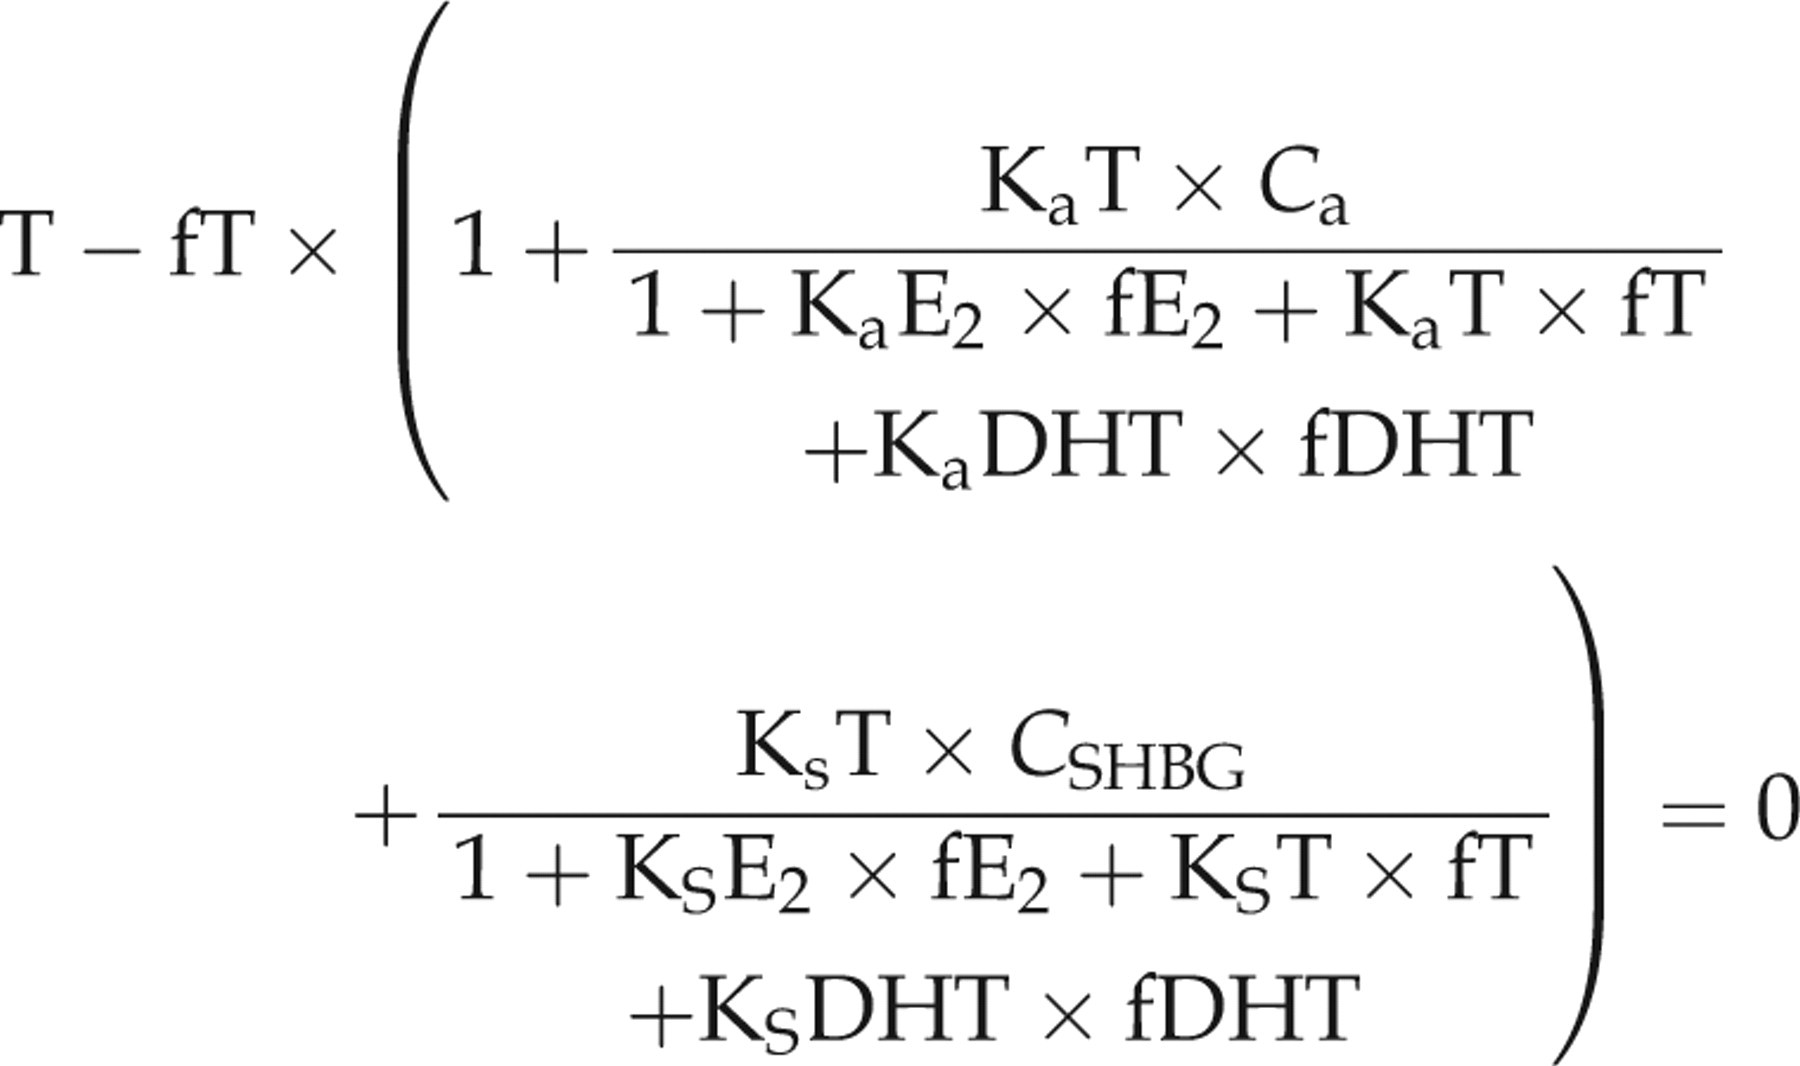
SHBG: KsT = 1 × 10⁹, KsE2 = 3.14 × 10⁸ and KsDHT = 3 × 10⁹. Specifically, we calculated fT and fE2 in girls by solving for fT and fE2 using the following set of equations adapted from Rinaldi et al.
3
In the equations, fT and fE2 are the only two unknowns:
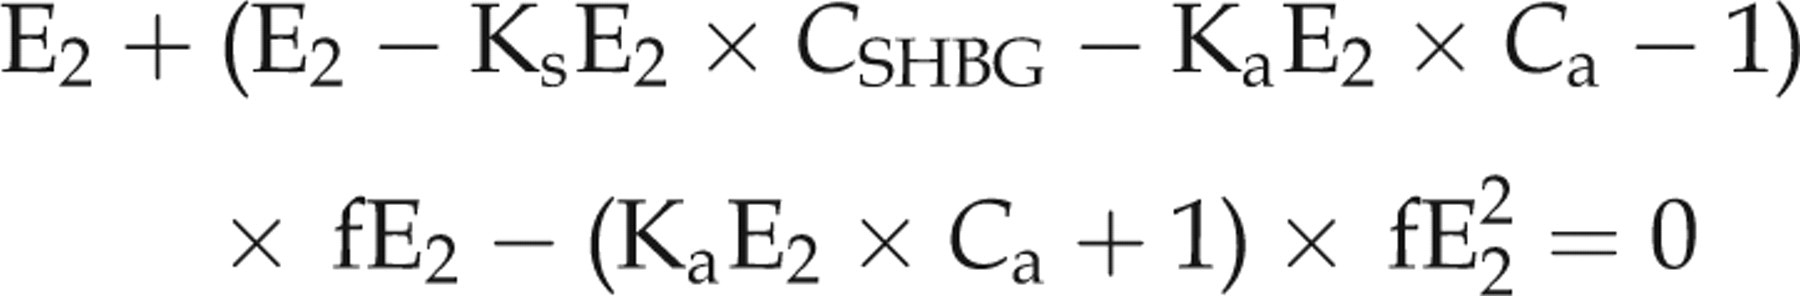
We compared this to results from the single equation method reproduced from Rinaldi et al.
3
that does not use T data:
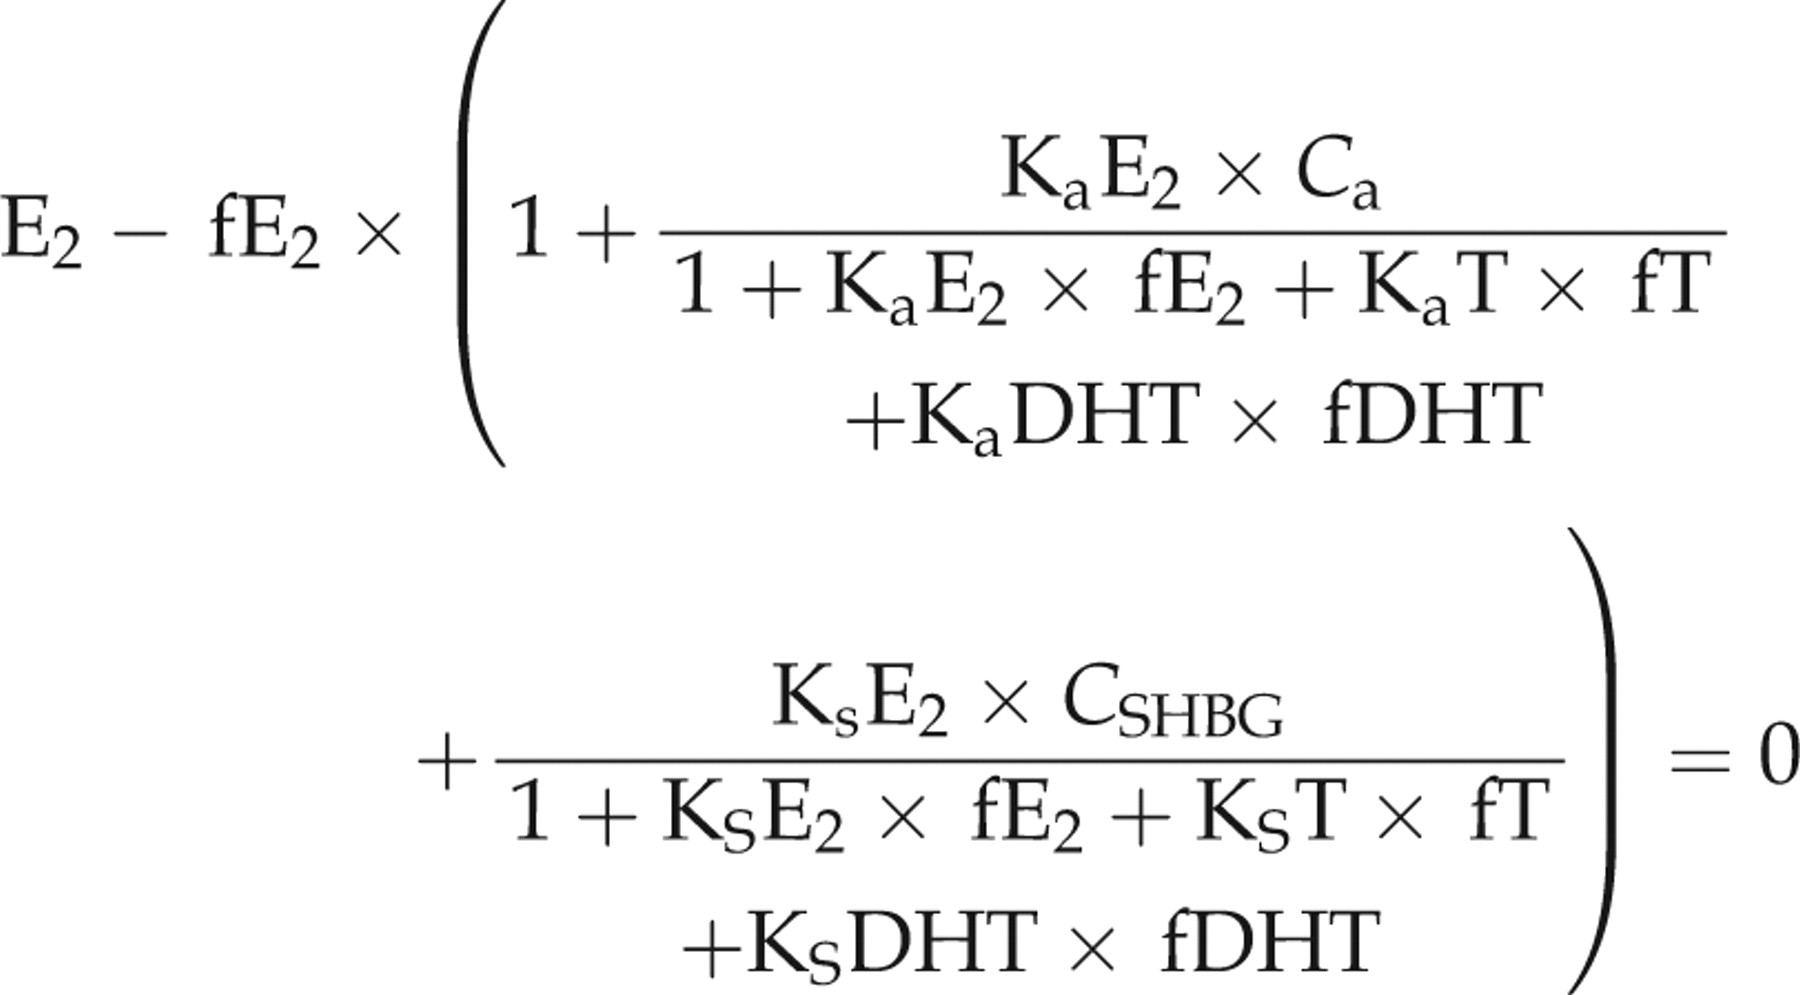
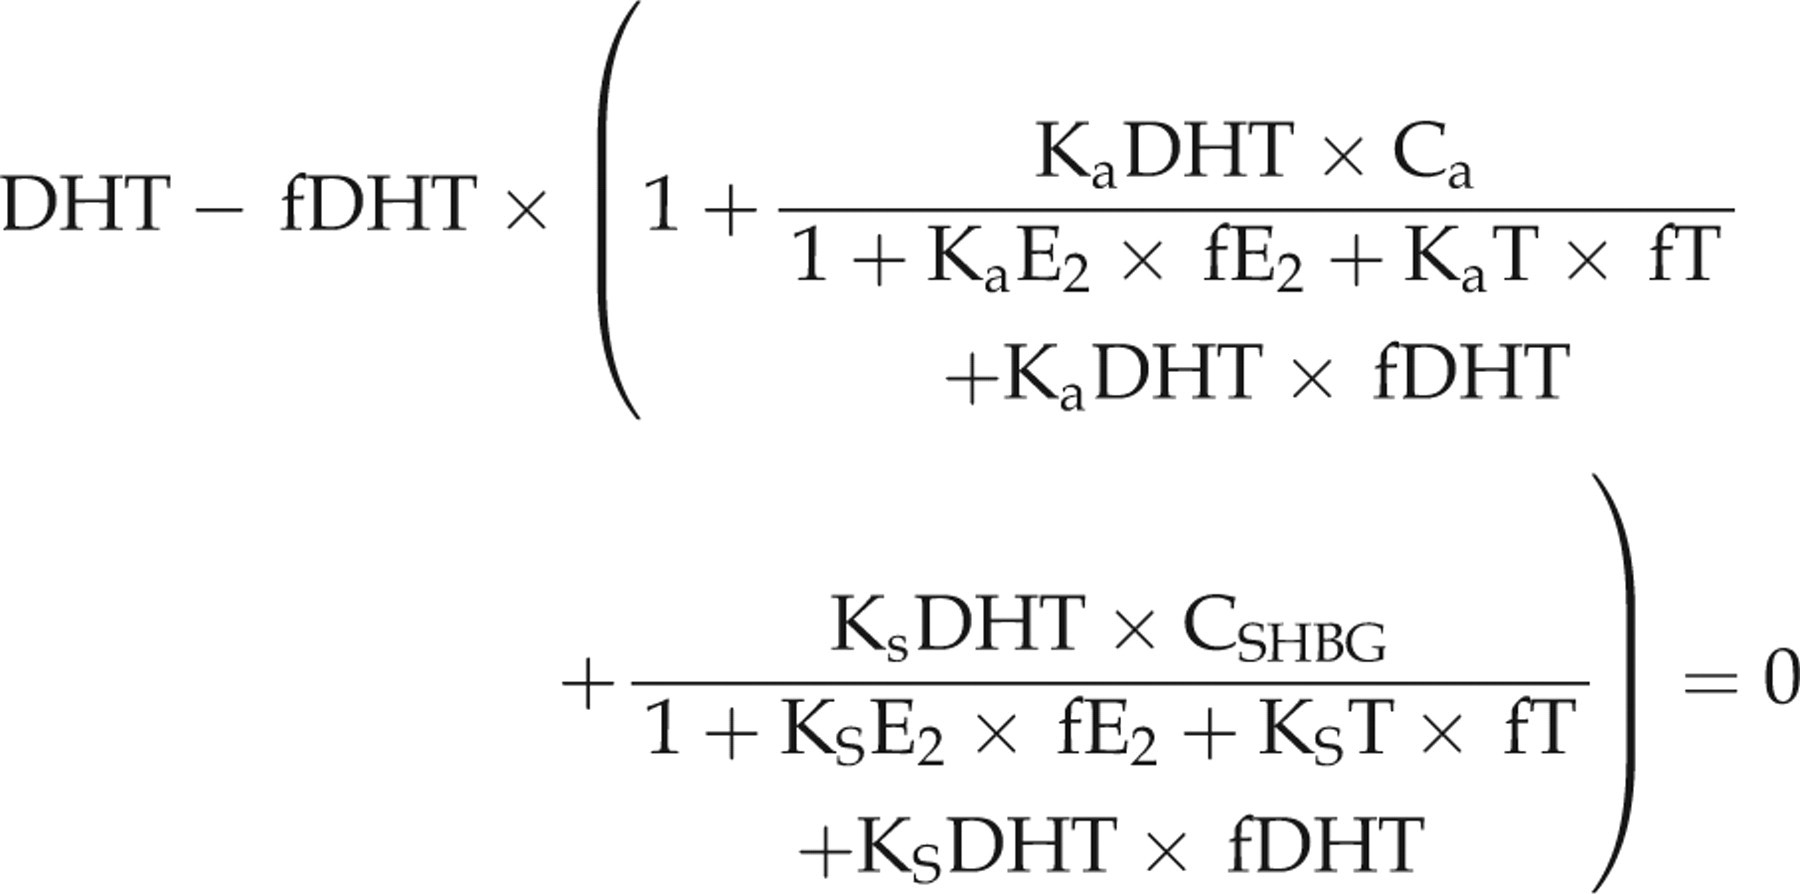
Similarly, we calculated fT, fE2 and fDHT in boys using the following set of equations also reproduced from Rinaldi et al.
3
In the equations, fT, fE2 and fDHT are the only unknown quantities:
We compared this to results from the single equation method reproduced from Rinaldi et al.
3
that does not use E2 or DHT data:
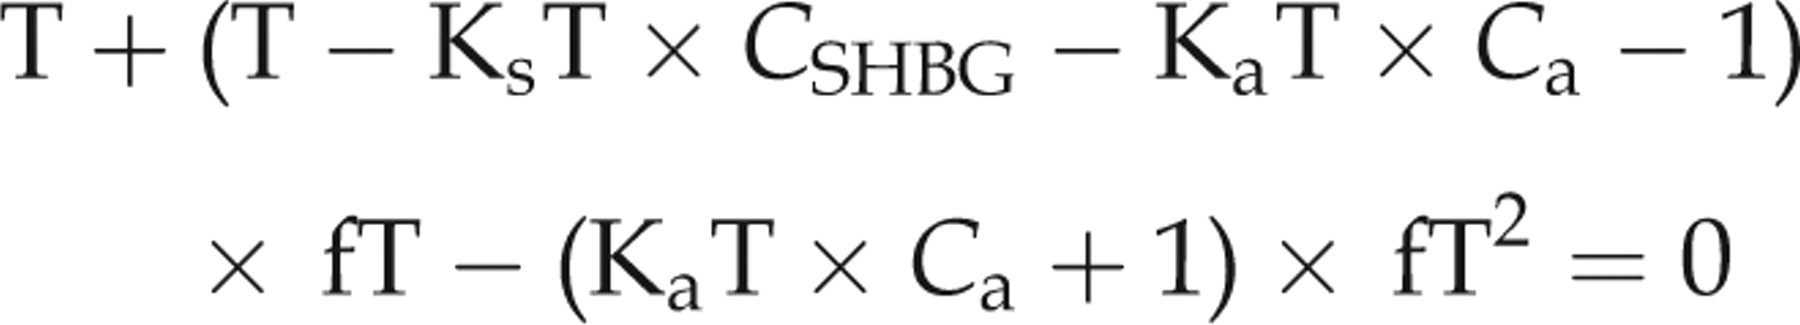
The single equation methods can be calculated analytically using the quadratic formula. We solved for unknown values in the two and three equation methods using the optimization package ‘optim’ macro in R (The R Foundation for Statistical Computing, Vienna, Austria).
To validate our findings, we compared calculated serum non-SHBG bound E2 and T with assay measured results. We used calculated fT, calculated fE2 and assay measured C a to estimate the amount of serum non-SHBG bound E2 and the amount of non-SHBG bound T with the following set of equations: non-SHBG bound E2 in mol/L is KaE2 × C a × fE2 + fE2, and non-SHBG bound T in mol/L is KaT × C a × fT + fT. For ease of interpretation, we report these as ng/dL. We provide SI conversion factors in the tables.
We substituted the observed mean value of C a, 4.5 g/dL, for individuals with missing assay measured albumin levels. The observed mean was the same for boys and girls.
We examined Bland–Altman
15
plots to investigate agreement between calculated and observed values. For the y-axis of the Bland–Altman plots, we plotted the proportion of the difference with respect to the average of the two values. Negative proportions indicate that calculated values were larger than assay measured values. For example, for the Bland–Altman plots of non-SHBG bound hormones, the y-axis consists of the points created by the following formula:
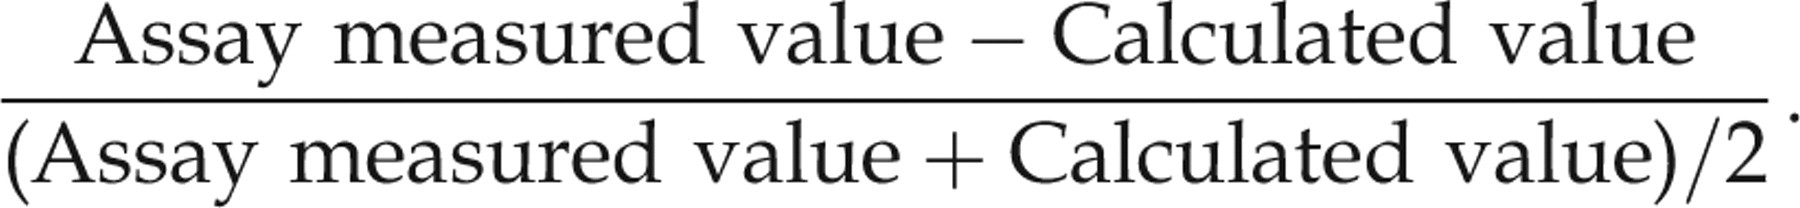
We report the quartiles of these proportional differences in the tables.
We used simple linear regressions fit on the data used to generate the Bland–Altman plots to estimate the relationship of the calculated with assay measured values. To more evenly spread the data, we depict the x-axis on the log scale in the Bland–Altman plots. However, we did not use log transformations for the regression analyses. We examined multiple linear regressions in which we included the average of calculated and assay measured hormone values, age and the interaction between age and average values to investigate if the relationship between assay measured and calculated values differed by age. We also examined regressions in which we included average and average squared to test for non-linear trends. We estimated all regressions using generalized estimating equations (GEE) assuming unstructured correlation matrices and robust standard errors to account for the correlation of multiple measurements within the same child. 16
As a sensitivity analysis to the robustness of our results, we compared the GEE-estimated simple linear regressions with Deming 17 regressions of the observed regressed on the calculated values. The Deming regressions consider both model response and covariate to be measured with error, but do not account for the correlation of measurements over time. We assumed equal measurement error variances for the Deming regressions since we did not have to duplicate measurements to estimate the variances. We estimated all regressions using the ‘xtgee’ and ‘deming’ commands in STATA version 10 (StataCorp, College Station, TX, USA).
To convert E2 from ng/dL to pmol/L, multiply by 36.76. To convert T in ng/dL to pmol/L, multiply by 34.72.
Results
E2 in girls
There were 301 girls enrolled in DISC. Of these, 291 girls had sufficient data to compare assay measured non-SHBG bound E2 with calculated values in this analysis, with an average of 3.4 measurements per girl between the first and last assessment of E2. Of the 987 observations used to compare calculated with assay measured values, 568 had missing C a measurements replaced with the observed mean of 4.5 g/dL (standard deviation [SD] 0.2). In analyses, 97 (9.8%) of the total E2 measurements and 55 (5.7%) of the total T measurements that were below the limit of detection were set to the lower limit (0.5 and 3.0 ng/dL, respectively).
The mean age of the girls at the first measurement of E2 was 10.3 (SD 0.6, range 9.1–11.8 y), while the mean age of the girls at the last measurement of E2 was 16.7 (SD 0.9, range 14.6–19.1 y). Over the course of the study, the great majority of girls had assay measured E2 in the measurable range of the assays employed. The average total value of assay measured E2 in girls over the course of the study was 6.13 ng/dL (SD = 6.66, range = 0.50–52.0). The average amount of assay measured non-SHBG bound E2 was 3.17 ng/dL (SD = 3.59, range 0.1–29.4).
In Figure 1a we compare fE2 calculated using the single equation and two equation methods. We see that the proportional discrepancies between the two methods are very small (a maximum of 0.01 ng/dL when the average of the two values is equal to 0.86, and a relative difference of less than 2.5% overall). The reason that the estimates are close is that the denominators in the fractions of the two equation method are both close to 1, while fE2 2 and fE2 × E2 are both small relative to the other terms in the single equation formula. This results in the two methods producing almost identical estimates. Because the two methods produced calculations that were so close, we used the single equation method to calculate non-SHBG bound E2 since this method is easier for researchers to implement. The rest of the paper describes estimates obtained using the single equation method. Using the single equation method, the average percentage of calculated fE2 was 1.94% (SD 0.41%, range 0.78–3.11%).
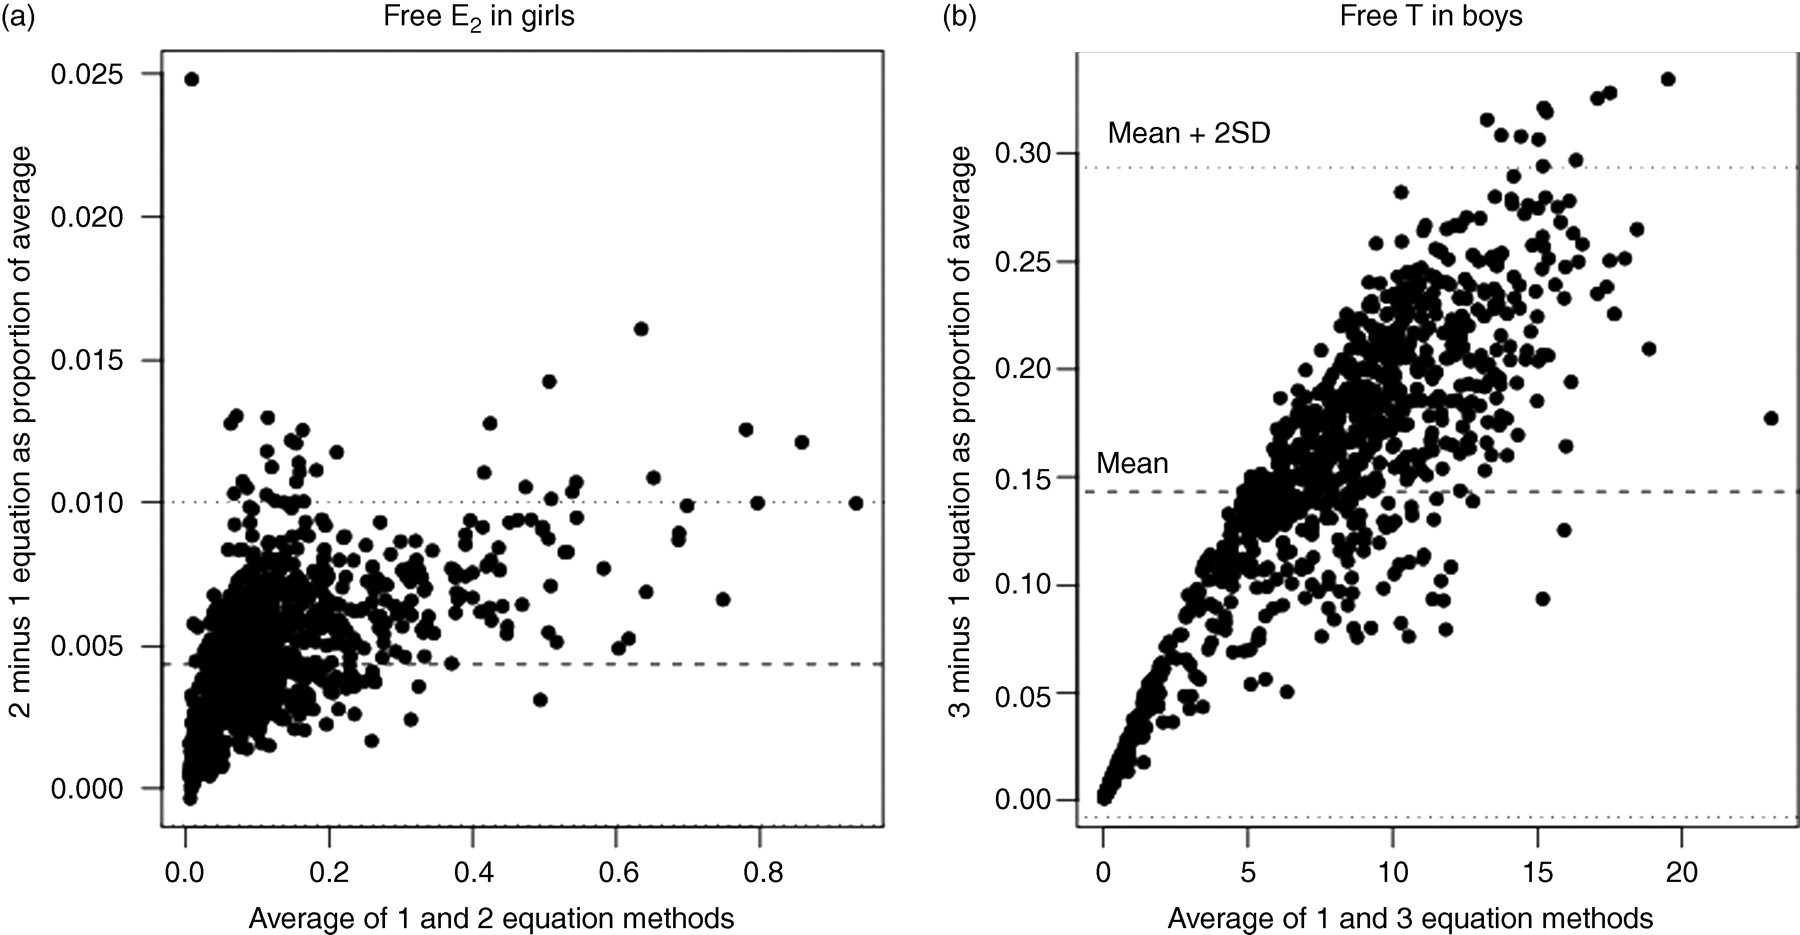
Plots comparing fE2 and fT (ng/dL) calculated using multiequation and single equation methods. The y-axis depicts the proportional difference in values with respect to the average. Note that the range of the y-axis is much larger for fT than for fE2.fT, free testosterone; fE2, free oestradiol
In Figure 2, we present the Bland–Altman 15 plots of the proportional difference between assay measured and calculated non-SHBG bound E2. In Figures 2a and b, we present the data from those with observed albumin so that we can compare the figures when using observed albumin and when substituting the mean albumin value for the observed value. The general spread of the figure does not change much when using observed values and mean substitution. In Figure 2c, we present a plot with all of the data. In general, the absolute difference between observed and calculated values was less than 4 ng/dL in Figure 2c. The average bias was −11.7% (indicating general overestimation of assay measured values by calculated values).
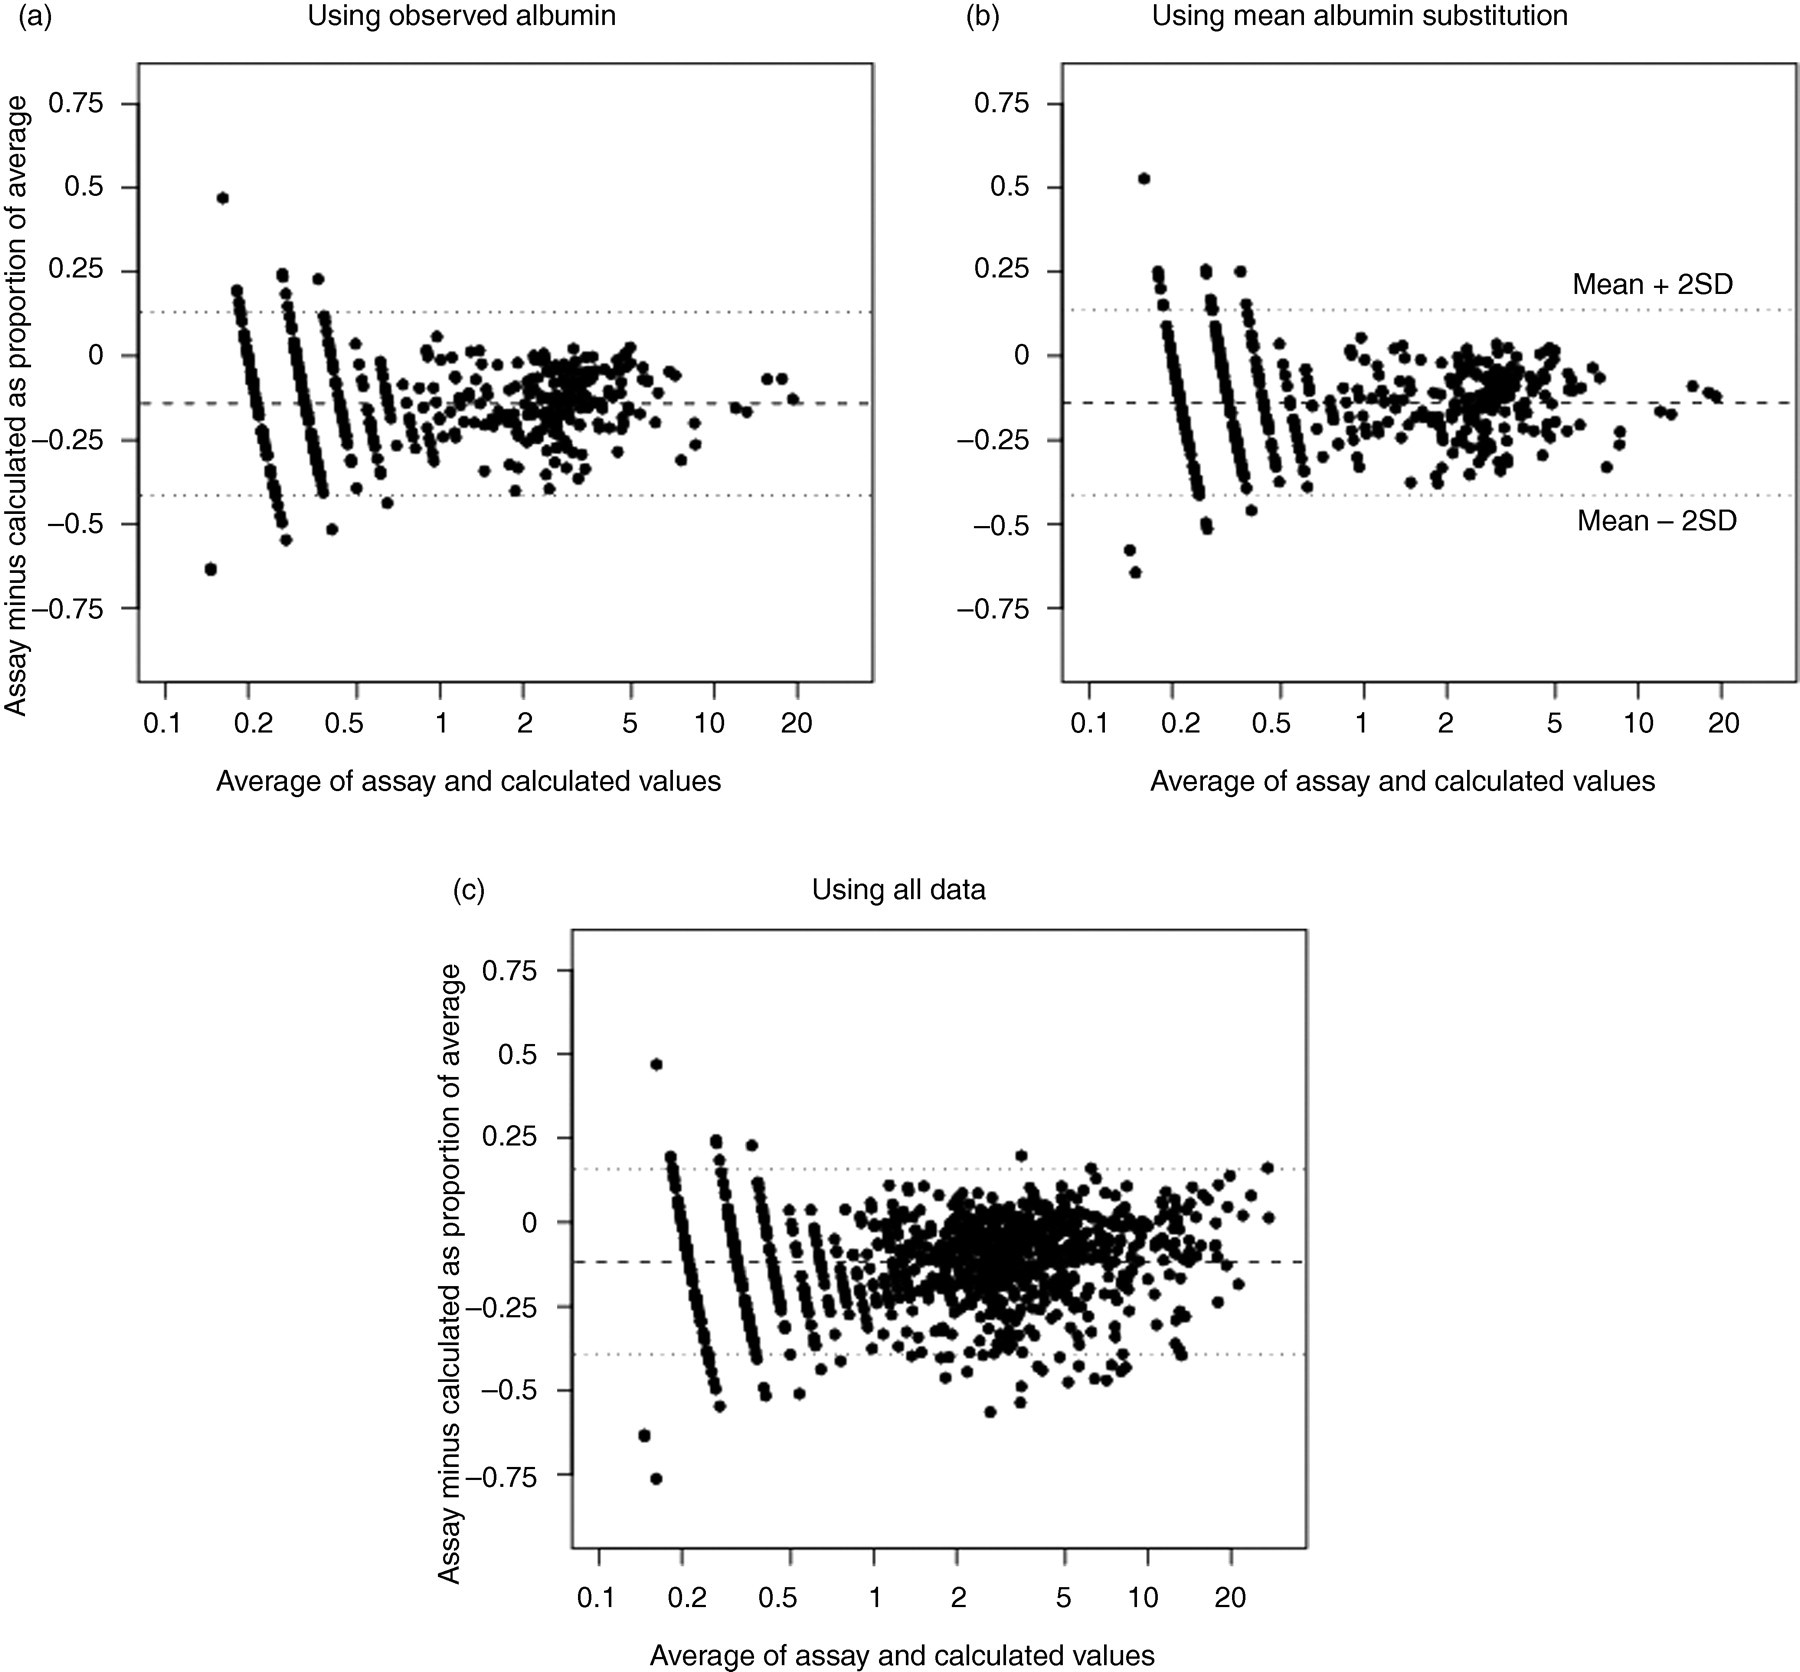
Plots comparing observed and calculated non-SHBG bound E2 in girls. The y-axis depicts the proportional difference in values with respect to the average. The dashed line indicates the mean proportional difference while the dotted lines indicate 2 standard deviations above and below the mean. Observed albumin data were used in (a), while the mean albumin values were substituted for observed values in (b). All of the data were used in (c). SHBG, sex hormone-binding globulin
In Table 1, the last column suggests that in percentage terms, the differences between assay measured and calculated values were sizable. However, many of the large percentage differences occurred with very low levels of non-SHBG bound E2. For example, the largest percentage difference occurred when observed non-SHBG bound E2 was equal to 0.10 ng/dL and calculated non-SHBG bound E2 was equal to 0.22 ng/dL. While large in percentage terms, it is unclear whether the absolute magnitude of such a difference would be clinically relevant.
Estimates of total E2 and non-SHBG bound E2 (ng/dL) among girls and changes in girls with complete data
SHBG, sex hormone-binding globulin; E2, oestradiol; SD, standard deviation
To convert to pmol/L, multiply by 36.76
The intercept and slope of the GEE-estimated simple linear regression of the proportional difference of assay measured minus calculated non-SHBG bound E2 regressed on the average of the two values (Figure 2c) were −0.13 (95% confidence interval [CI], −0.14 to −0.12) and 0.005 (95% CI 0.003–0.007). An intercept and slope equal to zero would indicate perfect prediction on average of assay measured non-SHBG bound E2 from calculated non-SHBG bound E2. In Table 1, we see that assay measured non-SHBG bound E2 was slightly less on average than calculated non-SHBG bound E2. Hence, there is evidence of overestimation on average of assay measured non-SHBG bound E2 when using the calculated values, but the overestimation decreases as hormone levels increase. The correlation of the proportional differences in measurements within individuals over time was not of consistent magnitude with the correlations between time points ranging from −0.08 to 0.44, as estimated by the working correlation matrix from the GEE fit regression.
The intercept and slope from a GEE fit model estimated only using observations with assay measured albumin levels (Figure 2a) were −0.15 (95% CI −0.16 to −0.13) and 0.003 (95% CI −0.002 to 0.007), respectively. A quadratic term added to the model was not statistically significant (coefficient = 0.00005 for quadratic term, P = 0.705), suggesting a simple linear relationship. The intercept and slope from a simple Deming regression of observed values regressed on calculated values were −0.16 (95% CI −0.25 to −0.07) and 0.96 (95% CI 0.92–0.99).
The interaction term in the multiple linear regression on the Bland–Altman data assessing whether the predictive value of calculated non-SHBG bound E2 differed by age was statistically significant (coefficient = −0.002, P = 0.010). The main effects term for the average effect in the interaction model was 0.032 (P = 0.002). This suggests that the relationship of expected bias with level of non-SHBG bound E2 was decreased for older girls: effect of average on proportional difference = (0.032–0.002 × age) ×average.
T in boys
There were 362 boys enrolled in DISC. Of these, 346 had sufficient data to compare assay measured non-SHBG bound T with calculated values, with an average of 2.7 measurements per boy between the first and last assessment of T. Of the 937 observations used to compare calculated with assay measured values, 677 had missing C a measurements replaced with the observed mean of 4.5 g/dL (SD 0.2). In analyses, 168 (17.9%) of the total E2 measurements and 3 (0.3%) of the total T measurements that were below the limit of detection were set to the lower limit (0.5 and 3.0 ng/dL, respectively).
The mean age of the boys at the first visit for which we had complete data was 13.0 (SD 0.7, range 11.7–15.0 y), while the mean age of the boys at the last measurement of T was 17.3 (SD 0.8, range 15.6–19.4 y). The average value of assay measured total T in boys over the course of the study was 493 ng/dL (SD = 258, range = 3–1186). The average amount of assay measured non-SHBG bound T was 237 ng/dL (SD = 151, range 0.3–795).
In Figure 1b we present fT calculated with the three equation method compared with the single equation method. We see that the single equation method significantly underestimates fT compared with the three equation method. The mean fT in boys using the single equation method was 6.8 compared with 8.2 using the three equation method. Because of the discrepancy, we used the three equation method for inferences below. The average percentage of calculated fT using the three equation method was 1.56% (SD 0.53%, range 0.34–2.96%).
In Figure 3 we present the Bland–Altman 15 plots of the proportional difference between assay measured and calculated non-SHBG bound T. As with girls, the general spread of the data was similar when comparing proportional differences derived using observed albumin compared with mean substitution of the same observed values (Figures 3a and b). In Figure 3c, we present the proportional differences between observed and calculated values for the entire sample. The proportional differences between observed and calculated values for many observations were sizable. The average bias was −2.6% (indicating general overestimation of assay measured values by calculated values).
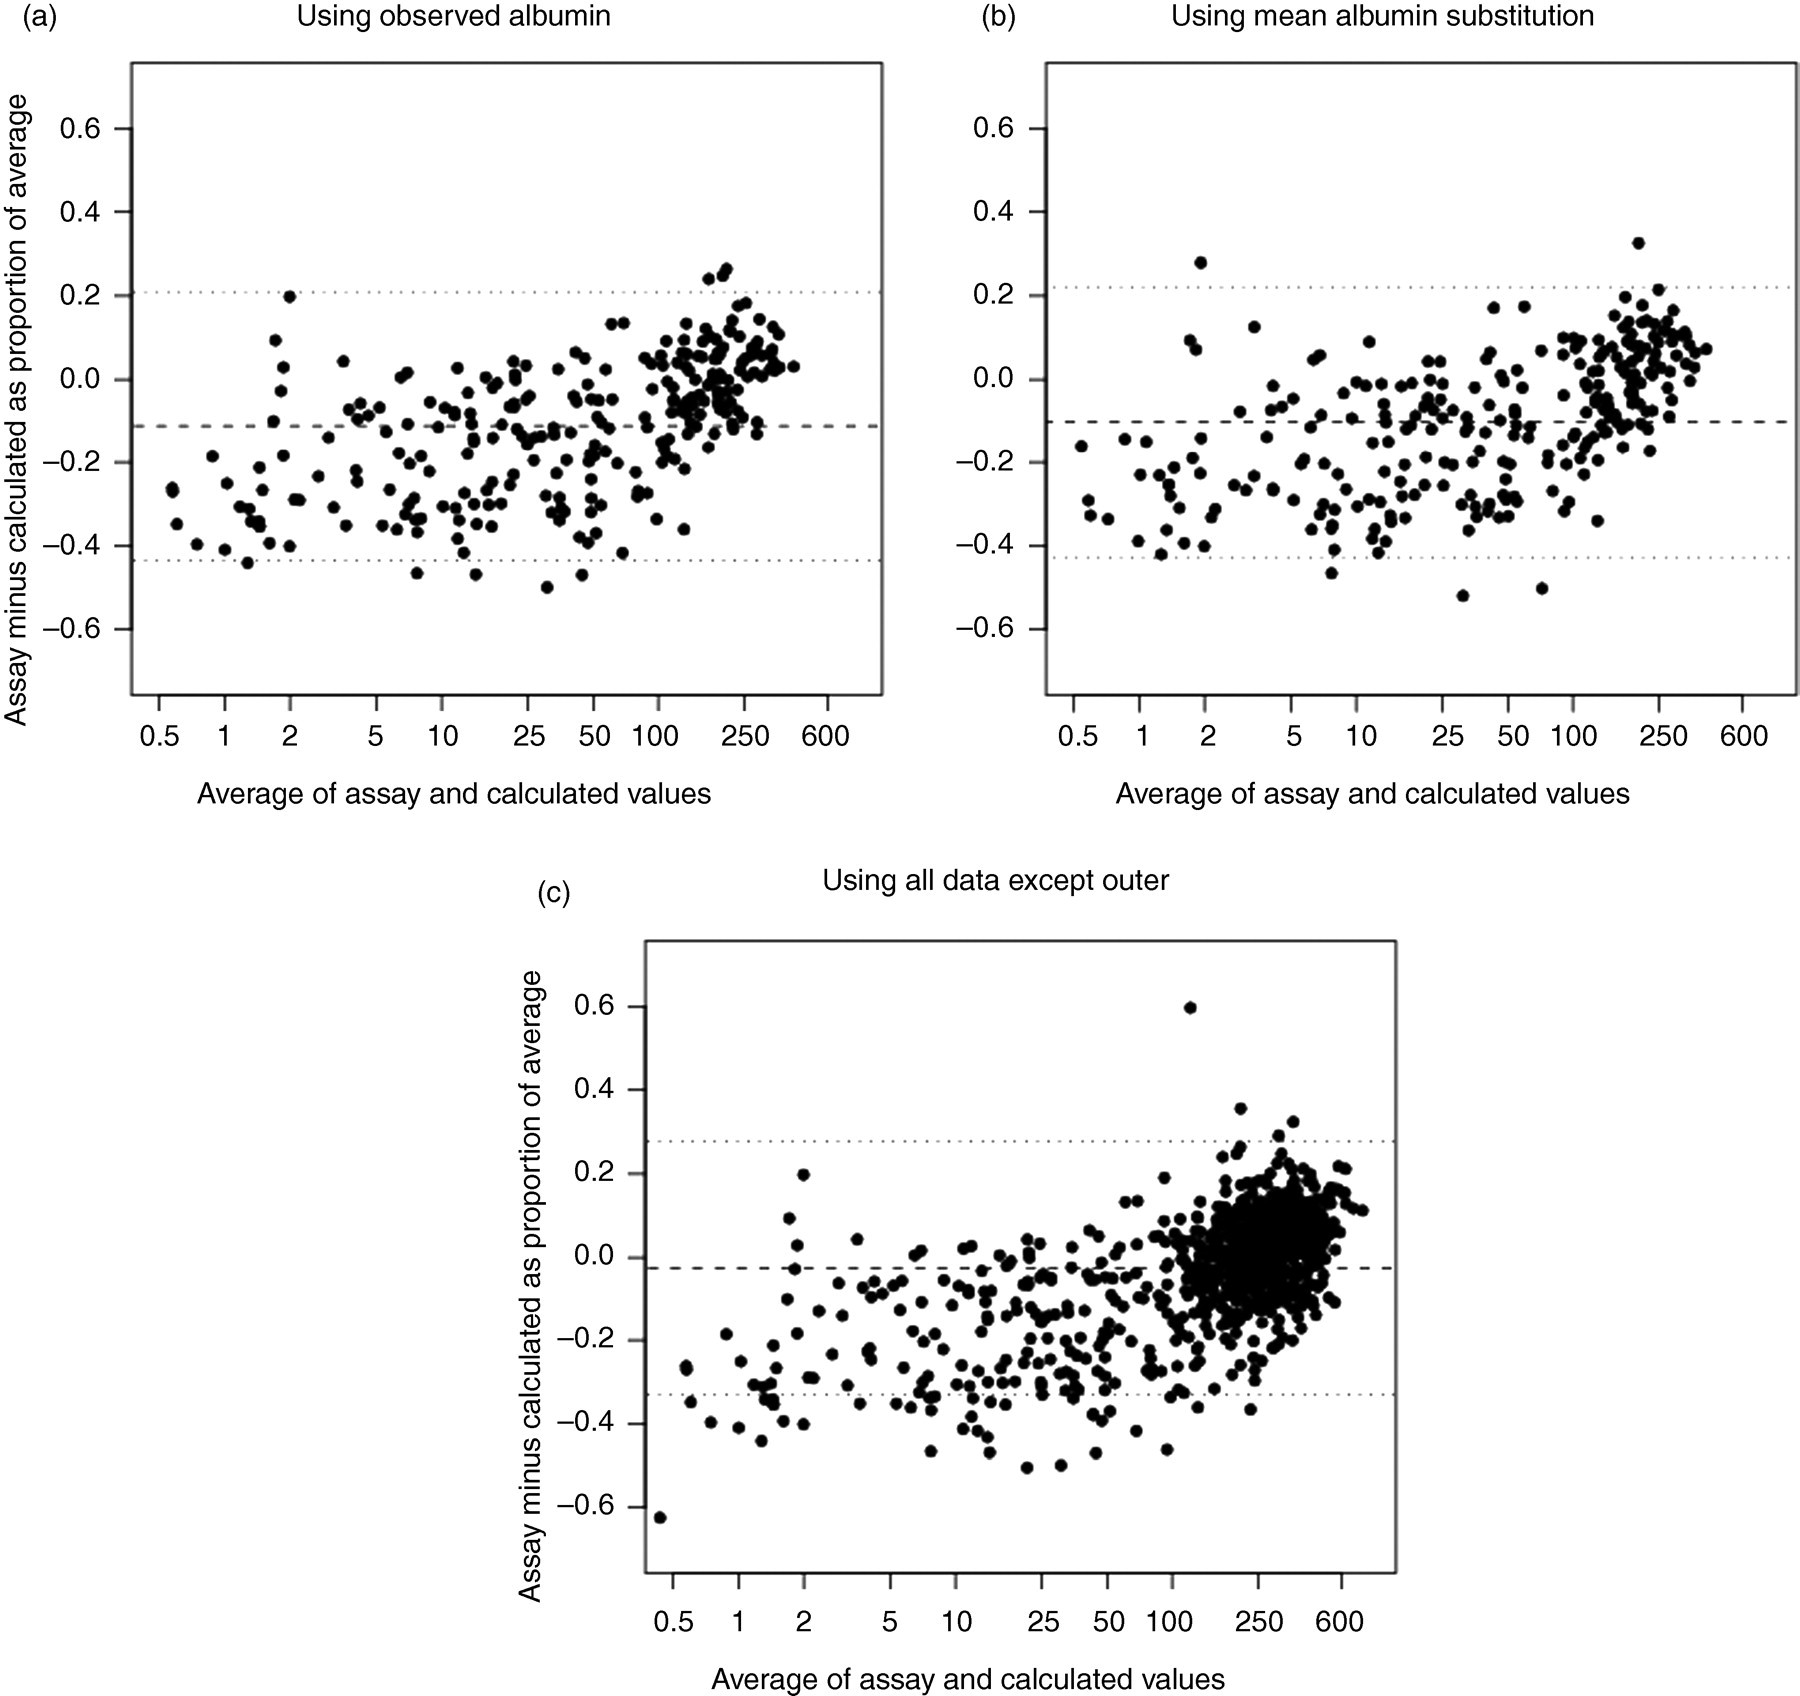
Plots comparing observed and calculated non-SHBG bound T in boys. The y-axis depicts the proportional difference in values with respect to the average. The dashed line indicates the mean proportional difference while the dotted lines indicate 2 standard deviations above and below the mean. Observed albumin data were used in (a), while the mean albumin values were substituted for the observed values in (b). All of the data were used in (c). One outlier in (c) was excluded (difference = −1.64). SHBG, sex hormone-binding globulin; T, testosterone
The intercept and slope of the GEE-estimated simple linear regression of the proportional difference in assay measured non-SHBG bound T minus calculated non-SHBG bound T regressed on the average of the two values (Figure 3c) were −0.16 (−0.17 to −0.14) and 0.0006 (95% CI 0.0005–0.0006), respectively. Hence, there is evidence of average overestimation of assay measured non-SHBG bound T from the calculated values when levels are low, but the overestimation decreases as hormone levels increase. The correlation of the proportional differences in measurements within individuals over time was inconsistent, with the correlations ranging from 0.02 to 0.35, as estimated by the working correlation matrix from the GEE fit regression. The GEE fit intercept and slope from a model estimated only using observations with assay measured albumin levels (Figure 3a) were −0.20 (95% CI −0.23 to −0.18) and 0.0009 (95% CI 0.0008–0.0011). A quadratic term of the average added to the model was statistically significant (coefficient = −0.000001 for quadratic term, P < 0.001), suggesting a non-linear relationship. The intercept and slope from a simple Deming regression of observed values regressed on calculated values were −13.2 (95% CI −16.0 to −10.4) and 1.08 (95% CI 1.07–1.10), respectively.
There was one outlying observation excluded from Figure 3 for ease of presentation in which the calculated non-SHBG bound T is quite different from the assay measured non-SHBG bound T. This represented data from one boy whose assay measured total T level was 901 ng/dL and calculated non-SHBG bound T was 395 (percentage difference compared with average of two of −164%), but whose assay measured non-SHBG bound T was 39 ng/dL. This contrasts with mean assay measured total T of 210 ng/dL (range 93–410) among the 14 other boys with assay measured non-SHBG bound T between 36 and 44 ng/dL, inclusive. The inconsistency suggests that there might have been a measurement or recording error in this boy's assay measured non-SHBG bound T. The coefficients from a GEE-estimated simple linear regression without this boy's data were the same as those reported above.
In Table 2, we present means of assay measured and calculated non-SHBG bound T at each visit. Except for the three-year visit, all of the assay measured values were higher on average. The percentage discrepancies were large, particularly when the average of calculated and assay measured non-SHBG bound T was small.
Estimates of total T and non-SHBG bound T (ng/dL) among boys and changes in boys with complete data
SHBG, sex hormone-binding globulin; T, testosterone; SD, standard deviation
Non-SHBG bound testosterone was not measured on boys at the one-year visit. To convert to pmol/L, multiply by 34.72
The interaction term in the multiple linear regression on the Bland–Altman data assessing whether the predictive value of calculated non-SHBG bound T differed by age was statistically significant (coefficient = −0.0001, P < 0.001). The main effects term for the average effect in the interaction model was 0.003 (P < 0.001). This suggests that relationship of amount of bias with level of non-SHBG bound T was decreased for older boys: effect of average on proportional difference = (0.003–0.0001 × age) ×average.
Discussion
This is the first study to investigate the relationship of calculated non-SHBG bound E2 in girls and non-SHBG bound T in boys with assay measured values of the same hormones. While we have found good correlation of the measurements, as expected, there were some significant differences between measurements within individuals. Since calculated non-SHBG bound E2 and non-SHBG bound T were constructed using calculated fE2 and fT, it is likely that our findings are generalizable to fE2 and fT values. Although there were many large percentage differences between observed and calculated hormone values, many of the largest percentage discrepancies occurred at lower observed hormone levels. Hence, it is unclear whether the small absolute magnitudes of the differences would be clinically relevant even though the percentage differences are large.
Among the boys, there was one outlier in which the calculated non-SHBG bound T did a poor job of estimating the assay measured non-SHBG bound T. This might have been an assay measurement or reporting error since the assay measured non-SHBG bound T was so much smaller than the assay measured total T relative to other boys' measurements.
The Bland–Altman plots demonstrated that the individual differences between assay measured and calculated non-SHBG bound hormone levels were proportionally sizable. This suggests that using the calculated values might only be appropriate for research purposes in which population level inferences are more of interest than subject-specific inferences. The use of the calculated values would be inappropriate in clinical settings in which greater precision is required.
Our findings that there might be discrepancies between assay measured and calculated values of non-SHBG bound T are consistent with Sartorius and colleagues' 18 findings that there was some bias and variability between calculated and assay measured fT. However, Sartorius and colleagues 18 found that calculated values overestimated fT, while we found that calculated values underestimated non-SHBG bound T for larger assay measured levels.
A limitation of this work is that we did not have assay measurements of fT and fE2 in the children. Still, the per cent fT and fE2 values that we observed were consistent with what one might expect in children.
Also, our measurements of T and E2 were made using RIA while gas chromatography-MS coupled with gas chromatography (GC/MS) or high-pressure liquid chromatography (HPLC/MS) is currently the recommended method. In previous work, Dorgan et al. 11 used regression analysis to demonstrate that there was good agreement between T and E2 measured in children using the RIA used in this study and GC/MS. The accuracy of our RIA measurements contributed to the good agreement we observed between calculated and measured bioavailable E2 and T. Inaccurate measurement of any of the hormones used in the calculations would generally result in invalid estimates of the bioavailable fractions.
In conclusion, we have found average bias of −2.6% in calculations of non-SHBG bound T in boys and average bias of −11.7% of non-SHBG bound E2 in girls using total levels of hormones measured using RIA after extraction and chromatography. These findings provide some evidence that calculated free levels of T and E2 would have similar bias. Good correlation of RIA after extraction and chromatography with levels found using HPLC and mass spectrometry suggest that this technique will also provide similar calculated results. 19
DECLARATIONS