
Abstract
Background
To determine precisely the probability that a change between two glycated haemoglobin A1c (HbA1c) results is significant and that clinical actions may be required, the biological variation of HbA1c must be known. However, it has not been evaluated in a paediatric population. We therefore determined the long-term biological variation of HbA1c in a paediatric population and used it to generate a probability curve for significant changes between two consecutive HbA1c measurements.
Methods
A group of 24 boys and 14 girls with cystic fibrosis (CF) but without diabetes or impaired glucose tolerance has been selected. HbA1c has been measured at least five times over five consecutive years for all subjects. We have used the Fraser and Harris method to calculate within-subject biological variation (CVI), which allowed the determination of the probability that a change is significant between results.
Results
As within-subject variances are equivalent for girls and boys (P > 0.1), both genders were merged for biological variation analysis. The CVI calculated for HbA1c was 4.8% and the between-subject variation (CVG) was 12.8%. Then, a probability curve based on the CVI found was generated and showed that a change of 14% between two consecutive HbA1c results corresponding to a probability of 95% was significant.
Conclusions
We determined for the first time the biological variation of HbA1c in a paediatric population, which is higher than the ones found for adult populations. The probability curves generated from these data could be invaluable tools for clinicians to balance HbA1c results with other clinical parameters.
Introduction
Measurement of glycated haemoglobin A1c (HbA1c) has become essential for the monitoring of diabetic patients. HbA1c is an excellent long-term index since it reflects the mean glycaemia of the previous two months. 1 As HbA1c results orient the clinical management of the diabetic patient, an opportune evaluation of a significant change between two consecutive HbA1c measurements is highly relevant. The determination of a significant change between two consecutive results requests the evaluation of pre-analytical, analytical and biological variations. Pre-analytical variation can be minimized for HbA1c by appropriate conditions of sample collection and handling, 2 and analytical variation is easily evaluated from the in-house internal quality control. However, biological variations for HbA1c have been reported for adult subjects whereas it has not been evaluated in a paediatric population. It is noteworthy that many biological analytes fluctuate with age and hence, childhood and puberty are critical periods. 3 Consequently, the determination of long-term paediatric biological variation is of utmost importance to evaluate appropriately what is a significant change for HbA1c during the monitoring of a young diabetic patient.
Methods
For the estimation of HbA1c biological variation, a group of subjects with cystic fibrosis (CF) was chosen, but without diabetes mellitus or impaired glucose tolerance. HbA1c of these subjects has been measured at least five times over five consecutive years (2003–2007). These measurements have been performed using ion exchange high-performance liquid chromatography (HPLC)-based device (Tosoh 2.2, Tosoh Medics Inc, San Francisco, USA). The same apparatus has been used during this period, and precision and accuracy over the entire period of the study were determined by in-house controls and external quality assessment programmes. The CVA determined from our in-house control over a period of five years is 1.4% with a standard deviation (SD) of 0.8%, which indicates repeatable results. In addition, our participation to external quality assessment programmes (College of American Pathologist and Laboratoire de Santé Publique du Québec) showed that our measurements were within 4% of the target value over the entire period of five years. The target value corresponds to a consensus mean from National Glycohemoglobin Standardization Program (NGSP)-certified secondary laboratories using HPLC methods.
The biological variation, namely the within-subject biological variation (CVI) and the between-subject biological variation (CVG), were calculated according to Fraser and Harris using a nested analysis of variance. 4 Briefly, this procedure allows one to obtain the total within-subject variance (SI+A; including both within-subject and analytical variances) and the total between-subject variance (SG+A; including both between-subject and analytical variances). The total variances were then transformed into the corresponding coefficient of variation (using the respective grand mean) and the analytical variation (CVA) was subtracted from CVI+A or CVG+A to generate CVI and CVG, respectively. 3,4 This subtraction is allowed since it has been shown that the total variation (CVt) is expressed by the following relation: CVt = (CVA 2 + CVI 2)1/2.
Taking into account the CVI's determined in our paediatric population and a CVA of 1.4% (in-house controls), a graphic relating the change between two consecutive results to the probability that this change is significant was generated. The relation used to construct this figure is Z = change/21/2*(CVA 2 + CVI 2)1/2, where change is the percentage of difference from the first value of HbA1c. 3,4 The probability is obtained using statistical table of Z-score for two-tailed distributions. Bi-directional Z-score was used to determine whether a significant change in general takes place, whatever be the rise or fall between two consecutive HbA1c results.
Results
HbA1c means and absolute ranges (minimum and maximum values) of subjects are shown in Figure 1. The median age (range) of subjects at the end of the study was 14 years (5–18) and 14 years (8–18) for boys and girls, respectively. The mean was higher for girls (0.057) compared with boys (0.056) indicating normal HbA1c means for both genders. In fact, both gender HbA1c values exhibited a Gaussian distribution (see insets in Figure 1) as checked by Shapiro–Wilk's test, but a larger dispersion was observed for girls. However, as the CVI were equivalent for both genders (F-test; P > 0.1), boys and girls have been merged (38 subjects) for the calculation of the CVI and the CVG variations.
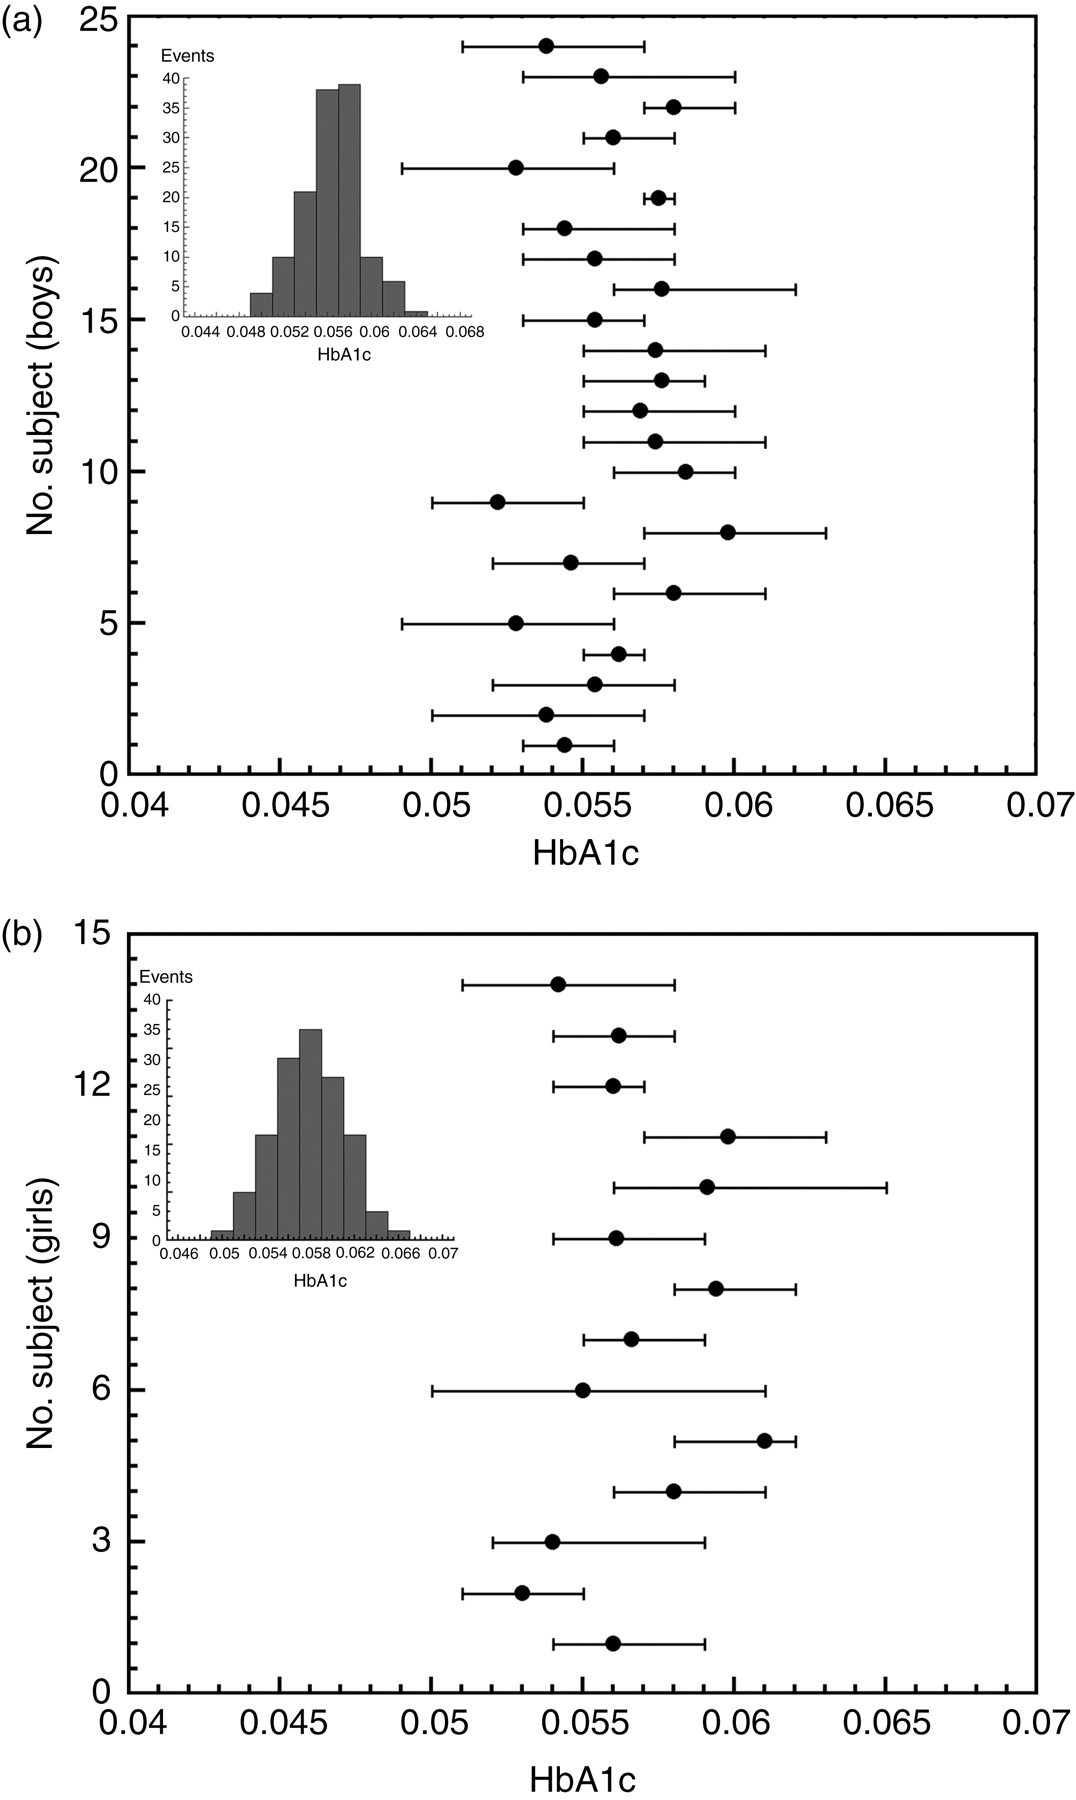
Mean values (dot) and absolutes range (bars) of glycated haemoglobin A1c (HbA1c) for the 24 boys (a) and the 14 girls (b) monitored during five years (at least one sample by year). The insets show the distribution of every HbA1c measurements carried out for all of the boys (a) and all of the girls (b)
The CVI and the CVG found were 4.8% and 12.8%, respectively. Taking into account the CVI determined in our paediatric population and a CVA of 1.4% (in-house controls), a graphic relating the change between two consecutive results to the probability that this change is significant was generated (Figure 2). As the relation between the probability and change between two consecutive results is not directly proportional, we can easily estimate a probability for any change between two measurements using this probability curve. As shown in Figure 2, a change of 5% between two consecutive results corresponds to a probability of 55
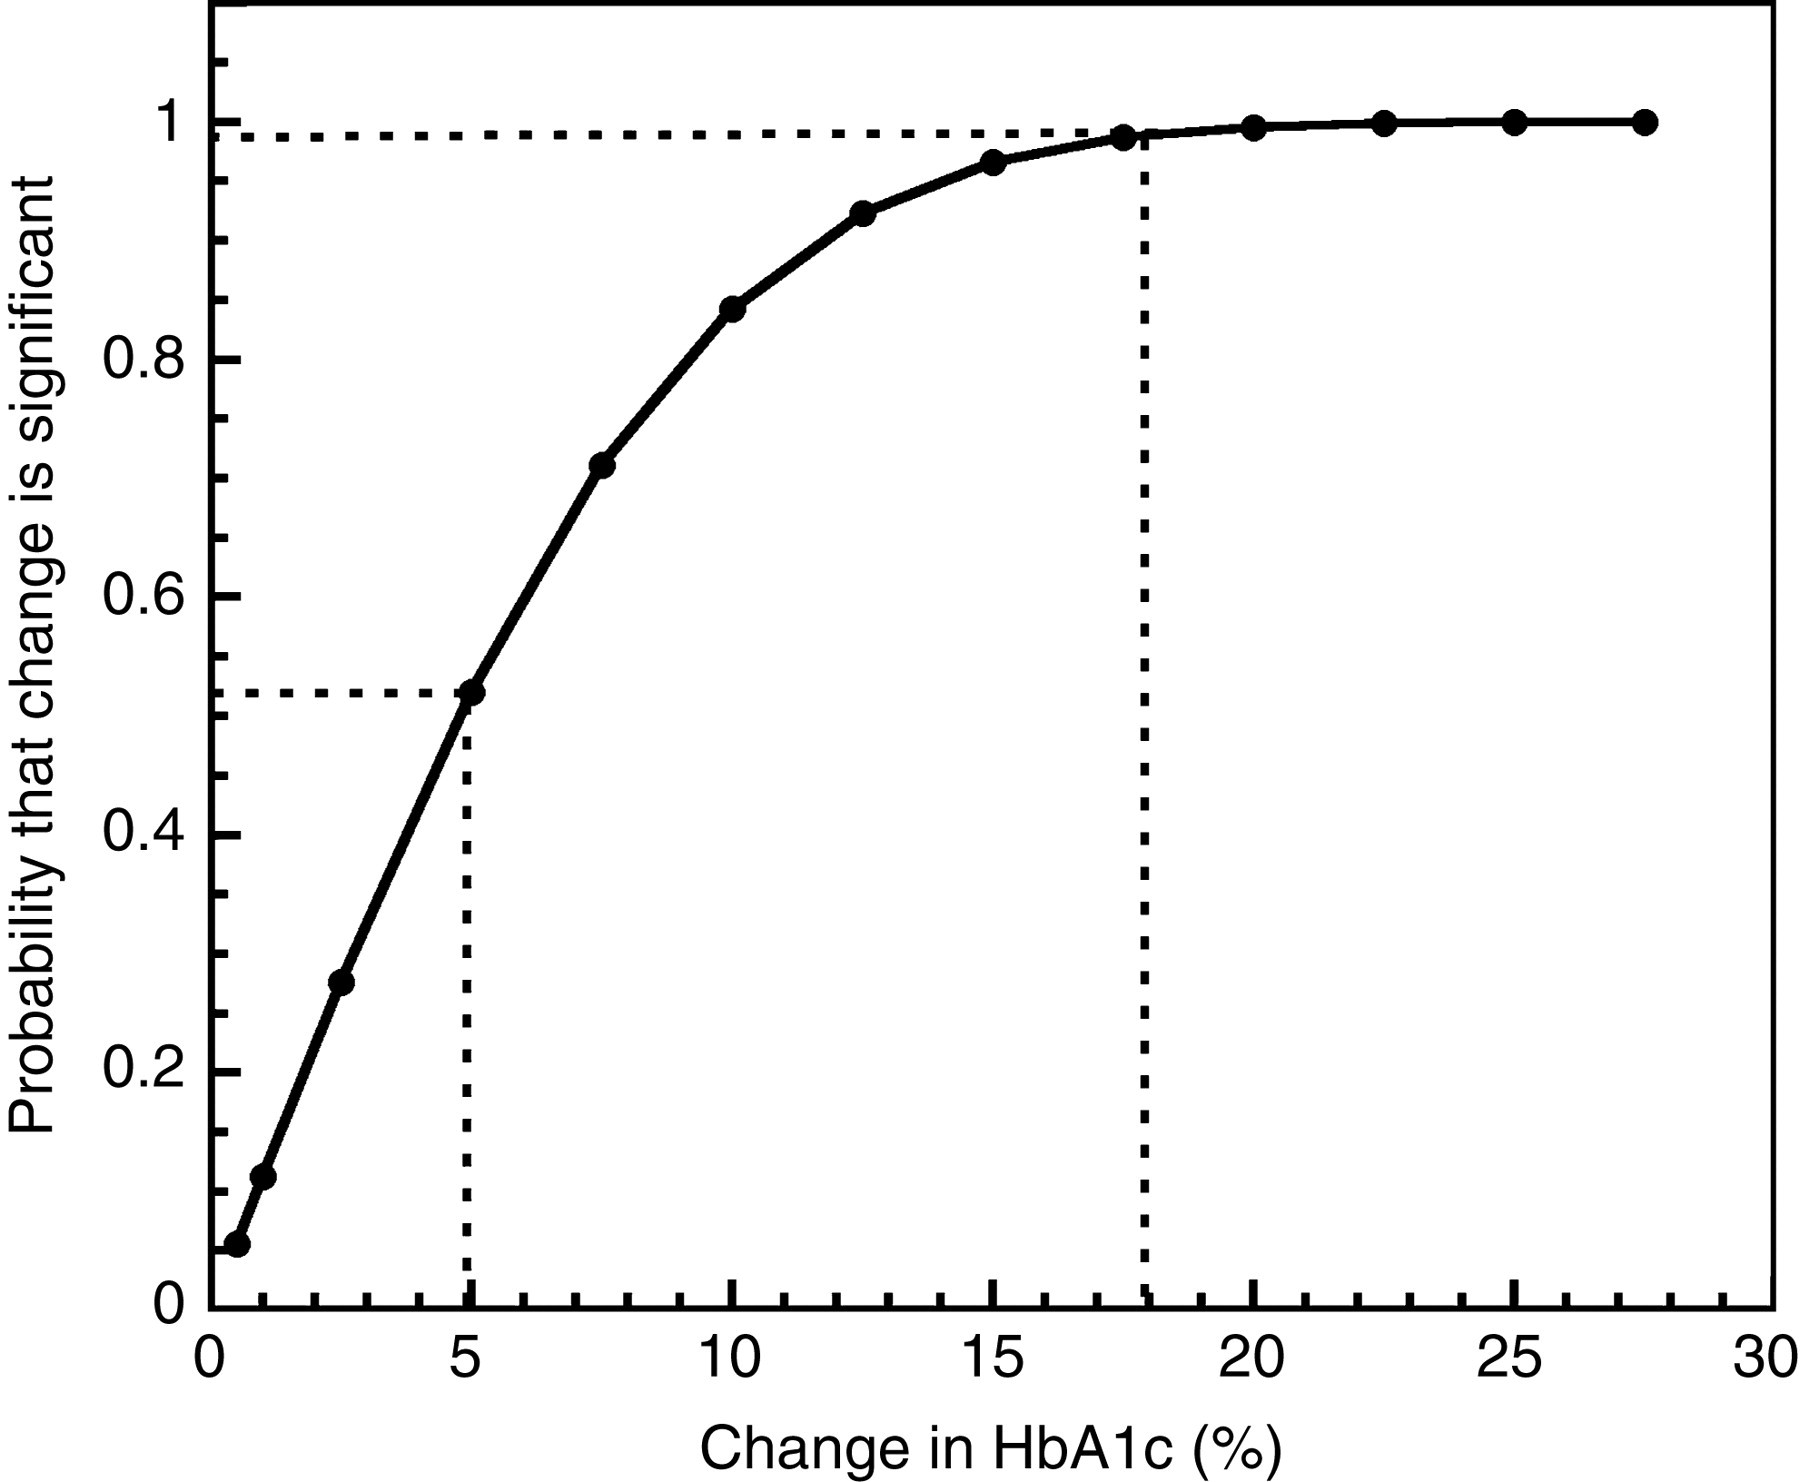
Probability curves relating change between two glycated haemoglobin A1c (HbA1c) results (change = (1st result–2nd result/1st result) × 100) to the probability that this change is significant in a paediatric population. The dotted line on the left links a change of 5% between two HbA1c results to its corresponding probability. The dotted line on the right is for a case at a change of 18%
Discussion
We determined for the first time the biological variation of HbA1c in a paediatric population. Although the population selected for this analysis is not composed of healthy children, as it should have ideally been, we are confident that our population of patients with CF is as close as possible to normal since their HbA1c level and oral glucose tolerance test are normal. Only data for two subjects have been removed from the 40 subjects initially chosen, because of abnormal oral glucose tolerance test, indicating that impaired glucose tolerance is seldom seen in young CF patients. These data corroborate with the work of Mansour 5 who has found only two patients with impaired glucose tolerance among 94 CF patients with normal HbA1c concentration. HbA1c means of each subject in our study was below the upper reference limit of 0.062 indicating a non-diabetic blood glucose homeostasis. Consequently, there is no reason to suspect that the average HbA1c concentrations or variations are different from the ones in a healthy paediatric population.
To our knowledge, there is no other published report of HbA1c biological variation in children, and there are few studies in adult populations (diabetics or healthy). Our CVI of 4.8% for paediatric population is higher than the CVI obtained in previous works for adult men without diabetes (1.7–1.9%) 6–8 and for premenopausal women (2.6%) 9 but lower than the ones in adults subjects with controlled or unstable diabetes (7.1–9.8%). 10,11 However, only the study of Garde et al. 9 reported long-term CVI of healthy patients. In fact, they studied the biological variation of HbA1c in premenopausal women during a period of one year, whereas the other studies have been carried out over a shorter period of time (≤3 months). This difference in study length may explain the higher HbA1c CVI obtained in the present study. In agreement with this, it has been shown that long-term CVI are different from short-term CVI, as presented for patients with diabetes mellitus or for healthy women. 9,10 In addition, we found a CVG of 12.8% (for boys and girls merged) or 8.6% for girls (when boys and girls are partioned) comparatively to a CVG of 3.3% in the work of Garde et al., 9 which indicates that homeostatic points of HbA1c are different between young girls and women.
Consequently, although there is no clear consensus in the literature on the ideal study timescale, it seems clear to us that, when determining biological variation, the study must be long enough to follow the natural cycle of variation of the analyte. Considering that the HbA1c measurement represents the glycaemic level of the last two months (related to the average lifespan of red blood cells), the homeostatic point of this analyte cannot be determined accurately over a short period of time. Although the present study is based over a period of five years, the CVI is not affected by variations or drift in the analytical method over time. Only one apparatus has been used during the period of 2002–2007 and the CVA determined from our in-house control and external quality assessment were constant and low. This CVA has been subtracted from the CVI+A (see method) to obtain the CVI.
According to the Canadian and American guidelines, 2,12 HbA1c should be measured routinely in all patients with diabetes mellitus to document their degree of glycaemic control. Consequently, the change between two consecutive measurements has a direct incidence on the management and follow-up of diabetic patients. Moreover, the follow-up of young subjects is complicated by the various changes (weight, physiology, etc.) taking place during childhood and adolescence. Consequently, the determination of specific CVI for paediatric population is of utmost importance.
The CVI found and the probability curves could be invaluable tools for clinicians to balance HbA1c results with other clinical parameters. In clinical practice, we would suggest the use of an enlarged version of Figure 2. The change between consecutive results can be calculated, as presented in the legend of Figure 2. A change of 14% between two consecutive results of HbA1c for a young subject (<18 years old) corresponds to a probability of 95% that this change is significant. Consequently, when the difference between two consecutive results is smaller than these numbers, the difference is not sufficient by itself to justify a change in a patient's treatment, but must be weighted with other parameters. A change between two consecutive results equal or higher than 14% indicates that other clinical parameters are less important in the decision to modify a treatment. Moreover, for a clinical chemist, the significant change between results (or reference change values) for HbA1c can be used to set objective criteria in delta-checking quality control techniques, as suggested recently by Fraser. 13
However, whatever be the probability obtained, this tool by itself is not intended to replace clinical judgement. In addition, before using the probability curves presented in Figure 2, the clinicians should ensure that their laboratory CVA for HbA1c is comparable to the one obtained in this study. This type of graphical representation is simple to use in a clinical setting and could help standardize the clinical actions regarding a paediatric patient's HbA1c results. It could also find applications for any other relevant biochemical variables.
DECLARATIONS