
Abstract
Background
Serum fetuin-A has been shown to be a strong risk marker for myocardial infarction/stroke in the general population, and has been associated with vascular calcifications in patients with chronic kidney disease. Although these issues are worthy of being addressed in children and adolescents as well, adequate age- and gender-related reference values are missing.
Method
Within a healthy paediatric population (n = 246), fetuin-A serum concentrations were determined (ELISA kit; Epitope Diagnostics, San Diego, CA, USA) essentially as described by the manufacturer. At the same time, serum protein and serum albumin were measured with established procedures (Beckman Coulter Inc., Krefeld, Germany). Subjects were stratified according to age (<1 yr [n = 25], ≥1 and <6 yr [n = 65], ≥6 and <12 yr [n = 66], ≥12 yr and <16 [n = 45] and ≥16 yr [n = 45]), and both genders were equally distributed within each age cohort.
Results
Within each age cohort, fetuin-A serum concentrations were normally distributed, independent of age and gender and the respective reference range (mean ± 1.96 SD) is 0.22–0.70 g/L (0.46 ± 0.24 g/L).
Conclusion
Fetuin-A serum concentrations are independent of age and gender in a healthy paediatric population and are well comparable with those determined in adults with the same assay.
Background
Serum protein fetuin-A (also known as α2-Heremans–Schmidt glycoprotein) has long been known as a negative acute phase reactant. 1 It has been considered as a chaperon for basic calcium phosphates and as such being responsible for the prevention of vascular calcification. 2 Large population and registry-based studies with adults identified elevated serum concentrations of fetuin-A as a risk marker for diabetes, metabolic syndrome and cardiovascular disease, e.g. myocardial infarction and stroke. 3–5 In contrast, reduced fetuin-A serum concentrations have been implicated as a causative factor for vascular calcification in adults and paediatric patients with chronic kidney disease (CKD). 6,7 However, the interpretation of fetuin-A serum concentration in children and adolescents is hampered by the lack of adequate paediatric reference intervals.
Patients and methods
We recruited a cohort of 246 healthy Caucasian children and adolescents (age range 9 d to 18yr). Subjects were initially stratified to either one of five age cohorts, i.e. <1 yr (n = 25), ≥1 and <6 yr (n = 65), ≥6 and <12 yr (n = 66), ≥12 and <16 yr (n = 45) and ≥16 yr (n = 45), and both genders were equally distributed. With this approach, the entire age range was divided into five comparable intervals, which we expected to be sufficiently narrow to discover any relationship between age and serum fetuin-A concentration. However, as children grow fastest during the first year of life, this group was handled separately. Height and body mass for all participants were recorded and the LMS method introduced by Cole 8 with L representing a Box Cox power and M and S representing the age-related median and coefficient of variation was used to calculate individual standard deviation scores of the body mass index (BMI-SDS). 9 Children with acute infections, elevated serum concentration of the C-reactive protein (CrP, ≥5 mg/L) or creatinine (≥2 SD) at the time of enrolment as well as those with metabolic disorders, severe dystrophy (BMI-SDS <− 2 SDS) or obesity (BMI-SDS >+ 2 SDS), chronic inflammatory diseases and renal or hepatic disease were excluded. The study was approved by the Hospital Ethics Committee (II HV04/2006), and informed consent was obtained from parents and/or patients, if appropriate.
Blood was taken in supine position and collected in a plastic serum separator tube (Sarstedt, Nümbrecht, Germany). The samples were immediately transferred to the laboratory, allowed to clot at room temperature for approximately 20 min and centrifuged (2000
Results and discussion
For fetuin-A, the gender-specific reference intervals per age group and for the complete study group are shown in Figure 1. Taken together, the reference interval (mean ± 1.96 SD) for fetuin-A is 0.22–0.70 g/L (0.46 ± 0.24 g/L). The fetuin-A serum concentrations were in the same order of magnitude as those determined with the same assay (i.e. the one developed by Epitope Diagnostics) in adults. 10 In-line with a previous report, no gender-specific differences are detectable (independent t-test; P > 0.05). 7 Furthermore, within this healthy population of normal-weight children and adolescents, no association between fetuin-A serum concentration and BMI-SDS was seen (r = 0.02; P = 0.792). The fetuin-A serum concentrations were normally distributed and fetuin-A serum concentrations are independent from age (one-way analysis of variance, F test, P = 0.300). In contrast, Shroff et al. 7 observed a significant age-related increase of fetuin-A serum concentrations. In both studies, the same ELISA kit was used and the fetuin-A serum concentrations (mean ± SD) are quite similar (0.46 ± 0.12 versus 0.41 ± 0.13 g/L). The different results with respect to the effect of age on fetuin-A serum concentrations might be due to a rather low sample number and skewed age distribution in the Shroff study. The latter notion is due to the rather low number of samples per year of age in the lower age range, i.e. the interval from 5 to 12 yr of age and a comparably high number of samples related to the upper age interval, i.e. the interval between 14 and 17 yr of age. The current notion that an elevated fetuin-A serum concentration is strongly associated with the risk of type 2 diabetes mellitus and a predictor of cardiovascular disease 3–5 is based on large case-cohort studies. Although with such a design, the necessity to determine reference values is omitted; the results are hardly extendable to children and adolescents. However, an association between fetuin-A serum concentrations and BMI-SDS values has been noted in obese children, recently. 11 All subjects enrolled in the current study present with normal BMI-SDS and no association between BMI-SDS and fetuin-A values was seen. In conclusion, the reference values established within this study will help to evaluate the contribution of fetuin-A to the development of lifestyle associated and/or CKD-associated cardiovascular complications.
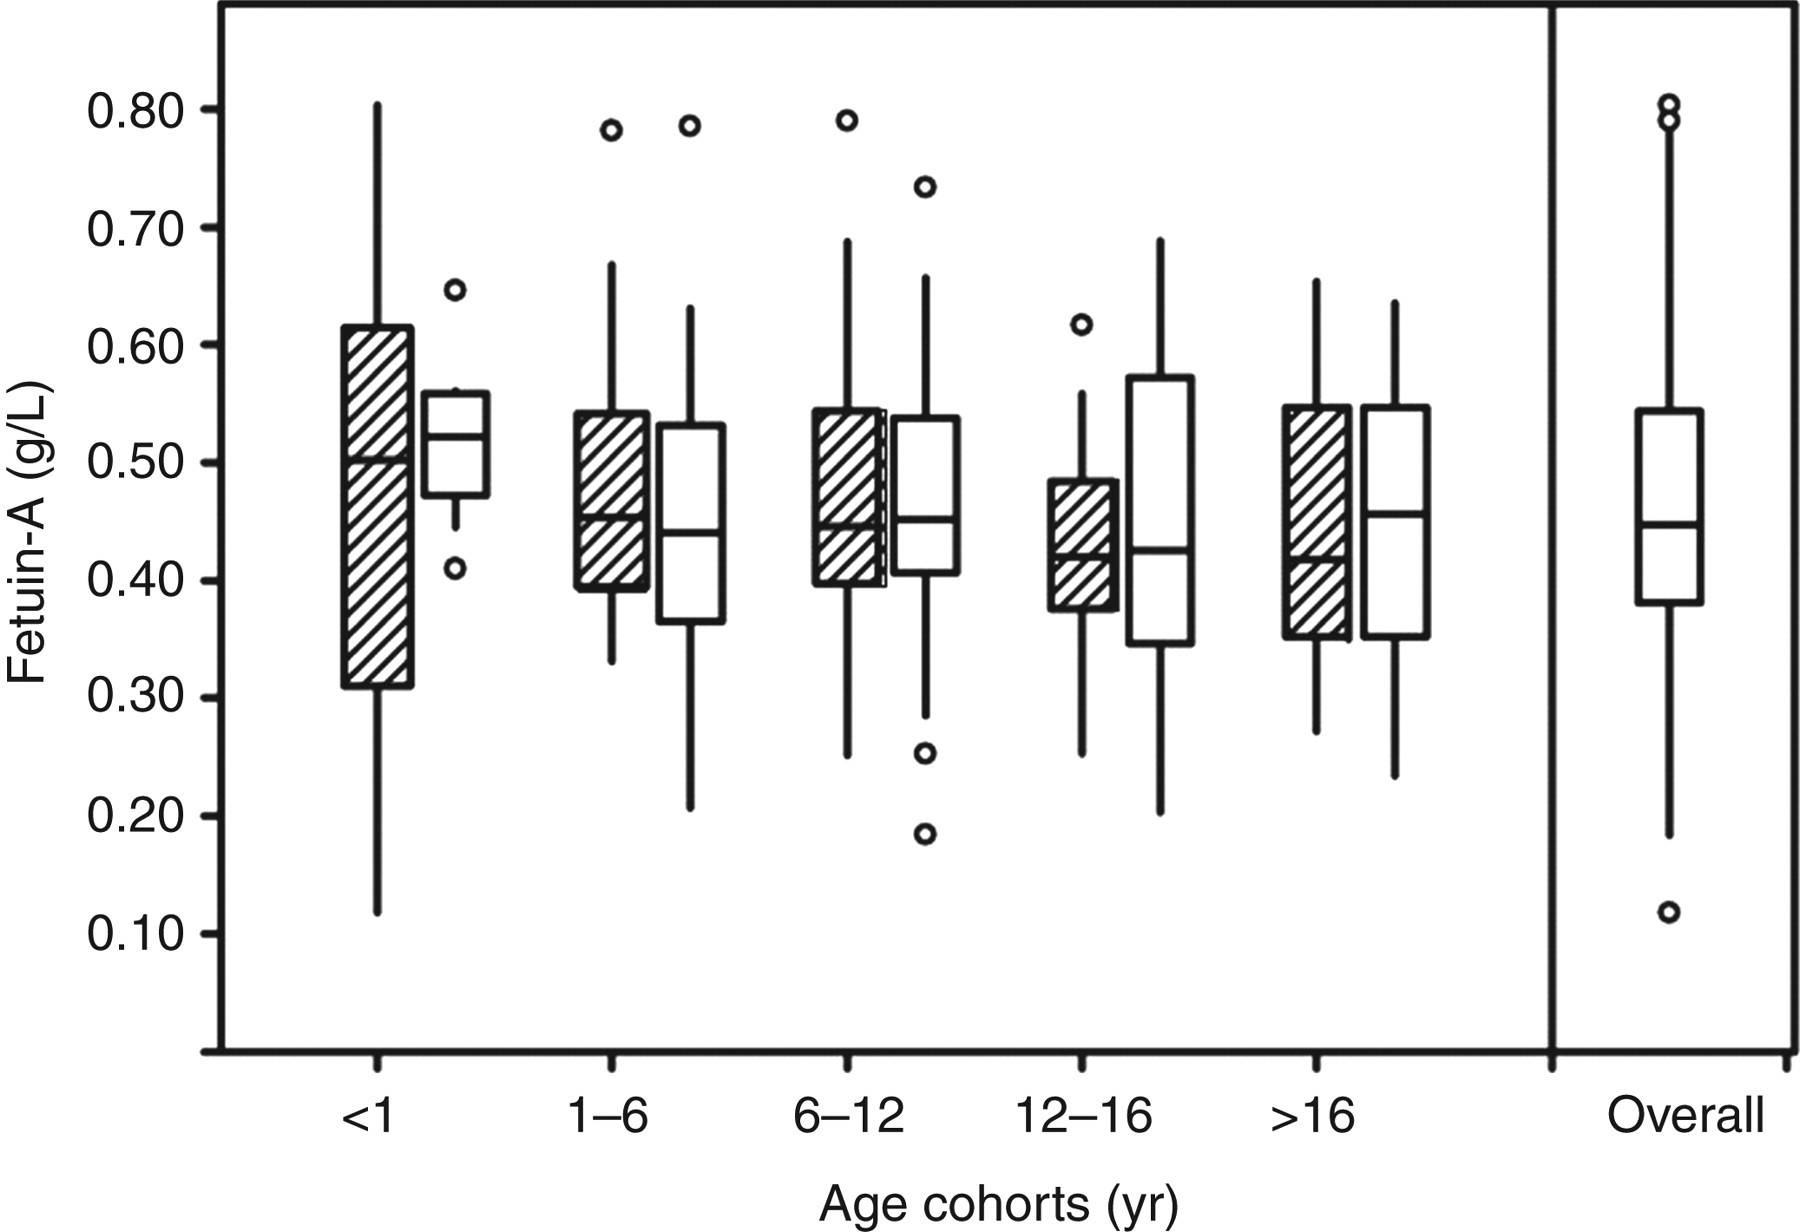
Age-related and overall distribution of serum fetuin-A concentrations. Data are given as boxplot indicating median, 25th and 75th percentile (bars); outliers are indicated by open circles; smallest and largest values that are not an outlier are marked by vertical tics ( □, women; fx1, men)
DECLARATIONS