
Abstract
Background
Measurement of 25-hydroxyvitamin D3 (25OHD3) and D2 (25OHD2) is challenging. Liquid chromatography-tandem mass spectrometry (LC-MS/MS) methods have been described but they are often complex and difficult to automate. We have developed a simplified procedure involving an automated solid-phase extraction (SPE).
Methods
Internal standard (hexadeuterated 25-hydroxyvitamin D3) was added to serum or plasma followed by protein precipitation with methanol. Following centrifugation, a robotic instrument (CTC PAL [Presearch] for ITSP™ SPE [MicroLiter Analytical Supplies, Inc]) performed a six-step SPE procedure and the purified samples were injected into the LC-MS/MS. Quantification of 25OHD3 and 25OHD2 was by electrospray ionization MS/MS in the multiple-reaction monitoring mode.
Results
The lower limit of quantitation was 4.0 nmol/L for 25OHD3 and 7.5 nmol/L for 25OHD2. Within- and between-assay precision was below 10% over the concentration range of 22.5–120 nmol/L for D3 and 17.5–70 nmol/L for D2 (n = 10). The calibration was linear up to 2500 nmol/L (r = 0.99). Recoveries ranged between 89% and 104% for both metabolites and no ion suppression was observed. The results obtained compared well (r = 0.96) with the IDS-OCTEIA 25-hydroxyvitamin D enzyme immunoassay for samples containing less than 125 nmol/L, at higher concentrations the immunodiagnostic system (IDS) method showed positive bias.
Conclusions
Our simplified sample preparation and automated SPE method is suitable for the measurement of 25OHD3 and D2 in a routine laboratory environment. The system can process up to 300 samples per day with no cumbersome solvent evaporation step and minimal operator intervention.
Introduction
Assessment of vitamin D status is important in the diagnosis of vitamin D deficiency and monitoring supplementation therapy. 1 Measurement of 25-hydroxyvitamin D (25OHD), the most abundant vitamin D metabolite in the circulation, is the single best indicator of nutritional vitamin D status. This is due to its long serum half-life (approximately 3 weeks) and because the hepatic 25-hydroxylation step is unregulated. Demand for the measurement of 25OHD has increased dramatically over the last few years with an annual test increase in the region of 80–90%. 2 This has created pressure for the diagnostic laboratory, especially as the analysis can be problematic. 3–8 Some of the problems are related to the extreme hydrophobic nature of the 25OHD molecule, which circulates avidly bound to a specific binding protein (85%) and also less strongly to albumin (15%) with only 0.03% free. 9,10 Furthermore, there are a number of different 25OHD metabolites making assay specificity an issue. 11 The two major metabolites are 25-hydroxyvitamin D3 (25OHD3) and 25-hydroxyvitamin D2 (25OHD2). The respective vitamin D parent molecules are vitamin D3 derived from the conversion of 7-dehydrocholesterol by sunlight (ultraviolet and radiation) in the skin, and vitamin D2 derived from plants.
In an attempt to improve quality and specificity, there has been a recent move away from immunoassay towards tandem mass spectrometry (MS/MS), which allows simultaneous measurement of 25OHD3 and 25OHD2. 12
A variety of liquid chromatography-tandem mass spectrometry (LC-MS/MS) methods have been described. 6,13–15 Extensive sample preparation is, however, required involving either liquid–liquid extraction or solid-phase extraction (SPE) with a solvent evaporation step. In addition, many of the methods require a number of manual transfers of the sample between vials, which are laborious, time-consuming and prone to error. Automation of these sample preparation steps would lead to significant benefits in sample throughput and minimize errors. We have developed a simple protein precipitation and automated SPE procedure that eliminates the need for the cumbersome solvent evaporation step with manual manipulations being kept to an absolute minimum.
Methods
Working calibrators were prepared by diluting a commercially available serum calibration 25OHD3/D2 standard (Chromsystems, München, Germany) into horse serum (Sigma-Aldrich Co Ltd, Poole, UK). Level I and II serum 25OHD3/D2 controls (Chromsystems, München, Germany) were diluted in horse serum to produce low-, medium- and high- quality control samples. A 625 μmol/L hexadeuterated 25OHD3 stock internal standard (Synthetica AS, Oslo, Norway) and working solution of 625 nmol/L were prepared in 80% (v/v) methanol in propan-2-ol.
The sample preparation involved addition of 20 μL internal standard working solution to 200 μL sample volume in a 2 mL polypropylene screw top vial (Alpha Laboratories, Hampshire, UK); the vials were then vortex-mixed. A 0.2 mmol/L zinc sulphate (200 μL) solution (Sigma-Aldrich Co Ltd, Poole, UK) was added to enhance the sensitivity of the assay. Methanol (500 μL) was added to precipitate proteins and the vials were vortex-mixed, centrifuged at 3000 rpm for 5 min and placed in a sample tray on an automated SPE platform (CTC PAL [Presearch] for ITSP™ SPE [MicroLiter Analytical Supplies, Inc], Suwanne, Georgia, USA). This robotic instrument performed a pre-programmed six-step SPE procedure in less than 4 min per sample. The SPE cartridge (10 mg Orochem C8) was first conditioned with methanol and then equilibrated with water. The pretreated sample was loaded onto the cartridge followed by a wash step with 60% (v/v) methanol in water. The cartridge was automatically moved over an LC-MS/MS 1 mL collection vial containing a 0.2 mL glass tapered insert (Speck & Burke Analytical, Alva, UK). The 25OHD3 and D2 were eluted using methanol and polarity was adjusted by the addition of water. The completed vial tray was then manually transferred into the LC-MS/MS auto-sampler (Figure 1).
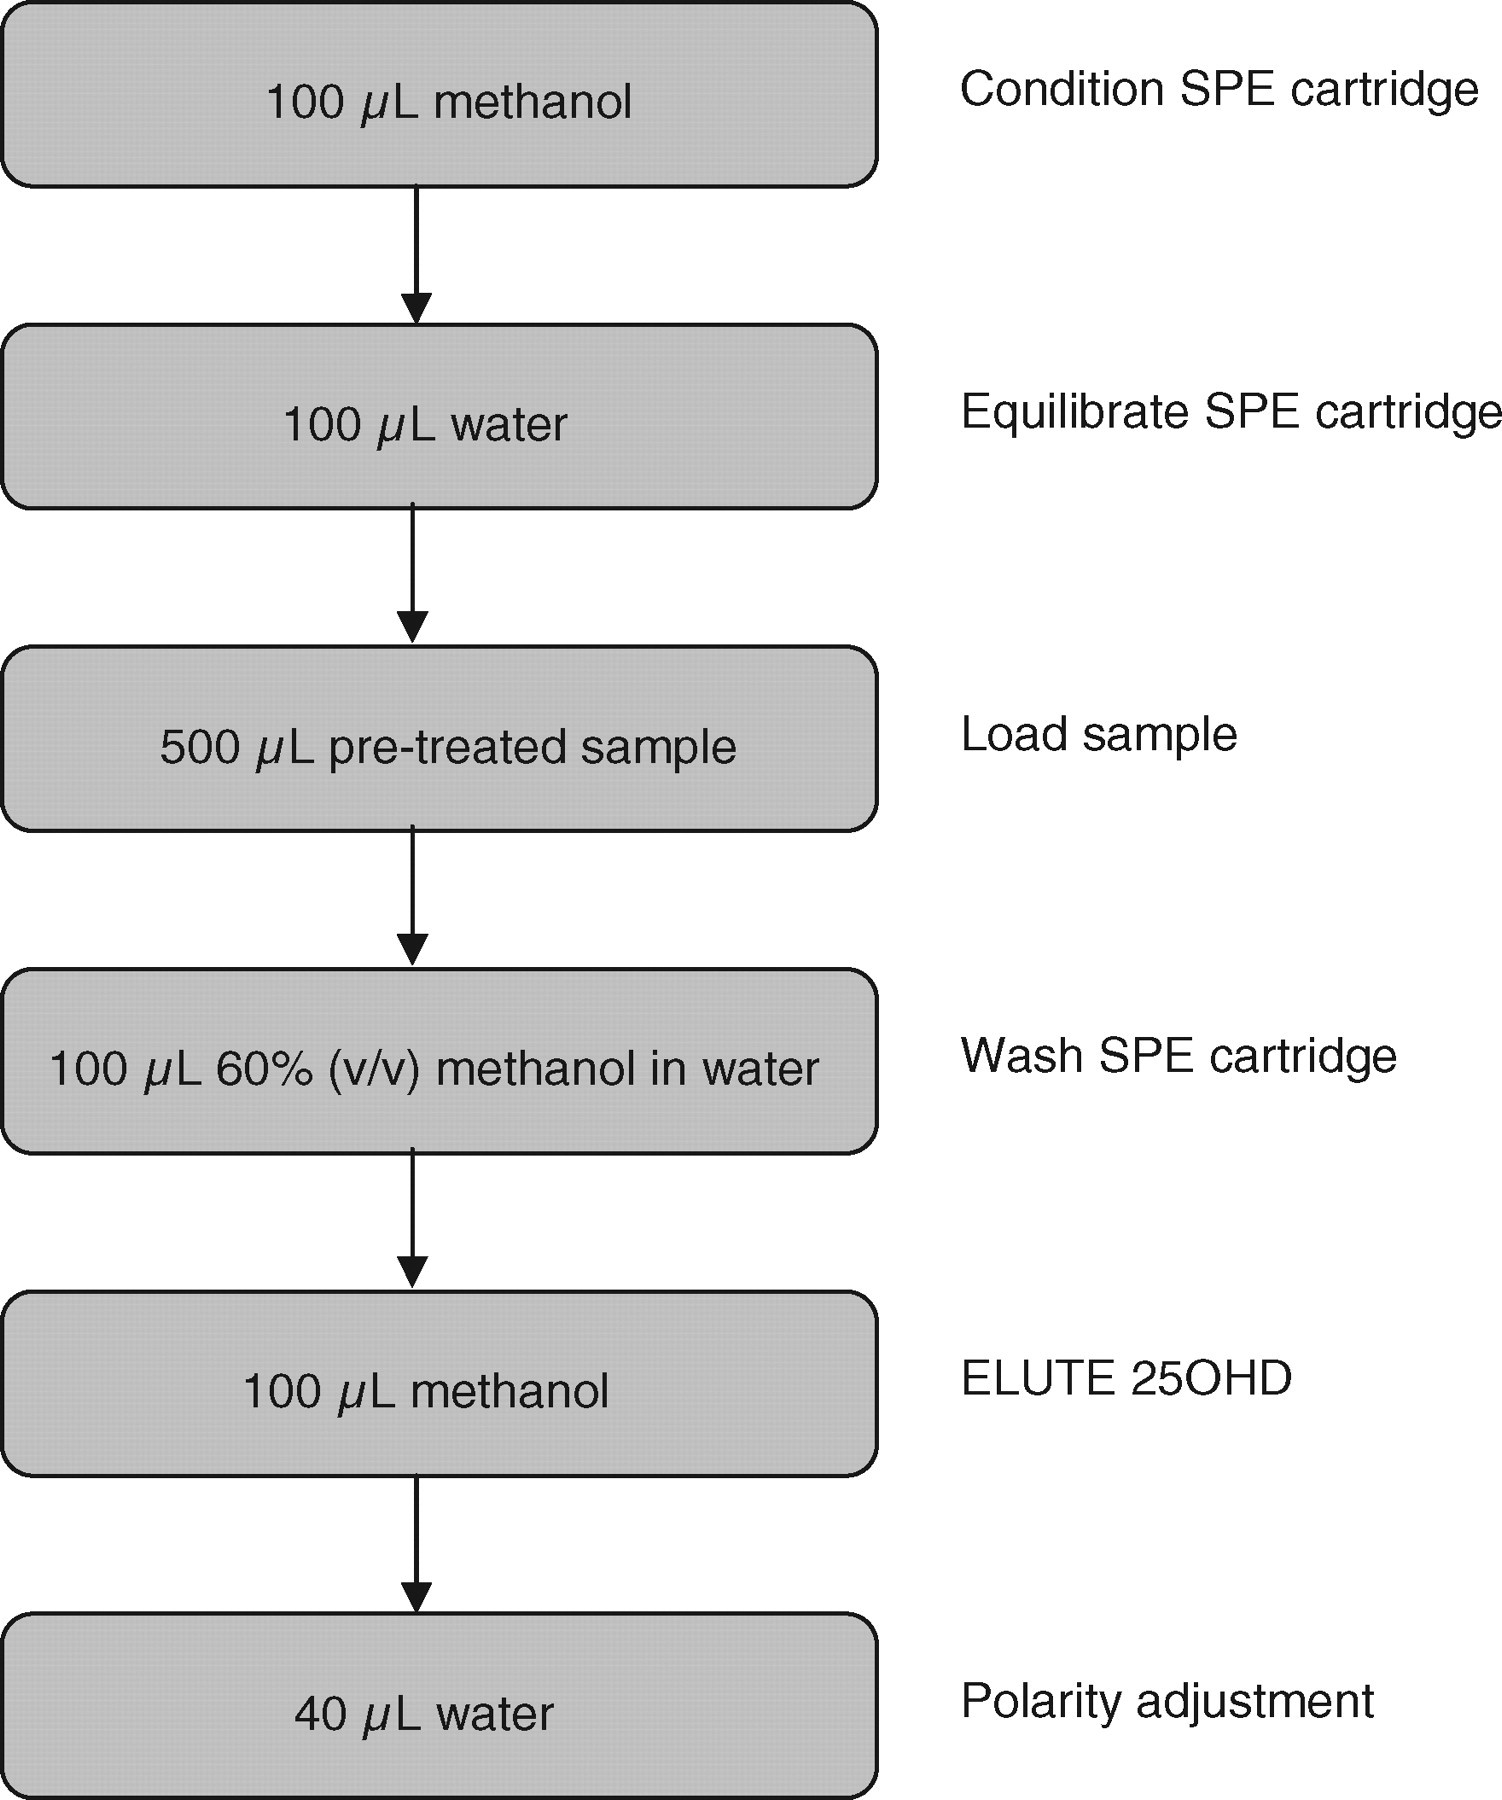
Automated six-step solid-phase extraction procedure using an automated platform (CTC PAL for ITSP™ SPE)
Sample analysis was performed using an automated LC-MS/MS system (Waters® UPLC® with the ACQUITY® TQD [Waters Corporation, Milford, MA, USA]). Separation of the 25OHD3 and D2 from the sample matrix was performed using the Waters® UPLC® system. Extracted sample (20 μL) was injected onto a Waters ACQUITY UPLC BEH C8 column (2.1 × 50 mm; 1.7 μm particle size). The chromatographic mobile phases consisted of 2 mmol/L ammonium acetate (w/v) and 0.1% formic acid (v/v) in water (eluent A) and methanol (eluent B). A gradient elution was performed and the column was then re-equilibrated to baseline conditions. The flow rate was 0.35 mL/min throughout and the column temperature was maintained at 45°C. A Waters® ACQUITY® TQD tandem mass spectrometer was used in positive ion mode with electrospray source. Instrument analysis time per sample was 5 min. The tuning parameters were capillary voltage 2 kV, cone voltage 25 V and desolvation gas flow 900 L/h. Argon was used as the collision gas with a collision energy of 25 eV. The multiple-reaction monitoring (MRM) transitions used for quantification of 25OHD3, 25OHD2 and hexadeuterated 25OHD3 were m/z 401.35 → 159, 413.30 → 83 and 407.35 → 159, respectively, with a dwell time of 0.08 s per channel and an inter-channel delay of 0.01 s. Hexadeuterated internal standard, 25OHD3 and 25OHD2 eluted from the column at 2.58, 2.59 and 2.62 min, respectively (Figure 2).
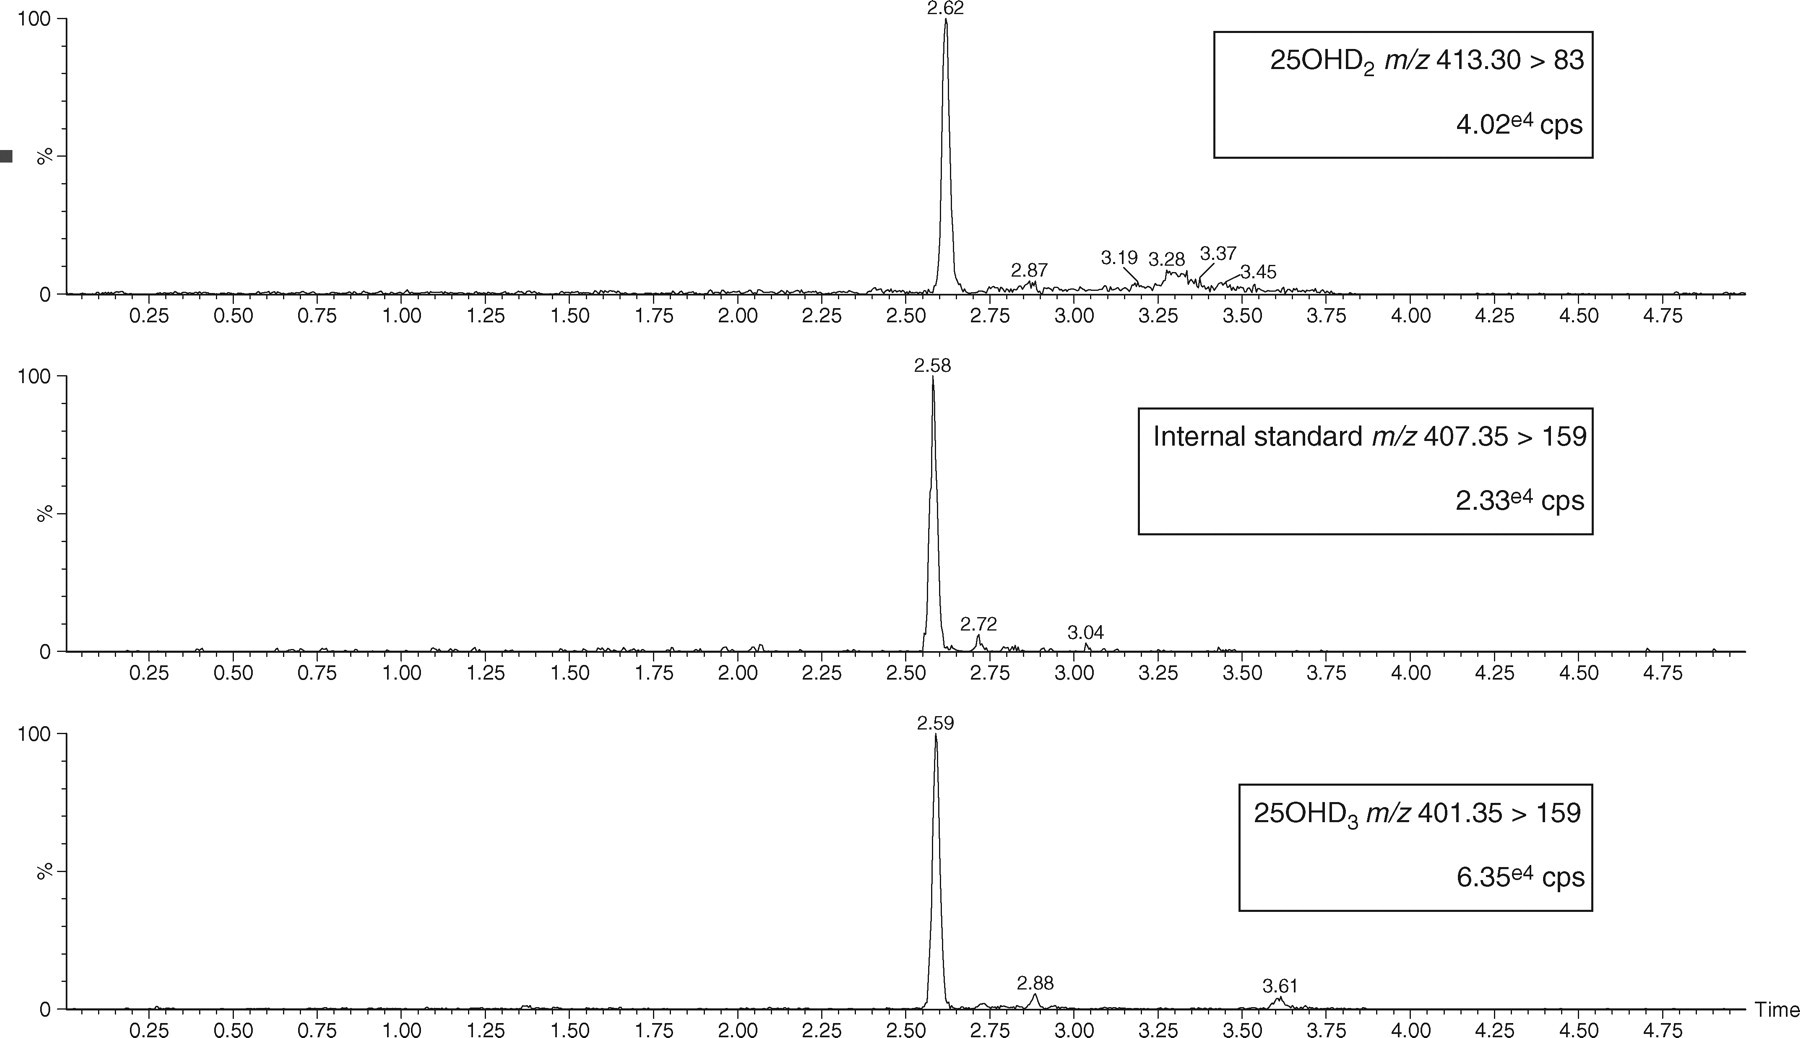
Liquid chromatography-tandem mass spectrometry chromatograms of 25-hydroxyvitamin D2 (25OHD2), internal standard and 25-hydroxyvitamin D3 (25OHD3). cps, counts per second. The chromatograms were smoothed using a mean algorithm
System operation and data acquisition were controlled using MassLynx™ v4.1 software and quantitative data analysis was performed using QuanLynx™ v4.1 software (Waters Corporation, Milford, MA, USA).
Statistical analysis
Regression analysis was calculated using the Passing and Bablok method and agreement was assessed using the Bland–Altman method. 16,17
Results
Sensitivity and specificity
The lower limit of detection (LLOD) and quantitation (LLOQ) were determined by serial dilutions of pooled patient serum with a low concentration of 25OHD3 and 25OHD2. The samples were analysed 10 times within a batch in two different assays. The LLOD, defined as the lowest concentration at which the 25OHD3 and D2 peaks were detected with a signal-to-noise ratio of 3 and with a % coefficient of variation (CV) < 20, was 2.5 nmol/L. The LLOQ, defined as the injected amount that produced a signal-to-noise ratio of 10, was 4.0 nmol/L for 25OHD3 and 7.5 nmol/L for 25OHD2.
Intra- and inter-assay imprecision
We determined intra- and inter-assay analytical variation (CV) using the low, medium and high 25OHD control samples. Intra-assay variation was obtained from 10 replicates measured in single series. A CV of <10% and mean values within 2% of the target concentration were considered acceptable. Inter-assay variation was obtained from measurement of low, medium and high control samples in 10 different assays over a two-week period using the same acceptance criteria as above. The results are summarized in Table 1.
Intra- and inter-assay imprecision
25OHD2 = hydroxyvitamin D2; 25OHD3 = hydroxyvitamin D3; CV = coefficient of variance
Serum pools distributed by three Vitamin D External Quality Assessment Scheme (DEQAS) distributions (n = 15) have been analysed using the described LC-MS/MS method with a mean positive bias of 10% compared with the Method Mean and 19% when compared to the All Laboratory Trimmed Mean (ALTM).
Linearity
Linearity was evaluated by constructing a standard curve using 25OHD3 and D2 (Sigma-Aldrich Co Ltd, Poole, UK) spiked into horse serum. The standard curve covered the analytical range (0–250 nmol/L) and extended to 2500 nmol/L. The response was considered to be linear if the correlation coefficient was greater than 0.99, calculated using least-squares regression. The calibration curve was linear to at least 2500 nmo/L, with an r value of 0.997 for 25OHD3 and 0.998 for 25OHD2.
Recovery
Recovery was assessed by comparing the concentration of 25OHD3 and D2 in patient samples before and after the addition of a known amount of 25OHD3 and D2 (Sigma-Aldrich Co Ltd, Poole, UK). Five serum samples with 25OHD3 and 25OHD2 concentrations ranging from 7.5–105 to 7.5–200 nmol/L, respectively, were used. The concentrations of 25OHD3 and 25OHD2 added to each sample were 62.5, 125 and 250 nmol/L. The mean recovery of 25OHD3 was 93% (range 90–104%) and for 25OHD2 it was 90% (range 89–96%).
Ion suppression
Matrix-induced ion suppression effects were investigated by infusing a 250 nmol/L solution of 25OHD3 and D2 directly into the mass spectrometer to provide a constant signal in specific MRM channels for 25OHD3 and D2. A serum sample containing a low concentration of 25OHD3 and D2 was extracted using the newly developed automated method and subsequently injected into the system via the LC using the standardized method solvent gradient. As compounds eluted from the column, ion suppression would be indicated by a reduction of greater than 10% in the specific signal for 25OHD3 and D2 provided by the constant infusion. 18 There was no significant ion suppression in the region of the chromatogram where 25OHD3 and 25OHD2 elute.
Comparison to IDS-OCTEIA 25-hydroxyvitamin D enzyme immunoassay
The previous method for the routine measurement of 25OHD in the Department of Clinical Biochemistry at Glasgow Royal Infirmary was enzyme immunoassay (IDS-OCTEIA 25-hydroxyvitamin D kit, Immunodiagnostics Systems Ltd, Boldon, UK). We compared 100 routine samples measured by the IDS enzyme immunoassay kit (EIA) and the newly developed LC-MS/MS method. The LC-MS/MS-defined 25OHD3 and 25OHD2 covered a concentration range 0–195 and 0–158 nmol/L, respectively. The IDS-EIA overestimated 25OHD at concentrations greater than 125 nmol/L as demonstrated by the Bland–Altman difference plot (Figure 3). The overall regression line comparing the two methods was IDS-EIA = 1.21LC-MS/MS + 2.65 (r = 0.94). Close agreement was obtained in samples less than 125 nmol/L with a regression line of IDS-EIA = 1.06LC-MS.MS + 1.33 (r = 0.96).
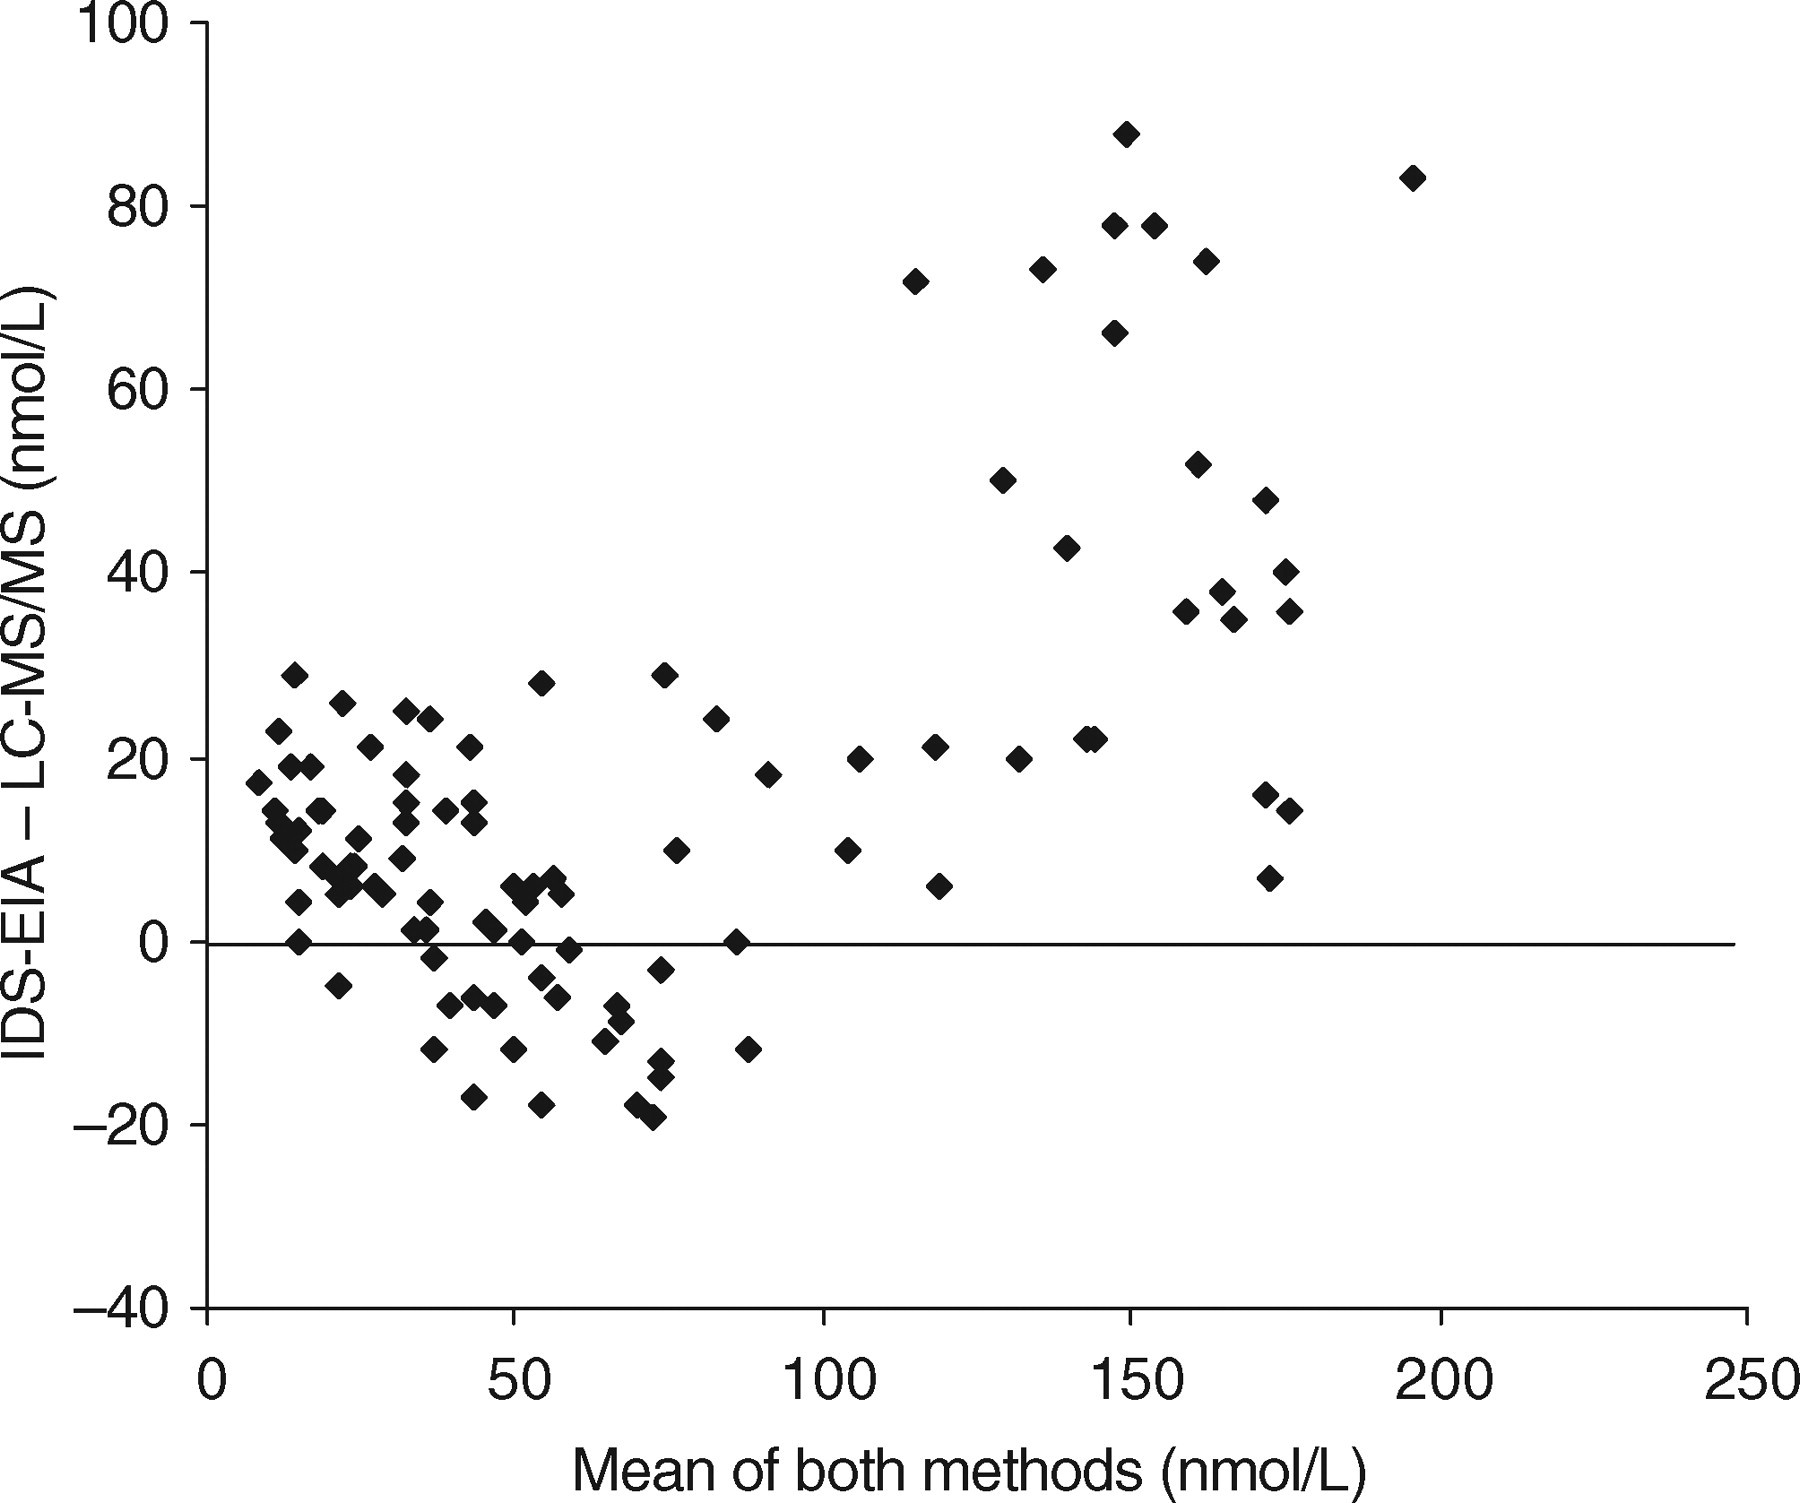
Bland–Altman difference plot comparing liquid chromatography-tandem mass spectrometry to IDS-OCTEIA 25-hydroxyvitamin D enzyme immunoassay for the measurement of total 25-hydroxyvitamin D in serum or plasma (n = 100)
Discussion
Clinical biochemistry laboratories are investing increasingly in LC-MS/MS technology for the routine measurement of 25OHD. An extraction step and/or chromatographic separation is a prerequisite to all LC-MS/MS methods and a number of different approaches have been used to address this. The simplest procedure is a hexane extraction, which removes water-soluble interferents and also precipitates proteins. 15 Multiple manual manipulations are, however, required, including a cumbersome solvent evaporation step. There is also a potential danger of using a semi-purified sample on the chromatographic column lifetime and introducing ion suppression effects.
Our approach was to design an offline automated SPE method aided by the recent addition of a sample preparation (ITSP) module for the well-established CTC PAL liquid chromatography sampler. This fully automates the SPE process and is, we believe, a cost-effective approach for a clinical laboratory with a workload of up to approximately 20,000 samples per year. The costs involved in the purchase of SPE cartridges can easily be offset against the savings in labour and reagent costs.
One advantage of an offline system is that during any LC-MS/MS instrument downtime, sample preparation can still be carried out and the purified extracts stored. There are faster, much more expensive systems available such as the T × 4 Turbo Flow system from Cohesive Technologies, which will allow online SPE and increased throughput. 19 Investment in such instrumentation may be more appropriate in laboratories with an extremely large workload.
Our department previously measured 25OHD using the IDS-OCTEIA enzyme immunoassay kit. The antibody used in this immunoassay was reported to have 75% cross-reactivity with 25OHD2 and patients on 25OHD2 may not have been accurately assessed. Comparison of 25OHD results obtained from IDS-OCTEIA and LC-MS/MS revealed a poor correlation at concentrations greater than 125 nmol/L with a positive bias. Such a difference was not, however, observed in a recent comparison of the IDS enzyme immunoassay method with LC-MS/MS conducted by Roth et al. 20 The study groups are not, however, comparable. Roth et al. measured only the 25OHD3 metabolite in surplus ethelenediamine tetra aceticacid plasma samples sent for measurement of intact parathyroid hormone and various bone markers. We measured both 25OHD3 and D2 in samples obtained from surplus serum where 25OHD had been specifically requested. Our patient group therefore included patients being monitored for 25OHD replacement, which could explain the higher proportion of results greater than 125 nmol/L. More detailed studies are required to investigate this discrepancy. It is worth commenting, however, that our comparative data for results below 125 nmol/L are excellent, indicating that these two methods would identify the same patients as being 25OHD deficient.
As indicated in recent literature, 25OHD methods are complicated by the lack of availability of an agreed standard. 2,8,12,20 Given the inherent problems with preparing in-house standards, we took the pragmatic approach and standardized using a commercially available serum-based standard from Chromsystems. We wished to maintain a serum matrix when preparing the standard curve from this stock but it proved difficult to obtain 25OHD-free serum. In our experience, charcoal-stripped serum contains a significant amount of 25OHD and was therefore not suitable. The problem was circumvented by the use of horse serum, which fortunately was found to have undetectable concentrations of 25OHD3 and 25OHD2. The alternative solution, advocated by some, is to prepare standards in an aqueous, non-physiological and non-serum matrix. It is certainly our experience that, as found in immunoassay, LC-MS/MS results can be affected by a sample matrix. The problems associated with poor method comparability, as highlighted in an increasing number of publications, will not be solved until a common standard matrix is used by all. 5,7,20–22 In this regard, the National Institute of Standards and Technology is working with the National Institutes of Health Office of Dietary Supplements (NIH/ODS), the US Department of Agriculture (USDA) and the Centers for Disease Control and Prevention to develop a serum-based reference material (SRM) for 25OHD2 and 25OHD3. This material (SRM 972) should be available towards the end of 2008 at four different concentrations covering the analytical range.
One real advantage of LC-MS/MS is, of course, the ability to simultaneously measure both 25OHD2 and 25OHD3 and patients receiving either vitamin D2 or D3 can be accurately monitored. Reporting separate results for 25OHD2 and 25OHD3 can, however, confuse the requesting clinician and we therefore report all results as total 25OHD being the sum of 25OHD2 (usually undetectable unless on vitamin D2 replacement) plus 25OHD3. 7,22 If 25OHD2 is present in significant amounts (>25 nmol/L), we append an appropriate comment to the report and this policy has been well accepted. Interestingly, the proportion of samples containing significant concentrations of 25OHD2 is low (2–3%), as would be expected in a country where 25OHD3 is the prescribed replacement of choice. In other European countries and the USA, 25OHD2 is prescribed at a much higher rate and the proportion of samples with measurable 25OHD2 will be much higher.
There is currently a significantly increasing demand for vitamin D measurements, which is challenging for busy, staff light, routine clinical biochemistry laboratory environments. The CTC PAL robotic instrument can process 80 25OHD samples per working day, but if increased capacity is required the system can run reliably overnight, unsupervised, analysing a total of 160 samples per 24 h. If further capacity is required, a further robotic system could be purchased. It is hoped that the simplified sample work-up described above for a specific, accurate and reliable LC-MS/MS method will encourage many more routine laboratories to consider this approach, and already two other clinical chemistry laboratories within the UK have adopted the method.
Footnotes
ACKNOWLEDGEMENT
The authors would like to thank Emma Boulton for technical assistance during the comparative study.