
Abstract
Background
Insulin resistance is associated with an increased risk of cardiovascular disease and diabetes. It can be assessed using complex reference techniques, such as clamp or frequently sampled intravenous glucose tolerance test (FSIVGTT). Therefore, simple indices derived from fasting insulin and glucose concentrations have been proposed. The aim of this study is to assess fasting serum insulin-like growth factor binding protein-1 (IGFBP-1) as a simple index of insulin sensitivity compared with other simple indices and FSIVGTT.
Methods
Fasting serum IGFBP-1, fasting plasma insulin (FPI), homeostasis model assessment (HOMA-IR), quantitative insulin check index (QUICKI), fasting glucose to insulin ratio (FGIR), Raynaud and insulin glycaemic index (ISI-gly) were correlated with FSIVGTT (Si) in 22 subjects with normal glucose tolerance (NGT) and nine with impaired fasting glucose (IFG).
Results
In NGT individuals, IGFBP-1 correlated more strongly with Si than did any other index both before (r = 0.76) and after (r = 0.79) natural logarithm (ln) transformation. In subjects with IFG, IGFBP-1 was weakly correlated with Si before and after ln-transformation (r = 0.55, r = 0.56, respectively), but ISI-gly was the index most strongly correlated with Si (r = 0.77, r = 0.85, respectively).
Conclusions
In subjects with NGT, fasting serum IGFBP-1 could be used as a simple reliable marker of insulin sensitivity. For more accurate estimation of insulin sensitivity in normal subjects and those with IFG, ln-transformation is preferred over raw data.
Introduction
Insulin resistance predisposes to cardiovascular disease and type 2 diabetes. 1 Although not measured routinely in clinical settings, its measurement may be necessary in research studies. The standard frequently sampled intravenous glucose tolerance test (FSIVGTT) is a safer and simpler alternative to clamp techniques. However, it is unsuited for large-scale studies. Consequently, simple indices have been used, i.e. homeostasis model assessment (HOMA-IR), 2 quantitative insulin sensitivity check index (QUICKI) 3 and fasting plasma insulin (FPI), 4 fasting glucose to insulin ratio (FGIR), 5 Raynaud index 6 and insulin glycaemic index (ISI-gly). 7 All these indices have their limitations that have been summarized previously. 8
The measurement of insulin-like growth factor binding protein-1 (IGFBP-1) has many potential clinical applications. 9 Its serum concentrations vary reciprocally with those of insulin and correlate strongly with measurements of insulin sensitivity made using the hyperinsulinaemic euglycaemic clamp. This has been demonstrated previously in fasting non-diabetic subjects (r = 0.73, P < 0.004). 10 Reported findings support a role for IGFBP-1 as an early marker of insulin resistance but more validation data are required including correlation with a reference technique in different glycaemic categories.
Most previous studies comparing simple insulin sensitivity indices with reference techniques have observed a non-linear hyperbolic relationship between the simple indices and parameters derived from reference techniques, such as euglycaemic clamp (M) and FSIVGTT (Si). This has prompted researchers to transform the proposed indices to either the base of logarithm (log) or natural logarithm (ln) prior to carrying out correlation analysis. Other authors have used untransformed data. Here, we compared the relationship between several simple indices of insulin sensitivity with insulin sensitivity index (Si) in healthy individuals before and after logarithm transformation. In this regard, we were particularly interested in IGFBP-1 as no previous study has, to our knowledge, correlated log or ln-transformed IGFBP-1 with standard Si or compared it comprehensively to other insulin sensitivity indices. Although this marker has a potential role in the early detection of insulin resistance both in the clinic and in the context of research studies, its value in subjects with type 2 diabetes is likely to be limited as a result of declining concentrations of insulin. 11 For this reason, we chose to limit the study to subjects with normal glucose tolerance (NGT) and impaired fasting glucose (IFG). Our chosen standard, the standard FSIVGTT, is valid in these subjects, offering the advantages of relative simplicity of use and utilization of endogenous insulin responses.
Research design and methods
Subjects
Subjects attended the investigation unit on two occasions. A standard 75 g oral glucose tolerance test was carried out at the first visit and glycaemic status classified according to the criteria of World Health Organization. 12 There were 22 NGTs (15 males, seven females aged 38.5 ± 13.6 yr and body mass index [BMI] 26.2 ± 4.7 kg/m2) and nine impaired fasting glucose (IFG) (six males, three females, aged 49 ± 8.7 yr and BMI 30.3 ± 3.1 kg/m2) subjects. At the second visit, subjects underwent a standard FSIVGTT. All subjects gave informed consent for participation and the study was approved by the South West Surrey Local Research Ethics Committee, Guildford, UK.
Frequently sampled intravenous glucose tolerance test and other simple indices
Following placement of intravenous cannulae, baseline blood samples for insulin and glucose measurement were taken at 15, 20, 25, 30 min. Glucose (0.3 g/kg of 50%) was then injected over 1 min and samples drawn at intervals up to 180 min as previously described. 13 Analysis was carried out using updated version of Minmod software (Millennium 6.02). 14 Other simple indices with their formulae are listed in Table 1.
Indices of insulin sensitivity derived from fasting glucose and insulin concentrations
*Insulin sensitivity index-glycaemia (ISI-gly) was calculated from total glucose and insulin concentrations measured at baseline and postoral glucose load divided by the corresponding mean reference value. Conversion factors: insulin, mU/L × 6 = pmol/L; glucose, mg/dL × 0.0555=mmol/L
Analytical determinations
Glucose was assayed by the hexokinase method, on a Bayer Advia 1650 auto-analyser. FPI was measured by enzyme-linked immunosorbent assay (ELISA; Mercodia, Sweden) with a maximum analytical coefficient of variation (CV) of 4.9% and sensitivity of <7.0 pmol/L. IGFBP-1 was measured by in-house ELISA using biotinylated monoclonal antibody and other R&D analytical components with maximum analytical CVs of 7.0% and 9.1% for intra and inter-assay precision, respectively, and sensitivity of 0.01 ng/mL. The binding of IGFBP-1 to capture antibody was validated using western blotting technique, which showed no cross-reactivity with other binding proteins (data not shown).
Statistics
Data were analysed using SPSS v.15 (SPSS Inc., Chicago, Illinois, USA). The sample size was estimated to have 80% power (5% significance value) to detect the sizes of effect detected by Araujo-Vilar et al. 15 for Si. Data were transformed using ln to approximate a normal distribution. Associations between data before and after transformation were examined using Spearman's and Pearson's correlation coefficients, respectively. The Mann-Whitney test was used for skewed data. Comparisons between ln-transformed (non-skewed) means were by independent t-test. Data were expressed as means ± SD.
Results
The Si index was significantly different (P < 0.05) between the two categories: NGT and IFG. The indices (untransformed, ln-transformed) were each correlated in turn with Si (untransformed, ln-transformed) (Table 2). Upon analysis of untransformed data in NGT subjects, IGFBP-1 was the index that showed the strongest correlation with Si (r = 0.76) (Figure 1a). Visual inspection suggested a positively skewed hyperbolic relationship between Si and other indices including IGFBP-1. In the same glycaemic category and after ln-transformation, the highest correlation coefficient observed was between Si and IGFBP-1 (r = 0.79) (Figure 1b). For the other indices, the weakest correlation was between untransformed data for Si and FGIR (r = 0.46) (Figure 1c). This correlation coefficient increased to 0.54 after both Si and FGIR were ln-transformed (Figure 1d).
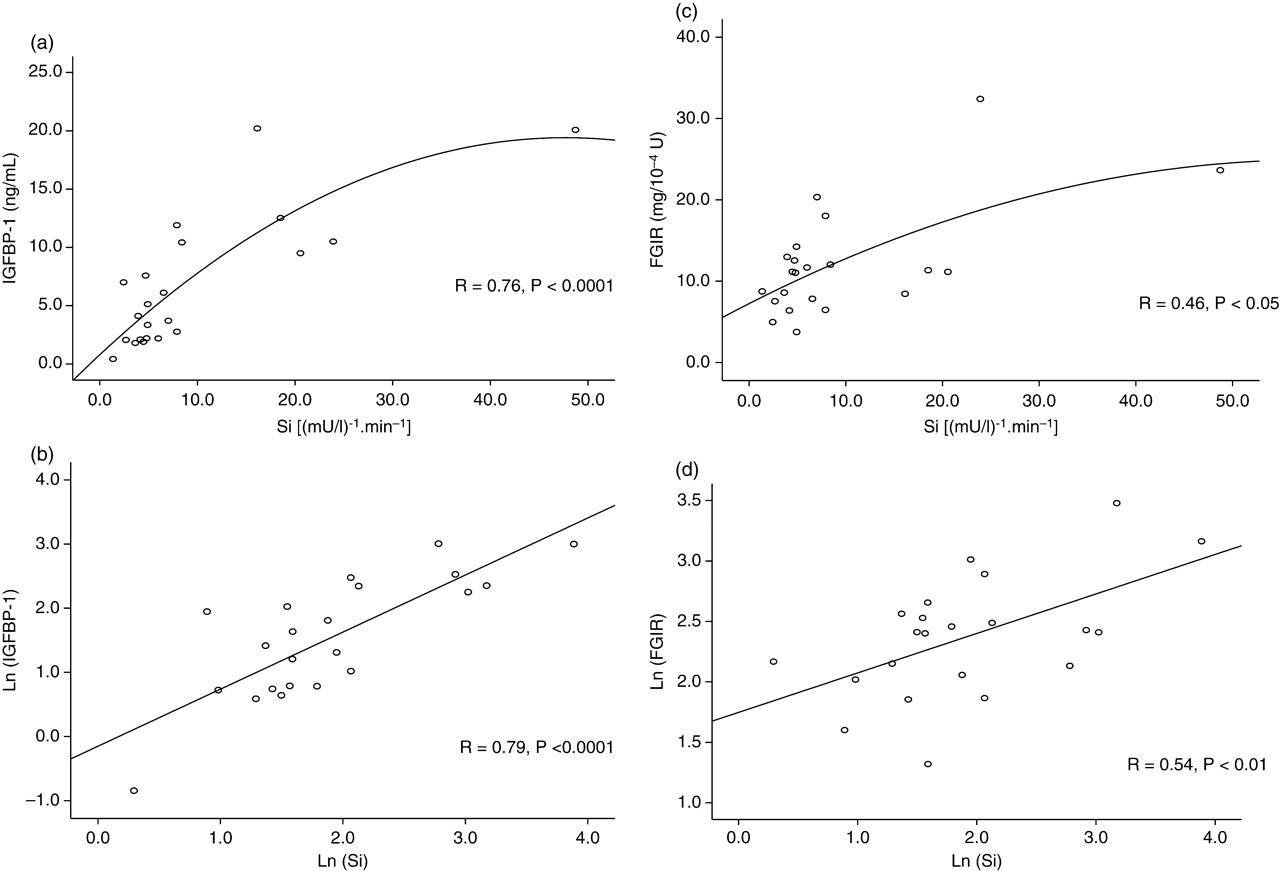
Spearman's and Pearson's correlation coefficients for untransformed estimates and after natural logarithmic (ln)-transformed (curve-fitting) in normal glucose tolerance category, respectively for Si (Minmod Millennium 6.02) against other insulin sensitivity indices. (a) Si vs. IGFBP-1; (b) ln (Si) vs. ln (IGFBP-1); (c) Si vs. fasting glucose to insulin ratio (FGIR) and (d) ln (Si) vs. ln (FGIR)
Correlation of insulin sensitivity indices with Minmod Millennium-derived Si before and after natural logarithmic (ln)-transformation
*P < 0.05
**P < 0.01
***P < 0.001
****P < 0.0001
†QUICKI untransformed values were used for the calculation of this index
Among the indices studied in IFG subjects, IGFBP-1 showed the weakest correlation with Si, both when untransformed data were analysed (r = 0.55) and after ln-transformation (r = 0.56). For the other indices, untransformed data showed strong correlation with Si, which improved further after ln-transformation (Table 2). The strongest correlated index with Si in this category was the ISI-gly index (r = 0.77 and r = 0.85, before and after ln-transformation, respectively). All indices except IGFBP-1 correlated more strongly with Si in subjects with IFG compared to subjects with NGT.
In the analysis both of pooled data from both glycaemic categories and each category individually, ln-transformation strengthened the relationship between Si and other indices (Table 2). Correlation coefficients observed following log-transformation were very similar to that following ln-transformation. In the same pooled data, BMI was significantly correlated with both Si and IGFBP-1 (r = −0.73, P < 0.0001 and r = −0.50, P < 0.01), respectively.
Discussion
Our results indicate that fasting serum IGFBP-1 may be used as a simple and sensitive marker of insulin resistance, which correlates more strongly with Si than do the other indices in NGT subjects. This outcome agrees with that of the study by Maddux et al. 10 although these authors used clamp technique as their standard rather than the standard FSIVGTT used here. Our finding of strong correlation between IGFBP-1 and Si using raw data is in line with that of Maddux et al. 10 (r = 0.73, P < 0.004), but not with those of Van Haeften et al. 16 where a modest correlation coefficient between IGFBP-1 and clamp was found (r = 0.228, P = 0.074). These conflicting findings could reflect the type of IGFBP-1 assay used. Both the study by Maddux et al. and the current study used sensitive ELISA, while Van Haeften et al. 17 used radioimmunoassay.
The improvement in the correlation coefficients between Si and IGFBP-1, in both NGT and IFG groups in our study, can be explained by the positively skewed non-transformed indices becoming normally distributed following transformation. Previous studies have shown an improvement in the correlation coefficient after using log- or ln-transformed data for insulin sensitivity indices compared with the untransformed values. 18,19 This has been demonstrated where the untransformed data to be correlated had the disadvantage of being related in a non-linear manner. Bonora et al. 20 investigated the relationship between the two untransformed measures of insulin sensitivity namely euglycaemic clamp and HOMA-IR and compared this to the ln-transformed data. The regression coefficient improved from −0.627 to −0.82, respectively.
Fukushima et al. 18 studied the correlation between HOMA-IR and Si before and after ln-transformation. Their study is not directly comparable to our own, as it included subjects from a wider range of glucose tolerance. In addition, it included data on one simple index only (HOMA-IR). However, it observed a significant correlation between this index and Si in group of subjects as a whole (r = 0.45, P < 0.0001), which improved following ln-transformation (r = 0.61, P < 0.0001). When subjects were reclassified according to their HOMA-IR values, there was very little difference in correlation coefficient after ln-transformation in those subjects with HOMA-IR <1, most likely subjects with NGT. The correlation coefficient improved and became significant in those with HOMA-IR >2, most likely subjects with deteriorating glucose tolerance. The authors concluded that when HOMA-IR increases, logarithm-transformed HOMA-IR will be a better predictor of insulin sensitivity. The improvement in correlation coefficients after ln-transformation is in agreement with our study, both for pooled data from the two glycaemic categories and in each individual categories we investigated. The slight difference observed between correlation coefficient of HOMA-IR and ln (HOMA-IR) in the study of Fukushima et al. was similar to that in our HOMA-IR in NGT category, but this improvement in correlation coefficients was more apparent for some indices (e.g. FGIR and ISI-gly) than others. Unlike Fukushima et al. we also chose to transform both correlated variables as we observed that raw data for Si was positively skewed rather than normally distributed.
In subjects with IFG, the ISI-gly index is more accurate than other indices of insulin sensitivity as its correlation with Si was stronger than that of other indices. This may be because this index takes account of both fasting and postload glucose and insulin concentrations in its estimation while the other simple indices include fasting concentrations alone. 21
Strong correlations between BMI with both parameters of Si and IGFBP-1 are consistent with previous studies and provide a further clinical validation of the IGFBP-1 assay. 11,22
Our work has produced useful preliminary data about fasting IGFBP-1 concentrations, but further studies are required to validate other criteria such as reproducibility and defined cut-off concentrations in different clinical conditions. While the difference between correlation of IGFBP-1 with Si compared to HOMA-IR and fasting insulin concentrations may not prove to be clinically relevant, IGFBP-1 offers advantages over these parameters in terms of stability and simplicity of measurement. In conclusion, in NGT subjects, IGFBP-1 appears to be a suitable and reliable marker as other commonly used indices of insulin sensitivity. This reliability appears to deteriorate in subjects with IFG. In these subjects, other insulin sensitivity indices, which depend on glucose–insulin kinetics are preferable. In both glycaemic categories, the base of logarithm or ln-transformation of the indices equally improves insulin sensitivity prediction.
Footnotes
Acknowledgements
The authors gratefully acknowledge funding support from the Saudi Government represented by the Saudi National Guard Health Affairs.