
Abstract
Background
There is an assumption that the mean and biological variation of insulin resistance (IR) is less in polycystic ovary syndrome (PCOS), and intuitively higher in type 2 diabetes (T2DM). To test this hypothesis we compared the mean and biological variation in IR in PCOS to that of T2DM and to age- and weight-matched controls.
Methods
Twelve PCOS, 11 matched healthy women; 12 postmenopausal diet-controlled T2DM and 11 matched healthy postmenopausal women were recruited. Blood samples were collected at 4-d intervals on 10 consecutive occasions. The biological variability of IR was derived on duplicate samples.
Results
Mean and biological variability of HOMA-IR for PCOS did not differ from T2DM. Both measures were higher than the matched controls. There was no difference in insulin or IR measures between the body mass index matched pre- and postmenopausal women. Percentage β cell function were 208.8%, 62.3%, 106.5% and 111.9%, respectively, in PCOS, postmenopausal women with T2DM, healthy premenopausal and healthy postmenopausal women.
Conclusions
The progression from PCOS to the development of T2DM is unlikely to be due to a further increase in IR (or variability), but rather the progressive failure of pancreatic beta cells with a decrease in insulin production.
The clinical trial registration number for this study is
Introduction
Patients with polycystic ovarian syndrome (PCOS) have an increased risk of developing type 2 diabetes (T2DM), 1 and both conditions are characterized by insulin resistance (IR). Increased IR is thought to be central to PCOS and may play a pathogenic role. 2 There is strong epidemiological evidence that IR is an independent cardiovascular risk factor. 3 The factors underlying the progression of PCOS to T2DM are unclear and may be due to an increase in the underlying IR, perhaps due to increasing age, that may differ in both its mean and by its increased variability within the same individual. 4,5 The aim of this study was to compare the mean and biological variation in IR concentrations in patients with PCOS to that of T2DM, together with age- and body mass index (BMI)-matched control subjects.
Patients and methods
This is a re-analysis of data derived from two studies. 4,5 The biological variation of IR was assessed by measuring IR at 4-d intervals on 10 consecutive occasions in 12 overweight patients (BMI > 25) with PCOS (BMI means ± SD; 33.2 ± 6.3), 12 postmenopausal Caucasian subjects with diet-controlled T2DM with previous normal menstrual cycles (31.1 ± 3.3), 11 healthy women with normal menstrual periods (every 28–30 d) (29.9 ± 3.25) and 11 healthy postmenopausal women (32.4 ± 5.3). Diagnosis of PCOS was based on the Rotterdam criteria 2003. 6 All patients with PCOS had evidence of hyperandrogenaemia (free androgen index >8), with a history of oligomenorrhoea and hirsutism or acne: all patients had a normal oral glucose tolerance test. Diabetes was diagnosed on a fasting venous plasma glucose concentration >7.0 mmol/L (126 mg/dL) or a 2-h concentration >11.1 mmol/L (200 mg/dL) after a 75 g oral glucose tolerance test. Women were considered postmenopausal if they had amenorrhoea for >1 y and follicle-stimulating hormone concentrations >20 IU/L. Exclusion criteria included any secondary cause of hyperglycaemia, current or previous (in the preceding 6 months) use of oestrogen therapy, treatment with insulin or oral hypoglycaemic agents, untreated hypothyroidism, history of drug or alcohol abuse or smoking. Subjects on medications unrelated to diabetes took their medication as usual with no changes reported during the sampling period. Fasting venous blood was collected at the same time each day (08:00–09:00 h). Samples were separated by centrifugation at 4°C, and two aliquots of the serum were stored at −20°C within 1 h of collection. Plasma glucose was analysed in singleton within 4 h of collection. The serum samples were split before assay. All subjects gave their informed written consent and the study had been approved by the local ethics committee.
Serum insulin was assayed using a competitive chemiluminescent immunoassay on a DPC (Siemens) Immulite 2000 analyser (Euro/DPC, Llanberis, UK); and plasma glucose measured by a hexokinase method on a Beckman Synchron LX20 analyser (Beckman Coulter UK Ltd, High Wycombe, Bucks, UK). Before analysis, all the serum samples were thawed and thoroughly mixed. Duplicate samples (i.e. two per visit) were randomized and analysed in a single continuous batch. IR was derived using the Homeostasis Model Assessment method (HOMA-IR) from fasting measures of serum insulin and plasma glucose, calculated using the homeostasis model assessment (HOMA) method (HOMA-IR = (insulin × glucose)/22.5). 7 Percentage beta cell function were calculated using the computer-based programme. 7,8
Statistical analysis was performed using SPSS for Windows, version 11.0 (SPSS Inc, Chicago). Data on insulin and HOMA-IR was non-Gaussian and therefore non-parametric calculations were used. Group differences were compared by analysis of variance. Where significant differences were indicated Scheffe's post hoc test was applied.
Biovariability data were analysed by calculating analytical, within-subject and between-subject variances (SDA 2, SDI 2, SDG 2, respectively) according to the methods of Fraser and co-workers. 9,10 Using this technique, analytical variance (SDA 2) was calculated from the difference between duplicate results for each specimen (SDA 2 = Σd 2/2N, where d is the difference between duplicates and N the number of paired results). The variance of the first set of duplicate results for each subject on the 10 assessment days was used to calculate the average biological intraindividual variance (SDI 2) by subtraction of SDA 2 from the observed dispersion (equal to SDI 2+SDA 2). Subtracting SDI 2 + SDA 2 from the overall variance of the set of first results determined the interindividual variance (SDG 2). The intraindividual (SDI) and interindividual (SDG) variations were estimated as square roots of the respective variance component estimates. Coefficient of variation was calculated from mean divided by standard deviation. For all analysis, a two-tailed P < 0.05 was considered to indicate statistical significance.
Results
The clinical and biochemical details of the individual subjects are shown in Table 1. No significant difference in BMI was observed between any of the four groups (P = 0.37). As anticipated, PCOS/premenopausal controls were younger than T2DM/postmenopausal controls (P < 0.0001). When the mean HOMA-IRs for each PCOS patient were combined as a group they did not differ from patients with T2DM (3.1 ± 1.2 and 1.9 ± 0.9, respectively). However, both groups were higher than in their matched controls (P = 0.005) (premenopausal women, 1.0 ± 0.2; postmenopausal women, 1.3 ± 0.5). There was no difference in IR between the pre- and postmenopausal controls. Insulin concentrations were higher for PCOS than T2DM and both significantly higher than the control populations (P < 0.0001). Percentage beta cell function were 208.8%, 62.3%, 106.5% and 111.9%, respectively, in PCOS, postmenopausal women with T2DM, healthy premenopausal and healthy postmenopausal women. Mean intraindividual variation of IR for PCOS, postmenopausal T2DM, healthy premenopausal and healthy postmenopausal were 1.19, 1.05, 0.23, 0.15, respectively (P < 0.001).
Clinical and biochemical features of subjects
Data with Gaussian distribution are presented as means ± SD while those with non-Gaussian distribution are presented as median (interquartile range). ND, test not done; HOMA-IR, calculated insulin resistance; HOMA %B, calculated beta cell function; T, total testosterone; SHBG, sex hormone-binding globulin
*Denotes P < 0.05 between healthy postmenopausal and healthy premenopausal
†Denotes P < 0.05 between healthy postmenopausal and PCOS
‡Denotes P < 0.05 between postmenopausal T2DM and healthy premenopausal
§Denotes P < 0.05 between postmenopausal T2DM and PCOS
**Denotes P < 0.05 between healthy premenopausal and PCOS
††Denotes P < 0.05 between healthy postmenopausal and postmenopausal T2DM
Discussions
This is the first analysis to compare the mean and biological variation of IR in PCOS with that of T2DM. These data show that the mean IR and its biological variability do not differ between PCOS and T2DM, although insulin concentrations in the PCOS group were considerably greater (Figure 1). All the parameters were higher than the respective matched control subjects.
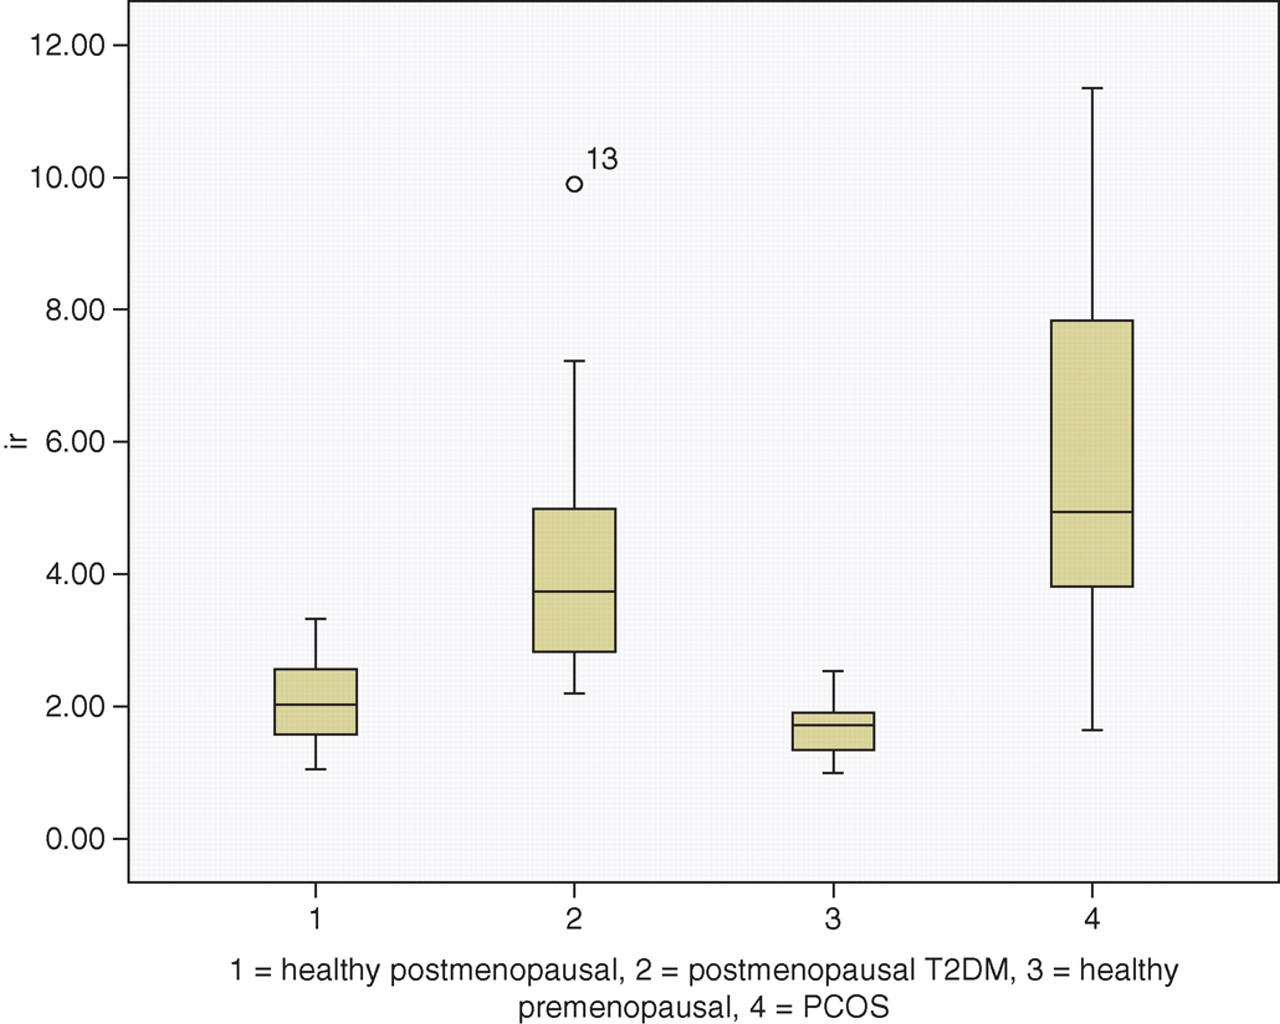
Box plot of median and range of insulin resistance in each group
These findings have several implications. First, they suggest that the progression from PCOS to the development of T2DM is unlikely to be due to a further increase in IR (or variability), but rather the progressive failure of pancreatic beta cells that is recognized in T2DM. 11 The HOMA beta calculation for beta cell function supported this hypothesis by the fact that percentage beta cell function was much reduced in postmenopausal women with T2DM compared with other groups. Although, similarly insulin resistant beta cell function was much increased in patients with PCOS, with a corresponding reduction in insulin sensitivity. This increased workload against IR, in some women may lead to a subsequent failure of beta cells and consequently T2DM. Gungor et al. 11 had shown that adolescents with T2DM have impairment in first phase insulin secretion (FPIS) and second phase insulin secretion (SPIS). Other studies by the same group suggest that adolescent PCOS with normal glucose tolerance (NGT) are more hyperinsulinaemic than matched obese girls, 12 and those with impaired glucose tolerance (IGT) have impaired FPIS with no derangement in SPIS. 13 Comparing across their studies, Gungor et al. 11 proposed that the essential metabolic determinant of the progression from NGT to IGT to T2DM is due to pancreatic beta cell failure and our findings are consistent with this suggestion.
IR has been shown to be an independent risk factor for cardiovascular disease 14 and patients with PCOS may have an increased cardiovascular risk. 15–19 That the mean IR is as high in T2DM implies that women with PCOS may have a cardiovascular risk comparable with T2DM despite not being hyperglycaemic. While biological variability in IR has not been proven to add to the risk already present in patients with high mean IR values, glucose variability has recently been found to be associated with increased risk of free radical damage, independent of mean glucose in patients with T2DM. 20 It remained possible that an increase in biological variability of IR may be associated to or in fact is an independent risk for cardiovascular risk.
The data also showed that in individuals with the same BMI and ethnicity 21–23 both the mean concentration and the intraindividual variation of IR were both low and did not differ between the BMI-matched premenopausal and postmenopausal controls, indicating that IR and its biological variation does not change substantially with age and is independent of menopausal status. A limitation of this study is that the data from two different studies were used for comparison.
In conclusion, insulin concentrations were lower in patients with T2DM compared to PCOS although the mean and biological variations of IR were comparable; suggesting that beta cell dysfunction may determine the progression of PCOS to T2DM.
DECLARATION