
Abstract
Abstract
Background
To assess the usefulness of erythrocyte glycated haemoglobin (HbA1C) as a screening tool to identify those subjects with impaired fasting glycaemia (IFG) who do not have impaired glucose tolerance (IGT) or diabetes mellitus (DM) on a 75 g oral glucose tolerance test (OGTT).
Design and methods
All subjects undergoing an OGTT had HbA1C measured at baseline. Receiver operator characteristics analysis was used to identify optimal HbA1C cut-off values for diagnosing and excluding IGT and DM.
Results
We studied 140 subjects (69 women) with IFG (fasting capillary plasma glucose between 6.1–6.9 mmol/L). Using World Health Organisation criteria, 27 had isolated IFG, 56 had IGT and 57 had DM. HbA1C was higher (P < 0.001) in patients with DM (6.8 ± 0.93%) when compared with those with IGT (6.3 ± 0.68%) and isolated IFG (6.2 ± 0.30%), but HbA1C was similar in those with IGT and isolated IFG. There was no HbA1C cut-off value differentiating isolated IFG from IGT or DM. None of the subjects with isolated IFG had HbA1C concentration of >6.8%, but 76% and 54% subjects with IGT and DM, respectively, had HbA1C of ≤6.8%.
Conclusions
HbA1C measurement is of limited value in differentiating isolated IFG, IGT and DM in subjects with IFG. It cannot be used to identify which subjects with IFG do not require an OGTT.
Introduction
The World Health Organisation (WHO) and Diabetes UK recommend that subjects with impaired fasting glycaemia (IFG) should undergo a 75-g oral glucose tolerance test (OGTT) to exclude diabetes mellitus (DM). 1 This has resulted in an increase in the number of OGTT requests in our laboratory. An OGTT should be performed in a controlled environment and is time consuming for the patient and health-care professionals. It may also be unpleasant for some patients as it may induce nausea and vomiting. An alternative single blood test to replace the OGTT has, therefore, long been sought to simplify the diagnosis of DM.
Erythrocyte glycated haemoglobin (HbA1C) reflects average plasma glucose concentrations over the preceding 2–3 months. HbA1C correlates with fasting glucose concentrations, 2 h glucose concentrations on OGTT and postprandial glucose concentrations. 1–4 HbA1C can be performed at any time of the day and does not require any special preparation such as fasting. The use of HbA1C to diagnose DM is therefore appealing, 1 and it has been suggested that HbA1C, either on its own or in combination with fasting plasma glucose, can be used to diagnose diabetes, 3–13 but this remains controversial. 14–19
There are no data on HbA1C predicting glucose-intolerance states in subjects with impaired fasting glycaemia (IFG). We therefore studied whether measurement of HbA1C in subjects with IFG could be used to reduce the number of OGTT by predicting those without impaired glucose tolerance (IGT) and DM.
Patients, materials and methods
Patients
As part of a service evaluation, we analysed one-year prospective data on OGTT referrals from primary care to the Department of Clinical Chemistry, New Cross Hospital, Wolverhampton. Exclusion criteria included those <18 years of age, pregnant women and known diabetics. We limited this study to those with IFG as these form the vast majority of requests for an OGTT, and therefore we also excluded those with fasting capillary plasma glucose <6.1 mmol/L and >6.9 mmol/L.
The OGTT
Following an overnight fast of 12 h, a free-flowing capillary blood sample was collected from medial aspect of the finger tip for measurement of plasma glucose and HbA1C. Subjects then consumed 75 g of glucose dissolved in 200 mL of water within 5 min and a further capillary blood sample collected 2 h later for measurement of plasma glucose. Interpretation of capillary plasma glucose concentrations, which are different from those of plasma venous glucose, was based on the WHO criteria. 1
Analytical methods
Plasma glucose was measured using an automated hexokinase method (Roche modular P, Roche Diagnostics GmbH, Mannheim, Germany). Diabetes Control and Complication Trial (DCCT)-aligned HbA1C was measured using an automated cationic non-porous ion exchange high-performance liquid chromatography method (Tosoh Corporation, Kanagawa, Japan). The inter-assay coefficients of variation (CVs) for glucose at 7.0 and 14.0 mmol/L were 1.7% and 1.9%, respectively, and intra-assay CVs at 7.0 and 15.2 mmol/L were 1.0% and 0.8%, respectively. Inter-assay CVs for HbA1C at 4.1% and 9.1% were 1.2% and 0.8%, respectively, and intra-assay CVs at 4.1% and 13.4% were 0.5% and 0.9%, respectively.
Statistical analysis
Data were normally distributed and therefore analysed using parametric tests. One-way analysis of variance was used to compare the differences in means between groups. Pearson's linear correlation was used to measure the significance of association between the variables. Data were shown as mean ± standard deviation unless otherwise specified and were analysed using Statistical Programme for Social Sciences version 13 (SPSS Inc., IL, USA). Receiver operator characteristics (ROC) analysis was used to derive an optimum cut-off value for HbA1C diagnostic of either diabetes or glucose intolerance in individuals with IFG.
Results
Using WHO criteria, there were 140 subjects with IFG (fasting capillary plasma glucose between 6.1–6.9 mmol/L). This comprised 71 men and 69 women aged 65.5 ± 11.2 and 63.9 ± 14.6 years, respectively, and weighing 81 ± 16.4 and 86.7 ± 16.4 kg, respectively.
Of the 140 subjects with IFG, 27 had isolated isolated IFG, 56 had IGT and 57 had DM. HbA1C was higher (P < 0.001) in patients with DM (6.8 ± 0.93%) when compared with those with IGT (6.3 ± 0.68%) and isolated IFG (6.2 ± 0.30%), but there was no significant difference in HbA1C between those with IGT and isolated IFG.
HbA1C correlated (r = 0.448; P < 0.01) with 2 h glucose concentrations, but there was no correlation between fasting glucose concentrations and 2 h glucose concentrations or HbA1C.
ROC curves for HbA1C as a diagnostic indicator for DM and for IGT are shown in Figure 1. In summary, ROC analysis gave an optimum HbA1C value of 6.48% with a sensitivity of 68% and specificity of 67% to predict a 2 h capillary plasma glucose of ≥12.2 mmol/L, and an HbA1C value of 6.15% with a sensitivity of 62% and specificity of 58% to predict a 2 h capillary plasma glucose of ≥8.9 mmol/L and <12.2 mmol/L.
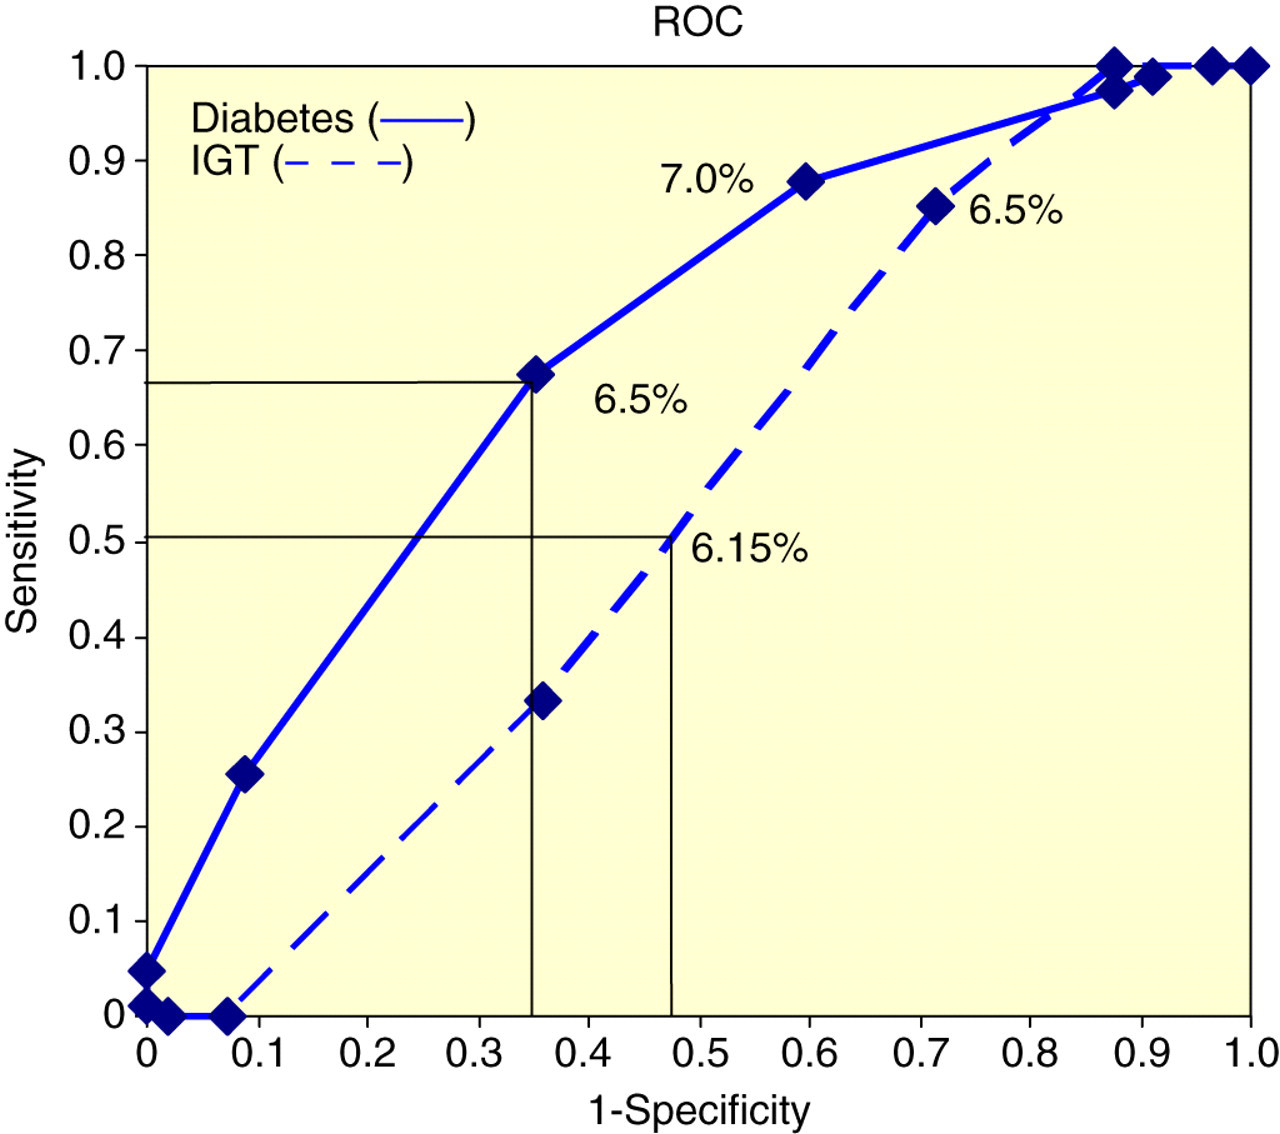
Receiver operator characteristics (ROC curve for erythrocyte glycated haemoglobin (HbA1c) as a diagnostic indicator for impaired glucose tolerance (IGT) and diabetes mellitus (DM) in subjects with impaired fasting glycaemia (IFG).
There was no lower HbA1C cut-off value differentiating isolated IFG from IGT or DM. None of the subjects with isolated IFG had HbA1C concentration >6.8% but 76% subjects with IGT and 54% with DM had HbA1C ≤6.8%.
Discussion
HbA1C in conjunction with fasting plasma glucose concentrations has been used to diagnose DM, 3–13 but this is not widely accepted. 14–19 We did not use HbA1C for diagnostic purposes but to investigate whether there was an HbA1C concentration that would exclusively predict isolated IFG as this had the potential to reduce the number of OGTTs. There was, however, no HbA1C cut-off concentration that differentiated isolated IFG from IGT or DM. Although an HbA1C value of >6.8% excluded isolated IFG, this was of little practical value as these patients would still require an OGTT to confirm DM and distinguish it from IGT. Our results are consistent with a meta-analysis that concluded that although an HbA1C value above the upper reference limit could indicate developing or overt glucose intolerance, a normal value did not exclude it, 5 however, they differ from those studies reporting HbA1C to be of value in predicting glucose intolerance. 3–13 Differences in these studies may be related to different study groups, reproducibility of OGTT, glucose sample type as well as analytical and biological variability of HbA1C.
In our study, fasting glucose concentrations were between 6.1 and 6.9 mmol/L, whereas other studies have included those with glucose concentrations <6.0 mmol/L and >7.0 mmol/L. 5,6,12 The high prevalence of IGT (40%) and diabetes (41%) in our subjects with IFG is different from other studies reporting a much lower prevalence of IGT and diabetes. 20,21 The high prevalence of IGT and diabetes in our subjects suggest the necessity to revisit the current definition of IFG and consider lower cut-off values for fasting glucose as an indication for OGTT. The importance of identifying isolated IFG is that although it is associated with cardiovascular risk factors, 22–25 unlike IGT and diabetes it is not associated with adverse cardiovascular outcomes. 26
The OGTT is poorly reproducible. 27,28 Capillary blood, unlike venous blood, is not subject to tissue extraction of glucose and therefore improves reliability of postprandial glucose measurements. 29 Our results using capillary samples, however, are similar to those studies using venous samples 5 probably because WHO diagnostic criteria 1 take account of sample type.
Although analytical variability of HbA1C between methods has largely been addressed by DCCT alignment, 30 the biological variability of HbA1C remains an inherent limitation of testing HbA1C. 14,15
In summary, measurement of HbA1C is of little value in differentiating between subjects with IFG who have isolated IFG and those with IGT or DM. In subjects with IFG, HbA1C measurement will not reduce OGTT requests, since it does not identify which subjects with IFG do not require an OGTT.