
Abstract
Abstract
Background
Haemoglobin A1c (HbA1c) is the only measure of glycaemic control used for many patients with diabetes, but it has limitations and might sometimes be misleading. HbA1c concentrations are influenced by conditions that alter red-cell life and there is evidence that biochemical variation in intracellular glycation rates also influence HbA1c concentrations. This paper is the first to propose a method of using simultaneously measured HbA1c and fructosamine, and error grid analysis, in the clinical setting, to gain a better understanding of glycaemic control.
Methods
Cross-sectional analytical study using HbA1c and fructosamine measures on the same blood sample from 1744 patients having blood taken for hospital diabetes clinic appointments. No other selection or exclusion criteria were applied.
Results
The fructosamine results were converted to a HbA1c equivalent which was then compared with the HbA1c. In an Altman-Bland plot, the paired result differences ranged between −6.9% and +5.5% HbA1c with 1139 (65%), 438 (25%), 130 (8%) and 37 (2%) being ≤1%, 1–2%, 2–3% or >3% of HbA1c difference, respectively. In clinical error grid analysis, 864 (50%) results had tight concordance for clinical interpretation, 761 (43%) had one block disunity of probably little clinical significance, but 105 (6%) were two blocks and 14 (1%) were three blocks discordant.
Conclusion
HbA1c may not accurately reflect glucose control. Our method, utilizing co-assessment with serum fructosamine, evaluates the possible clinical impact of this. We suggest the analysis used in this paper should be used routinely in diabetes practice.
Introduction
The use of haemoglobin A1c (HbA1c) to monitor glycaemic control has limitations. 1–3 Conditions that alter red-cell lifespan influence HbA1c concentrations, and it is now appreciated that biochemical variation in intracellular glycation rates may also lead to an under- or overestimate by HbA1c of the prevailing glucose concentrations. 4–8 Similar concerns are raised by evaluation of HbA1c against other glycated proteins, particularly serum fructosamine, 9,10 such that a position statement of the American Diabetes Association in 2003 11 suggests that the simultaneous measurements of glycated serum proteins and HbA1c might compliment one another and provide more useful information than the HbA1c alone. Certainly, we may not appreciate the complexity of a clinical situation 12 and the true nature of individual vascular risk by measuring HbA1c alone.
While HbA1c has a well-investigated relationship with glucose concentrations 13–15 and there is good evidence of its association with risk factors for vascular complications, 16–19 in individual patients, HbA1c concentrations may be sufficiently misleading to result in clinical misjudgements. 20
Information on the relationship of diabetes control and complications trial (DCCT)-aligned’ HbA1c to serum fructosamine is sparse with no agreed method for the comparison of results. 21 There are no studies that guide us in the understanding of HbA1c variability, the use of simultaneously measured fructosamine and the application of this information to clinical practice.
This paper proposes a method of using simultaneously measured HbA1c and fructosamine, in the clinical setting, for the understanding of an individual patients' glycaemic control.
Materials and methods
Patient population
HbA1c and fructosamine were measured in all samples taken between March 2005 and January 2006, where appropriate specimens were received from our hospital diabetes clinic population (n = 4000). Other selection or exclusion criteria were applied. The population includes patients with type 1 and type 2 diabetes. Altogether 1744 paired samples were analysed. All paired samples were from different patients. 22 The characteristics of the patient population were: 979 (56%) male and 765 (44%) female; aged 60±14 years (mean ± SD), ranging from 18 to 94 years old; 1042 (60%) White Caucasian, 389 (22%) Indo-Asian, 161 (9%) Black Afro-Caribbean, 152 (9%) other or unknown; 1070 (62%) insulin-treated, 557 (32%) on oral hypoglycaemic agents, 76 (4%) on diet alone, and 41 (2%) unknown.
Analytical methods
HbA1c (DCCT-aligned) was measured using a high-performance liquid chromatography method on a Tosoh G7 analyser (Tosoh Bioscience Ltd., Worcestershire, UK). The performance scores in the National External Quality Assurance Scheme were: A scores <100 and B scores <2%. The between-batch percent coefficient of variation (%CV) was 2.3. Fructosamine was measured using a nitrotetrazolium-blue reduction method on a Roche Modular P analyzer (Roche Diagnostics Ltd., West Sussex, UK) using a Cobas kit (Roche Diagnostics Ltd., West Sussex, UK) with between-batch %CV as 3.1 (at a concentration of 263 μmol/L) and 2.2% (at a concentration of 518 μmol/L).
Statistical analysis
Comparison of the two measurements was performed by the Altman-Bland plot 23,24 and clinical error grid analysis. 25 The latter technique displays a scatter plot with one value on each axis and classifies the error, on pairs of values, in terms of concordance or discordance in relationship with the potential clinical significance of any error. Both the Altman-Bland plots and error grid analysis require the same range of values on both the x and y axes and the same upper and lower limits for the reference interval. To achieve this for both analyses, the HbA1c was used as the anchor value and serum fructosamine values were converted to their standard normal deviate and then converted to a HbA1c equivalent using the mean HbA1c and its standard deviation (Box 1). This is referred to as the fructosamine HbA1c (FHbA1c). Distribution of the disparity between the two values for the purpose of error grid analysis utilized HbA1c categorization breaks at <6%, 6–7%, 7–8%, 8–10% and >10%, equating to our arbitrary but considered notion or clinical assessment of attainment of glycaemic control as excellent, good, average, poor or very poor glycaemic control. This relates to the curvilinear association of vascular risk and HbA1c as demonstrated both in the DCCT 16 and UK Prospective Diabetes Study Group. 17 A significant disparity was taken as a two block disunity between values.
Calculation of fructosamine HbA1c (FHbA1c) equivalents
Each fructosamine (f) value is converted into its standard normal deviate (SND):
SND (f) = (fructosamine − mean fructosamine) / SD of fructosamine
Fructosamine SNDs were converted to HbA1c equivalents (FHbA1c) using the mean and SD for HbA1c:
FHbA1c = (SND [f] × SD HbA1c) + mean HbA1c
Results are presented as the mean ± 1 SD and statistical significance was taken at P value <0.05.
Results
Of the 1744 paired results, the mean ± SD HbA1c was 8.4 ± 1.7%, the mean ± SD fructosamine was 316 ± 72 mmol/L and, as expected, the calculated FHbA1c was also 8.4 ± 1.7%.
Figure 1 shows the Altman-Bland plot for HbA1c and the difference between HbA1c and FHbA1c for each paired value. The differences were normally distributed and a parametric method was used to calculate the limits of agreement which were 2.303 and −2.385. This can be accounted for by the total analytical CV (CVA) of 7.6. However, the range of differences was large, falling between minus 6.9% and plus 5.5% HbA1c (a range of 12.4), which is greater than can be accounted for by the CVA. Of these paired results, 1139 (65%), 438 (25%), 130 (8%) and 37 (2%) had a difference of ≤1%, 1–2%, 2–3% or >3% of HbA1c, respectively. Of the 167 (10%) being >2% HbA1c discordant, the true HbA1c read lower or higher than the FHbA1c in 89 (53%) and 78 (47%) cases, respectively.
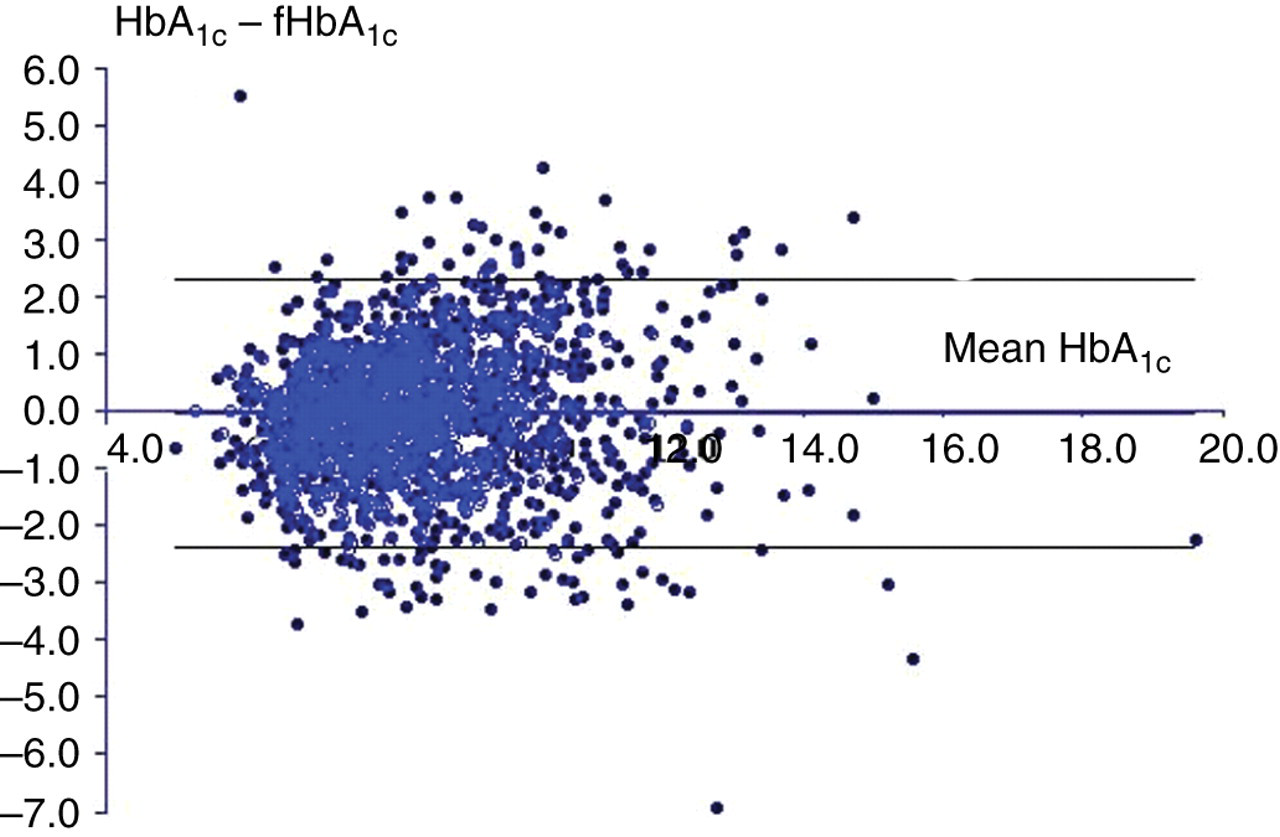
An Altman-Bland plot (with 95% confidence intervals) of percent glycated HbA1c against the difference between it and the equivalent fructosamine-derived HbA1c estimate
Figure 2 and Table 1 shows the clinical error grid analysis in graph and block representation. Of the 1744 paired results, 864 (50%) results fell in the same block and had tight concordance for clinical interpretation, whereas 761 (43%) had one blocks disunity of probably little clinical significance. However, a further 105 (6%) were two blocks out and 14 (1%) were three blocks out. Of the 119 who were two or more blocks discordant, the true HbA1c was in a lower or higher category than the calculated FHbA1c among 74 (62%) and 45 (38%), respectively. This analysis indicated that HbA1c was sufficiently at variance with the serum fructosamine estimate of HbA1c to have caused a potential error in the assessment of glycaemic control either by over- or underestimating attainment of glycaemic control.
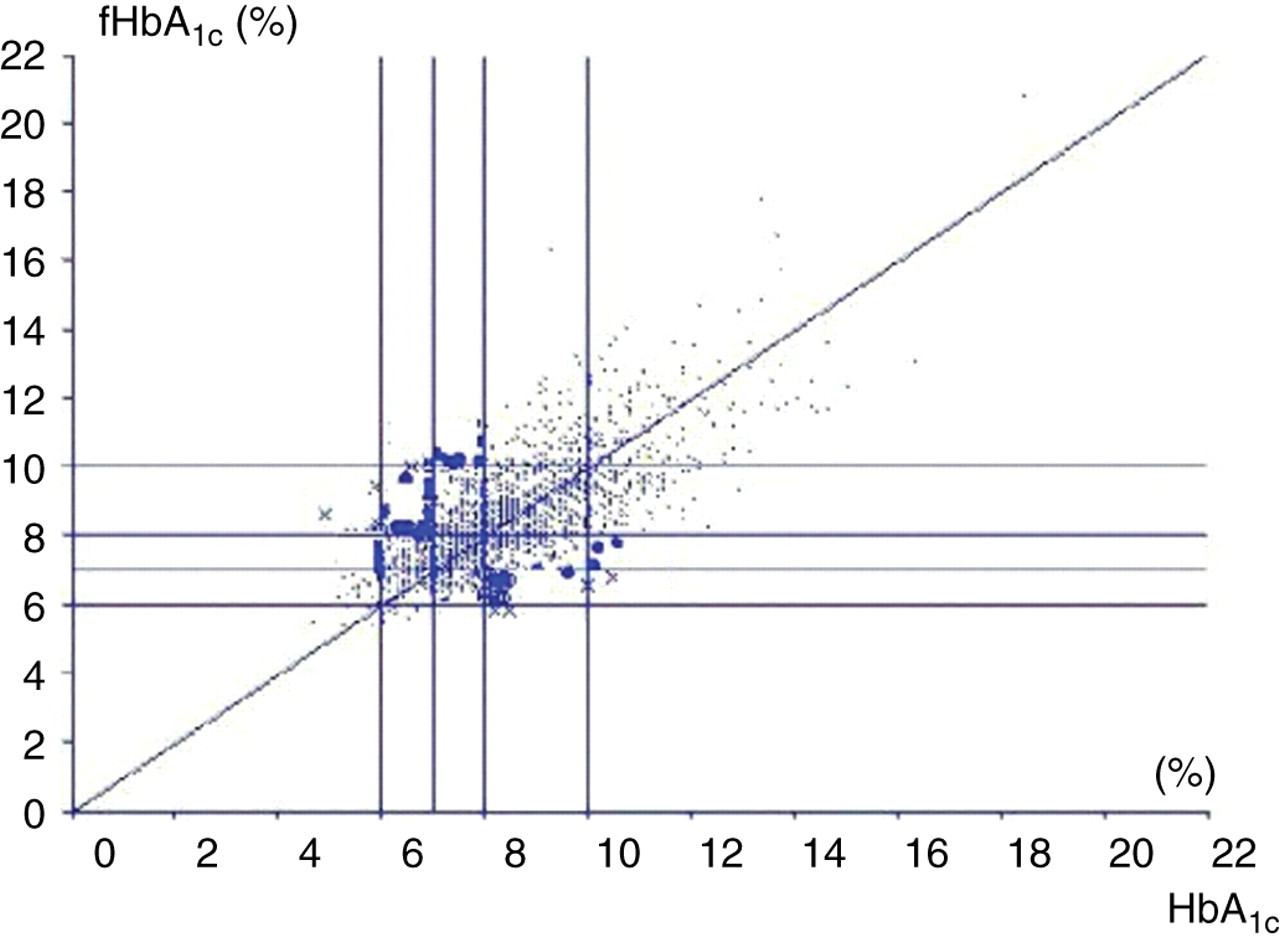
Clinical error grid analysis of the percent glycated HbA1c against the equivalent fructosamine-derived HbA1c estimate. The grid lines are placed to define blocks of excellent, good, average, poor and very poor glycaemic control. The bold dots indicated those values that are two blocks discordant
Clinical error grid analysis of the % glycated haemoglobin against the equivalent fructosamine-derived haemoglobin estimate
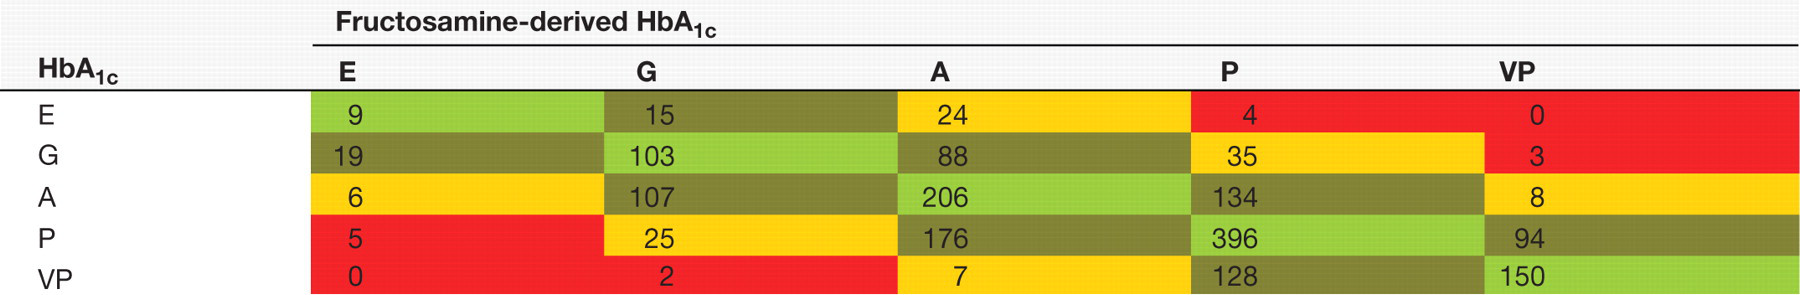
The blocks show excellent (light green), good (dark green), average (yellow), poor (orange) and very poor (red) glycaemic control.
Comparing the <2 block (n = 1577) with those of two or more block discordant (n = 167) showed the HbA1c − FHbA1c difference to be a poor predictor of potential clinical error, with considerable overlap ranging from −7.3% to +4.3% HbA1c versus −3.7% to +5.8% HbA1c, respectively, between categories. Determination of the degree to which the HbA1c − FHbA1c differences captured all two-block discordance is given in Table 2. No absolute difference securely defined discordance and thus the potential for clinical error in the assessment of glycaemic control. At best, at a threshold HbA1c difference of ≤1% between true and calculated values, all values were true-negative (there were no false-negatives [FN] or false-positives [FP]) and hence no error was possible. At a difference of >1%, there were substantial FPs. As the absolute difference increases the FN rate goes up (clinical error grid discordance missed) and the FP rate goes down (clinical error grid concordance missed). Thus at an absolute difference of >2% HbA1c, there were 63 FN and 111 FP for potential clinical error.
The difference between haemoglobin A1c (HbA1c) and the fructosamine-derived HbA1c estimate and its ability to predict a <2 block (n =1636) or >2 block (n = 120) discordance in clinical error grid analysis
FN, false-negative, less than the stipulated value but discordant; FP, false-positive, more than the stipulated value but concordant; NPV, negative predictive value; PPV, positive predictive value; Sn, sensitivity; Sp, specificity; TN, true negative, less than the stipulated value predicts <2 block concordance; TP, true positive, more than the stipulated value predicts 2 block discordance
Discussion
This study examines the possibility that HbA1c may not always be a reliable indicator of attainment of overall glycaemic control by testing the relationship between simultaneously measured HbA1c and fructosamine in a large group of people with diabetes.
When serum fructosamine was converted to a standardized HbA1c equivalent, the disparity between the two measures was considerable; for some individuals this was potentially sufficient to cause a clinical error in the assessment of long-term glycaemic control. An Altman-Bland plot identified the magnitude of the differences, with almost 11% of the cohort being >2% HbA1c-divergent. The absolute difference, however, while alerting the user to a potential problem, had little utility in predicting any clinical impact.
Thus categorizing HbA1c values to relate to relevant bands of glycaemic control in a clinical error grid analysis demonstrated discordance in the clinical judgement of two blocks or more in 7% of samples. The HbA1c could potentially both under- and overestimate glycaemic control, such that an individual judged to have ‘average’ glycaemic control by HbA1c (HbA1c 7–8%) might actually either have ‘very poor’ (HbA1c >10%) or ‘excellent’ (HbA1c <6%) control when re-evaluated by the fructosamine estimate of HbA1c. This clearly has implications in terms of managing patients.
It is well known that the degree of agreement between fructosamine and HbA1c in various studies has a considerable spread. 26–28 Some of this disparity may relate to the shorter timescale over which fructosamine reflects glycaemic control and a variety of factors may influence HbA1c, including conditions which alter red-cell lifespan, haemoglobin variants and anaemia. Although fructosamine measures a shorter timescale of glycaemic control, the impact of this may be small as most patients have remarkably constant control and there is extraordinarily tight correlation of both glycated serum proteins and A1c within an individual overtime. 29,30 A physician would also be aware of any recent change in treatment that would influence fructosamine more than HbA1c. Fructosamine measurements also have variability associated with assay methods and possibly with body mass index (BMI) and albumin concentrations. Variation within laboratories could be overcome using internal quality control and calibration, and between-laboratory variation by a national EQA provider – a pilot is currently being undertaken (National Quality Assurance Scheme, Birmingham, UK). The most recently published data on BMI and fructosamine showed no significant relationship between the two values, 31 and there is evidence to suggest that if the serum albumin is >30 g/L any effect on fructosamine is insignificant. 32 Reports could be issued with a supporting albumin concentration and a suitable warning regarding interpretation of the result if the albumin is <30 g/L.
A further limitation of this study is the absence of self-monitoring of blood glucose (SMBG) data along side the paired values. Further work examining the discordance between HbA1c, fructosamine and SMBG values would be required before widely adopting the methods used in this paper.
In recent years another possible mechanism influencing glycation has been suggested. In the intracellular milieu, as in the red-cell, fructosamine-3-kinase enzyme-dependent, 5 and possibly other enzyme-dependent, 6–8 processes are present that promote deglycation. The balance between glycation and deglycation may vary between individuals according to the activity of these pathways. Thus, there may be higher and lower rate deglycators resulting in the HbA1c being higher or lower than expected from the prevailing blood glucose environment. The observation that there appears to be variability in glycated haemoglobin which is not related to glycaemia has been noted for some time, 1,2,4 and the possibility that this has a genetic set has been raised in studies of non-diabetic and diabetic twins. 33,34 Glycation of proteins as measured by fructosamine is not intracellular and therefore would not be influenced by these pathways and so serum fructosamine measurement may well have a role in differentiating between high- and low deglycators allowing better understanding of HbA1c. This understanding is crucial to the basis of our proposal.
Our data adds to a body of opinion that challenges the role of HbA1c as the erstwhile ‘gold standard’ for assessing the attainment of glycaemic control. Nevertheless, while it may generate an error in clinical judgement and decision-making, the actual variation is not erroneous. It may have meaning and relevance to an individual with diabetes. For example, those with a higher than expected HbA1c concentration, potential slow deglycators that have a higher glycation load, may be at a greater risk of vascular disease and vice versa for those with a lower than expected HbA1c concentration. Evidence already exists to support this possibility 29,35 and it constitutes another reason for further clarity and revision of our understanding and interpretation of HbA1c.
The recent consensus statement on the standardization of HbA1c measurement 36 recommends that laboratories should report an A1c-derived average glucose value along side the HbA1c. Clinicians and patients using this derived average glucose are however more likely to overlook the limitations of the HbA1c from which it was derived. We suggest that a combination of HbA1c and fructosamine should be used to provide an understanding of glycaemic control rather than either of the single measure. The results should be presented to yield an absolute difference so that the clinician is aware of a potential error in the assessment of long-term glycaemic control with any difference >1% being flagged for concern. As the absolute difference does not accurately predict the potential to make an error in the clinical assessment of attainment of glycaemic control, it will be necessary to report a disparity in the result using clinical error grid analysis as in this paper.
A report would thus run: ‘HbA1c 8.3% (poor glycaemic control). Fructosamine 226 mmol/L equivalent to HbA1c 6.1% (excellent glycaemic control). HbA1c − FHbA1c difference 2.2%. These values are discordant and there is potential for an error in the assessment of glycaemic control’. This is a real example of an individual patient's data and in such a case the clinician may have been tempted to increase drug therapy, with a risk of generating hypoglycemia, if the HbA1c had been accepted without further thought.
The consensus statement on standardization of HbA1c 36 observes that expressing test results along with a clinically relevant interpretation of those results, as we suggest here, is not uncommon practice. Using two measures rather than one has additional cost. The cost of a HbA1c is approximately UK £4.00 and fructosamine UK £1.00; thus, the additional cost is small and is considerably less than the only other alternative – regular SMBG – which for two tests a day over a year costs approximately UK £217. In addition, if individual patients consistently have discordant or concordant results overtime, then only two or three paired readings would be required to identify the patients with persistent discordant results and only this group would need monitoring with paired readings in the long term.
In summary, HbA1c may not accurately reflect the prevailing glucose control. The magnitude of the difference may be large. We propose a method to highlight those cases where this may be sufficient to cause an error in the judgement of attainment of glycaemic control. We have sufficient cause for concern to recommend a change in diabetes practice, so that a co-assessment by serum fructosamine, in the way proposed, should become routine but with the proviso that there remains much still to learn about the wider meaning of the difference. A clinician receiving a HbA1c report should perhaps be aware of how far it deviates from an alternative estimate of HbA1c, as derived from the fructosamine, and using systematic error grid analysis, the degree to which that deviation may lead to a clinically relevant misjudgement of glycaemic control.