
Abstract
Abstract
Background
Detection of local synthesis of IgG within the central nervous system is important for the diagnosis of brain inflammatory diseases such as multiple sclerosis. This is typically done by comparing the amounts of IgG in serum and parallel cerebrospinal fluid (CSF). Although there have been well-described problems with qualitative versus quantitative measurements of abnormal IgG, such as in myeloma paraproteins, similar difficulties are also found with CSF IgG.
Methods
Traditional quantitative analysis of IgG by rate nephelometry was followed by separation of the IgG using isoelectric focusing and then either silver stain or immunofixation. Finally, quantitative analysis was performed by scanning densitometry using public domain software downloaded from the National Institutes of Health.
Results
We report here the major discrepancies that can occur with CSF IgG between the silver stain versus the IgG stain.
Conclusions
We concur with the earlier recommendation that qualitative separation followed by densitometric estimation of enzyme-linked immunofixation is also more useful than simple quantitative nephelometric analysis followed by silver staining in the detection of local synthesis of IgG, analogous to the earlier work on paraproteins.
Introduction
It has been known for many years that patients who have IgG myeloma produce idiosyncratic IgG molecules that cannot be exactly related to the polyclonal distribution of IgG molecules found in the normal population. In principle, this problem derives from the fact that there is not direct comparison of like with like. In practical terms this means that the amounts of monoclonal immunoglobulins are best measured by a combination of electrophoresis followed by densitometric scanning of all proteins, including that in the entire gamma region, with the curve for the myeloma spike then being compared with the rest of the gamma region as well as all the other proteins on the electrophoretic strip. This principle of separation is clearly enunciated on the College of American Pathologists website (
Oligoclonal bands (OCBs) comprise a small number of monoclonal peaks against a polyclonal background (ignoring ‘artefactual’ bands). 2 It is therefore not surprising to find that there are also discrepancies between the amounts of cerebrospinal fluid (CSF) IgG measured by quantitative nephelometric techniques, when compared with those seen in following qualitative separation by electrophoresis (and/or the more sophisticated technique of isoelectric focusing). The latter can subsequently be quantified by densitometric analysis.
It is now possible to calibrate digital scanners in ‘international units’ of optical density (OD) using public domain software. One such example can be freely downloaded from the NIH website (
Here, we compare and contrast two different systems for isoelectric focusing followed by densitometry. We confirm previous findings that immuno-enzymatic visualization has a wider tolerable range than silver staining, and re-assert that the more fundamental discrepancy still exists between nephelometry and densitometry in CSF, as has been referred to above in the CAP guidelines for serum monoclonal immunoglobulins.
Materials and methods
IgG and albumin were determined using the Behring nephelometer according to the techniques of Reiber et al. 3 at Speciality Labs, Valencia, CA, USA. The assay of CSF IgG (and parallel serum diluted approximately 500-fold) was optimized with a linear range from 10 to 75 mg/L. Any initial results outside this range were repeated after appropriate dilutions were made. The within-batch variability of the assay was typically 4% and the between-batch variability was 7%. In addition to strict internal quality control, Specialty Labs participates in external quality control schemes including those from Ringversuch (Germany) and have always had acceptable scores.
Before performing isoelectric focusing on polyacrylamide gels, the amounts of IgG per lane for CSF and serum were each adjusted to a total of 50 ng IgG, based on the immunonephelometric result, again at Speciality Labs, Valencia, CA, USA.
In the case of agarose isoelectric focusing, 4 μL of CSF or serum (diluted 1/400 in water) was initially applied irrespective of the concentration of IgG.
CSF OCBs were detected using isoelectric focusing gels run according to two different methods:
Separation in polyacrylamide gel followed by silver staining of all proteins (PerkinElmer, Fremont, CA, USA), performed at Speciality Labs, Valencia, CA, USA. Separation in agarose gel followed by nitrocellulose blotting, then specific immunodetection of IgG heavy chains (Helena Biosciences, Beaumont, TX, USA) based on the method by Keir et al.
4
again performed at Specialty Labs.
Individual gels were scanned in California to produce a digital image with 256 tones of grey. These scans were then compared in London with a calibrated optical wedge that had been fitted to a curve according to the formula of Rodbard, and is readily available from the NIH web- site (
Results
Two working weeks' routine samples were analysed by scanning the IgG regions of 10 gels stained with silver and another 12 gels were immunoblotted and developed immunoenzymatically using ethylaminocarbazole (EAC) as substrate for horseradish peroxidase (HRP). The scanning frame is shown for a representative silver-stained gel in Figure 1(a), along with individual lanes for each sample shown as OD units in Figure 1(b) (expressed as a percentage of the total of all IgG areas in the gel). Figure 2(a) shows an EAC-stained gel with a similar scanning frame and Figure 2(b) shows the corresponding ODs for each sample.
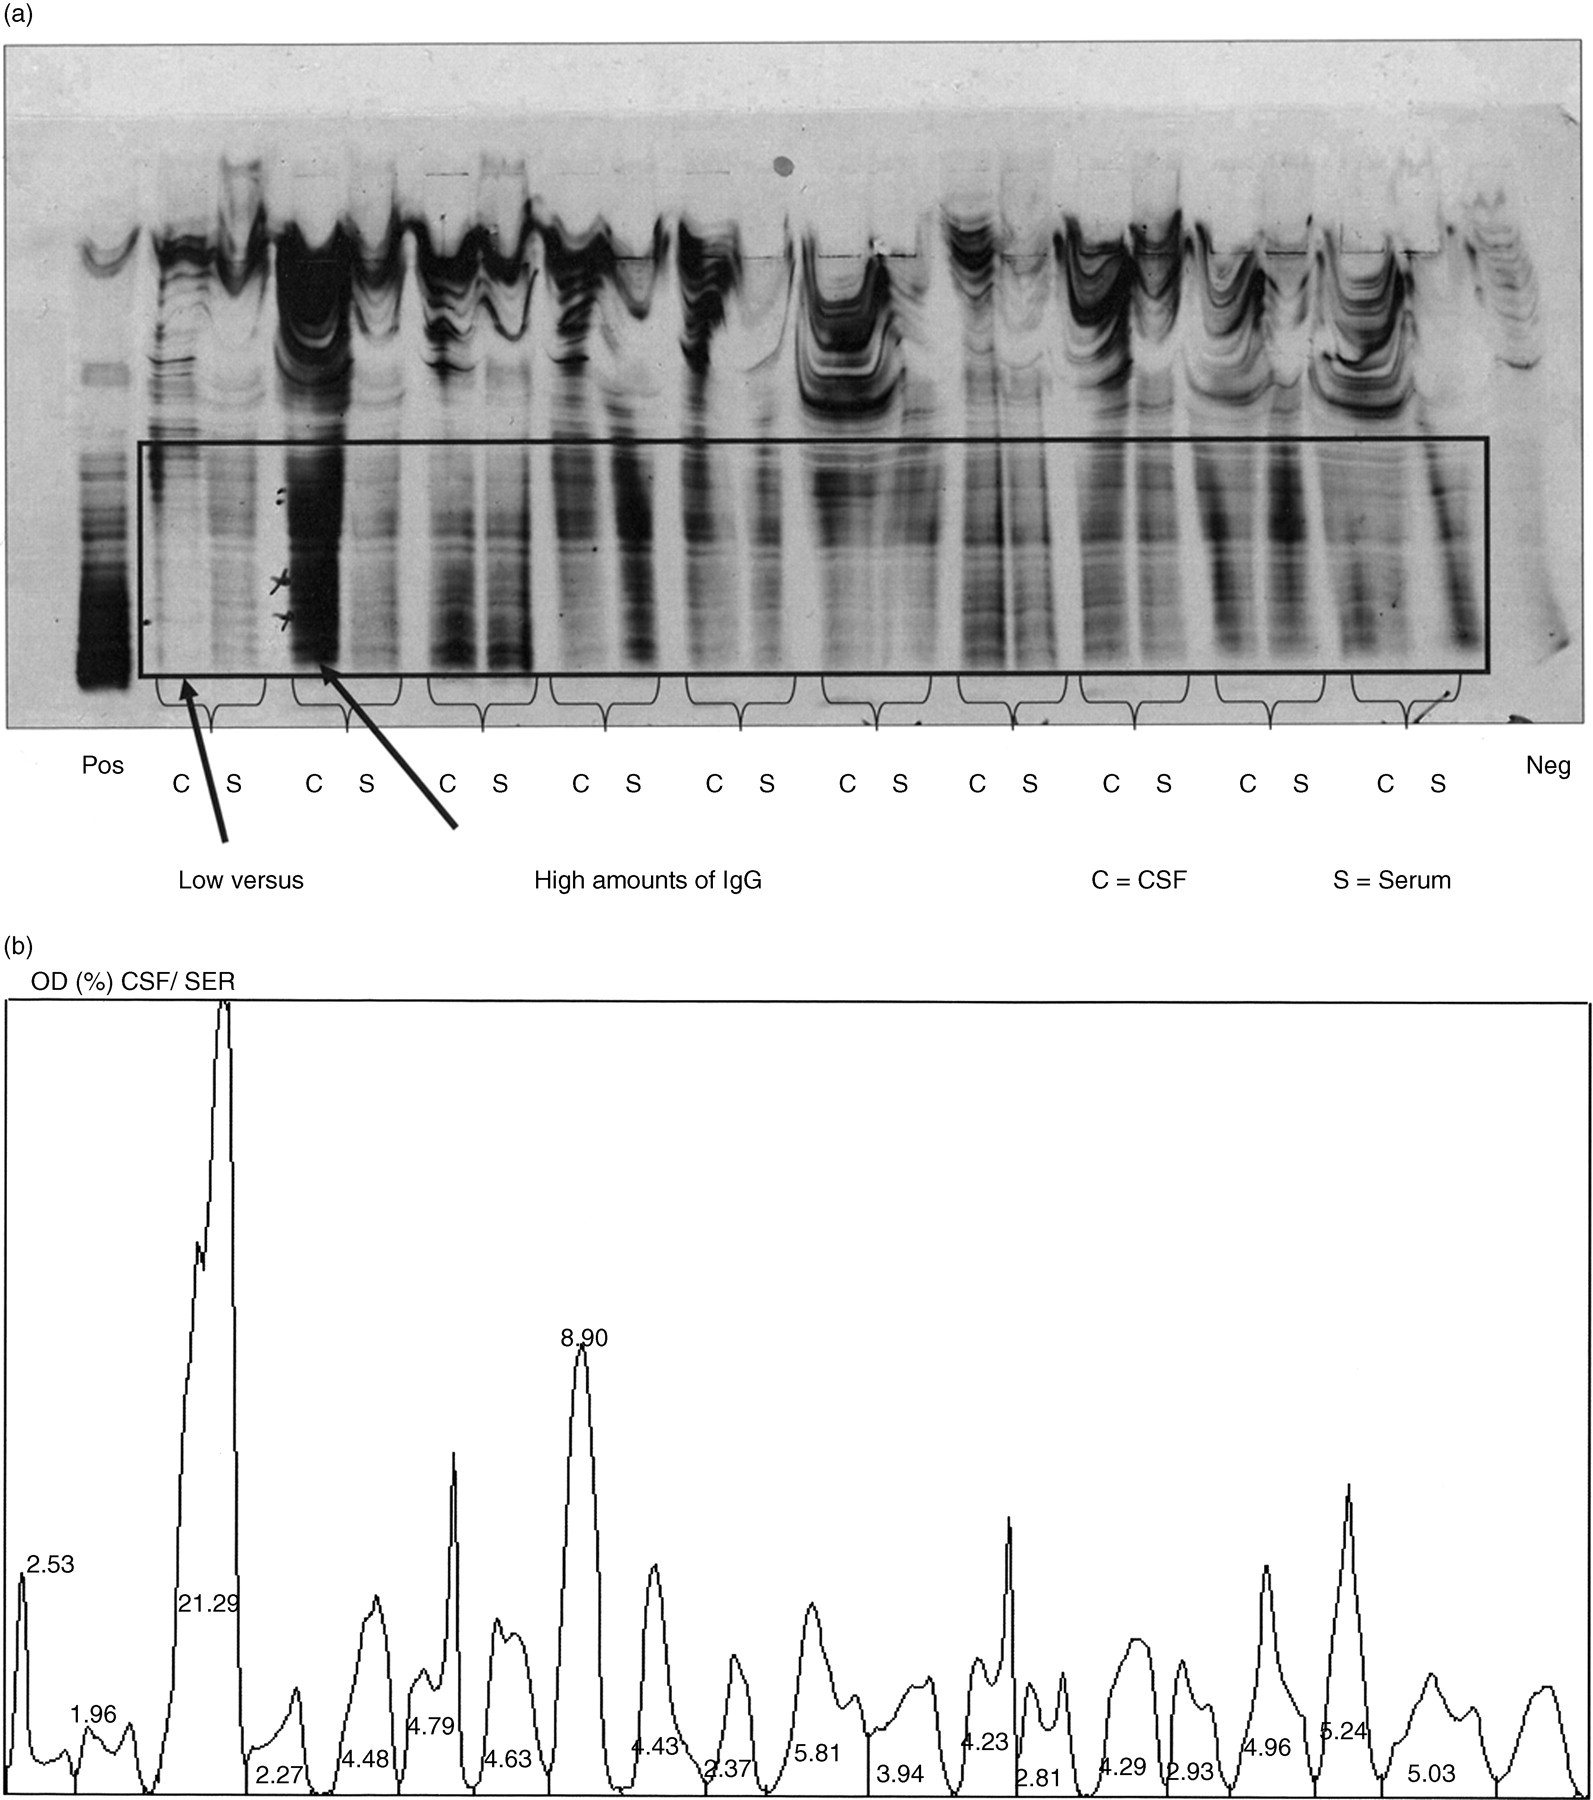
Silver stain of polyacrylamide gel showing pairs of CSF (on left) and serum (on right) from individual patients. Note the very low concentration in the first cerebrospinal fluid (CSF) compared with the much higher concentration in the second CSF. The frame shows the region which was scanned for analysis by the densitometer. (b) Densitometer scan of Figure 1(a) showing the percentage of optical densities (ODs) for individual samples (over total OD) in the frame shown in Figure 1(a). Note the difference in OD between the first CSF (2.53%) and the second CSF (21.29%)
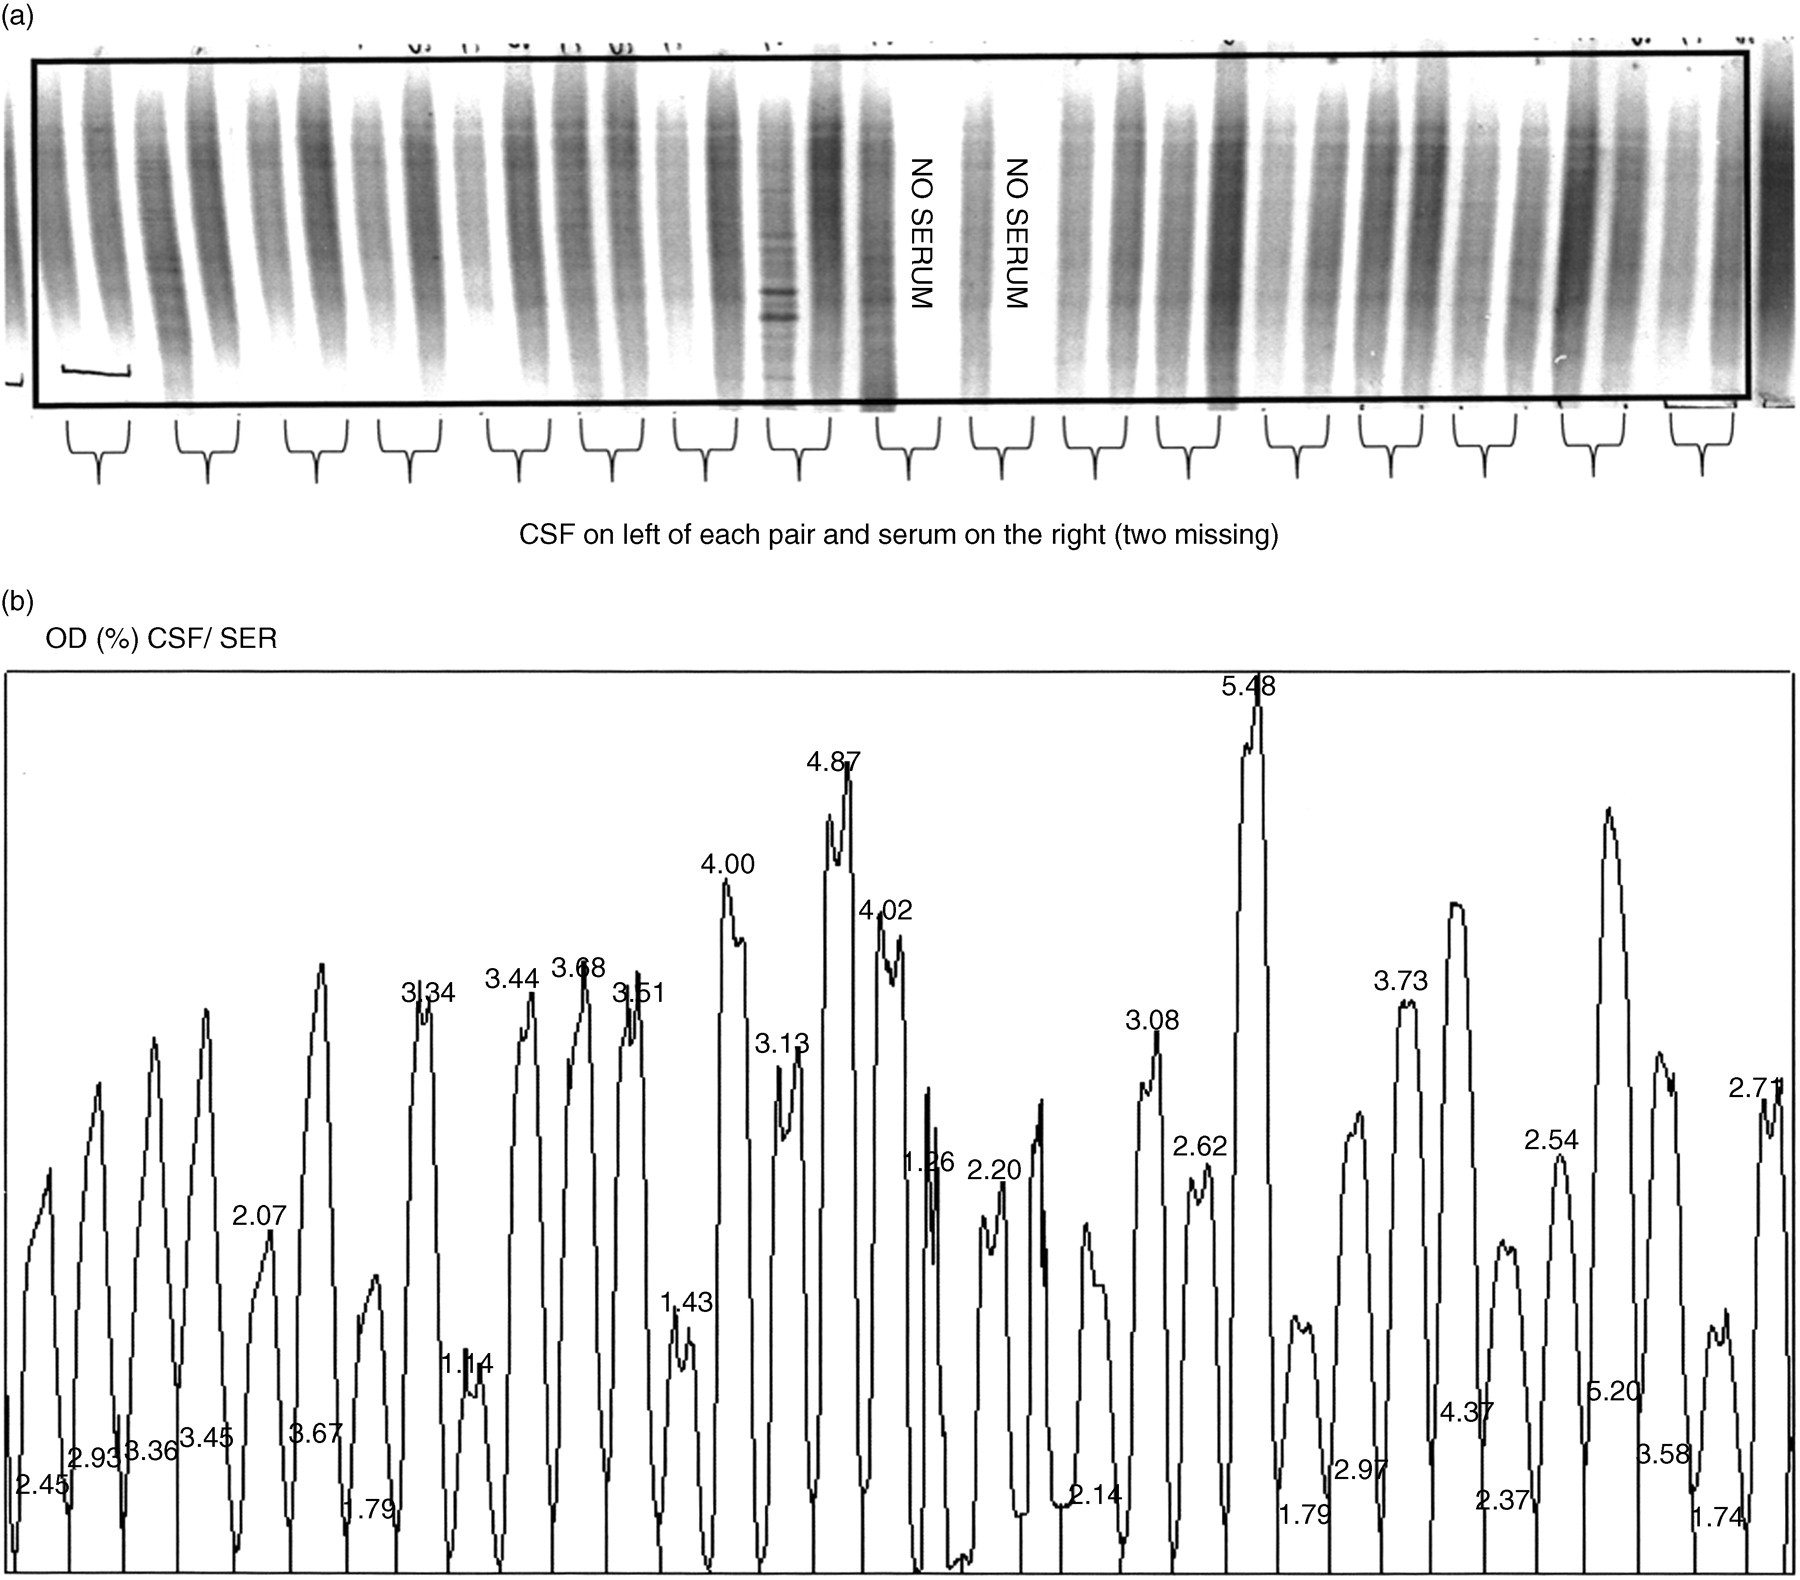
Ethylaminocarbazole/horseradish peroxidase (EAC/HRP) stain of agarose gel showing pairs of cerebrospinal fluid (CSF) (on left) and serum (on right) of individual patients. Note the similarity in the amounts of IgG. The frame shows the region which was scanned for analysis by the densitometer. (b) Densitometer scan of Figure 2(a) showing the percentage of optical densities (ODs) for individual samples in the frame shown in Figure 2(a). Note the similarity in OD between the lowest value (1.14%) and the highest value (5.48%)
Although nominally the same amounts of IgG (50 ng) had been applied in the technique of polyacrylamide gel isoelectric focusing with silver staining, the coefficient of variation (CV) of the 15 samples on each of 10 gels (total number: 150) showed an average variation of 35%. The number of samples needing to be re-run because they were either over- or under-stained was 29 of 150, i.e. 20% of the samples (Table 1). When 10 immunoblots were scanned, the CV was higher (300%) as would be expected since the same volume of CSF was applied 4 irrespective of the total protein, but only nine of the total of 432 had to be repeated, i.e. 2% of the total number of samples.
Numbers of samples re-run because they were outside the range for satisfactory interpretation
EAC/HRP, ethylaminocarbazole/horseradish peroxidase
Finally, to compare the effectiveness of the two different approaches in the detection of OCBs, 16 paired samples of CSF/serum positive for OCBs were selected in London according to the ‘gold standard’ method, 4 and sent to California to be tested using both the commercial kits, one based on silver and the other on EAC/HRP. The results from the silver technique are shown in Figures 3(a) and (b). There were no OCBs marked in samples 4, 7, 8, (#9 was inadvertently omitted), 10, 11, 14 (under-loaded) or 16 (over-loaded). All 16 samples were positive with the EAC stain (data not shown) nevertheless. In Figure 4, OCBs should be compared with Figure 3(b), particularly for samples 14 and 16. The overall results are given in Table 2.
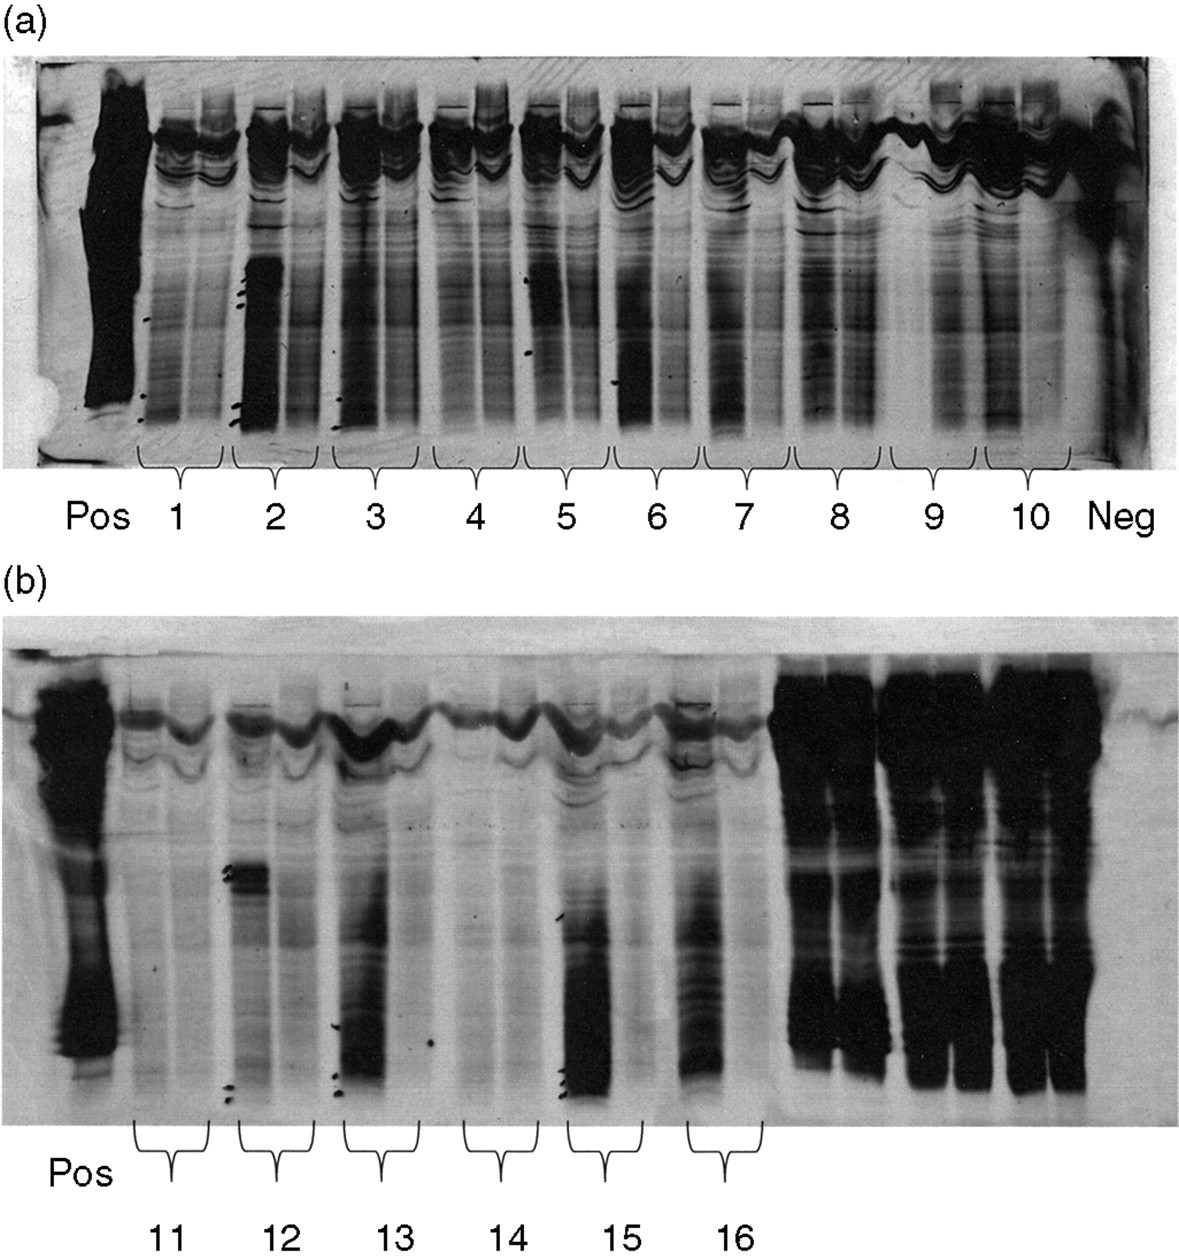
Silver stain of polyacrylamide gel for the first 10 samples, which were positive according to the ‘gold standard’ method. The CSF is on the left with the corresponding serum on the right. Note there are no bands marked for local synthesis in the CSF from samples 4, 7 or 10 (9 was omitted). (b) Silver stain of polyacrylamide gel for the next six samples, which were positive according to the ‘gold standard’ method (CSF left, serum right). Note there are no bands marked for local synthesis in the CSF from samples 11, 14 (under-load) or 16 (over-load)
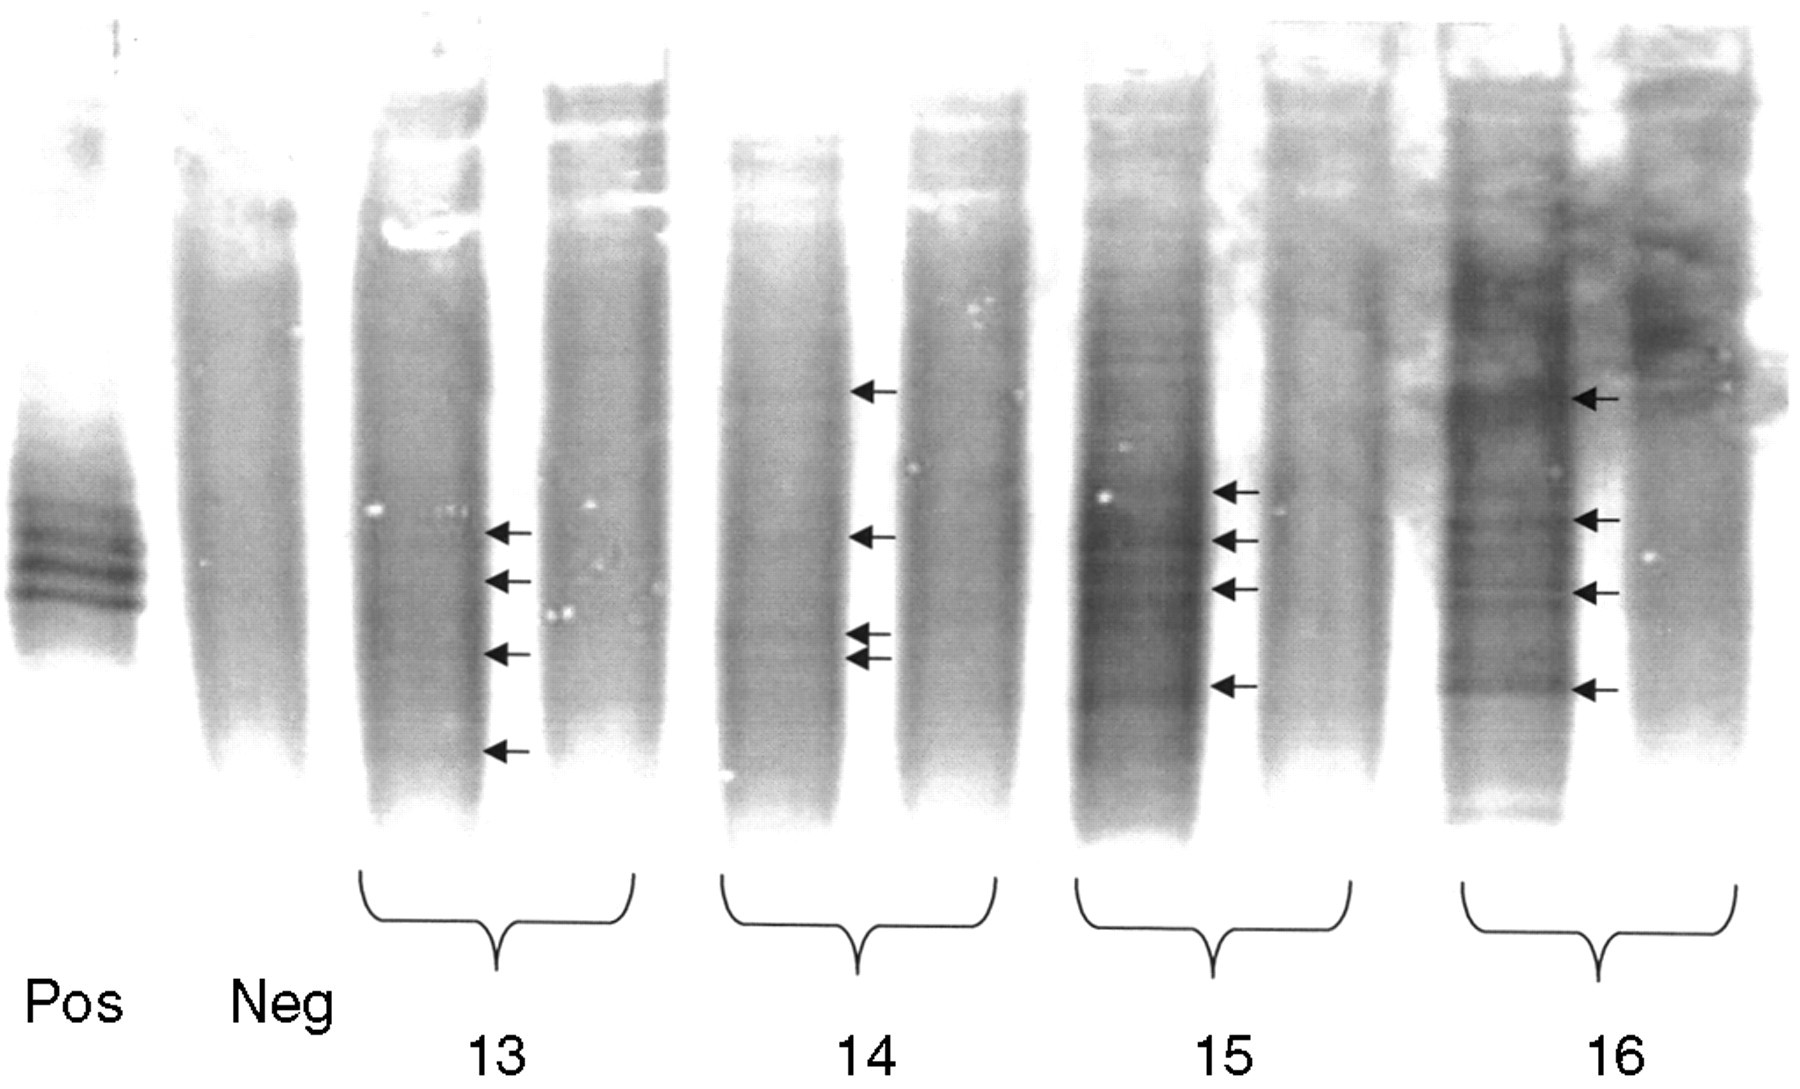
Ethylaminocarbazole/horseradish peroxidase (EAC/HRP) stain of agarose gel for samples 13, 14, 15 and 16, all of which have cerebrospinal fluid (CSF) oligoclonal bands (OCBs)
Numbers of samples positive according to the ‘gold standard’ method4
EAC/HRP, ethylaminocarbazole/horseradish peroxidase
Discussion
Given the particularly wide range of pathological IgG results in CSF, it is important to have a technique that can cope well with such diverse values. This principle was an important reason for adopting the enzymatic technique of HRP. This allows one to accommodate the 60-fold difference in concentration (i.e. from 2 to 120 ng IgG). 4 Unfortunately, silver staining has a much more narrow linear range. As a separate issue, it is important to realise that the problem of band recognition is not because of inadequate sensitivity, since when using a different enzyme with a different substrate, namely alkaline phosphatase with nitroblue tetrazolium (Sadaba), 5 most CSF samples have to be routinely diluted given the high sensitivity of this particular method. Nevertheless, the rather narrow range is also clear from the first two dilutions (successive 2-fold), shown in Figure 1, as referred to in the paper by Sadaba, 5 which shows that a difference by a factor of 2 yields results for a sample which is in gross saturation as contrasted with the next dilutions in the contiguous lanes, which are acceptable, but nonetheless have a relatively low optical density. The differential dilution of individual samples can possibly lead to its own pipetting errors, beyond those involved in the basic technique of nephelometry referred to above (and which these authors also insist upon) since they must routinely dilute both CSF as well as serum samples.
People have attempted to reduce the individual variation between patients by calculating the quotient of CSF/serum albumin, as well as for IgG. Unfortunately up to 44% patients with multiple sclerosis can also have OCBs in their serum, although these are typically rather less strong than in CSF. 6 This further confounds the problem, since the nephelometric measurement of IgG in serum can also give anomalous results (note track 13 on right, Figure 3(b) versus Figure 4).
All this is therefore consistent with the previously recognized problem of measuring the amounts of abnormal IgG by immunoassay, not just in serum myeloma bands (which has been strongly discouraged by the College of American Pathologists, see above), but also in CSF OCBs. The ‘slope’ of the silver stain is probably steeper than the more gradual enzymatic stain, which is thus consistent with the wider dynamic range of the latter.
Footnotes
ACKNOWLEDGEMENTS
The authors are very grateful to Dr R Wu, formerly of the Speciality Labs, Valencia, CA, USA, for his help in the preparation of this paper.