
Abstract
Abstract
Background
Current guidelines for the diagnosis and risk assessment of patients presenting with myocardial infarction recommend a single decision cut-off point for cardiac troponin (cTn) based on the 99th centile of a reference population. The 99th centile level for eight troponin assays was determined in an apparently cardio-healthy Australian reference population.
Methods
Nine laboratories measured troponin in serum and plasma collected from 111 reference individuals. An imprecision profile was determined using up to 10 serum samples analysed on 10 separate days. Method comparison using 100 routinely tested plasma samples was performed to estimate method concordance.
Results
Generally 99th centile values determined in this study were lower than, or the same as manufacturers' levels, except for cTnI by Architect (0.020 vs. 0.012 μg/L), and imprecision at the 99th centile was 20% coefficient of variation (CV) or higher. Troponin concentrations at 10% CV were greater than those quoted in the manufacturer's package insert except by AxSYM, 0.06 vs. 0.16 μg/L cTnI, and by E-170, 0.02 vs. 0.03 μg/L cTnT. In the method comparison 74, 70, 65, 75, 58, 66, 58 and 77 samples measured by Access, Architect, AxSYM, Centaur, Dimension RxL, E-170, i-STAT and Vitros ECi assays, respectively, had troponin concentrations above the study 99th centile.
Conclusions
Depending on the selected reference population for troponin, there is likely to be variability in the 99th centile as shown in this study. Some differences in sample concordance at the 99th centile cut-off were observed between cTn methods and may result in different clinical classification.
Introduction
The European Society of Cardiology and the American College of Cardiology (ESC/ACC) recommend a single decision cut-off point for cardiac troponin (cTn), based on the 99th centile of a reference population, for the diagnosis and risk assessment of patients presenting with myocardial infarction (MI) and assays should achieve an imprecision of ≤10% coefficient of variation (CV) at the 99th centile. 1,2 However, no definition of the ‘reference population’ is given in the consensus document. According to the latest National Academy of Clinical Biochemistry and International Federation of Clinical Chemistry and Laboratory Medicine (IFCC) guidelines concerning use of biochemical markers of acute coronary syndromes (ACS), reference decision limits should be based on a population of normal, healthy individuals without a known history of heart disease. 3 Generally, laboratories depend on the manufacturer's package insert data for a method's 99th centile value as the establishment of a troponin reference interval is a difficult and costly procedure if individuals with asymptomatic coronary artery disease are to be excluded from the reference population.
It seems from the peer-reviewed literature and manufacturers' inserts however, that the troponin concentration at the 99th centile for any one assay is a variable number depending on: (1) the study or manufacturer's selected reference population, e.g. Access AccuTnI 99th centile varies from 0.02 μg/L to 0.08 μg/L in studies of 758 and 696 individuals, respectively, 4,5 compared with the manufacturer's value of 0.04 μg/L; (2) the generation of assay that is used, i.e. the later generation, more sensitive assays such as the Roche troponin T assays, have decreased the 99th value from ≤0.06 μg/L for the second-generation Enzymun cTnT, to <0.01 μg/L which is below the limit of detection for the third- and fourth-generation assays; 6 (3) the specimen type, e.g. 0.06 μg/L and 0.03 μg/L for plasma and serum, respectively, for the Dimension cTnI assay; 5,6 and (4) the manufacturer's reagent formulation resulting in differences in low-end sample values between lot numbers. 7 The inconsistency of the 99th centile value within any one troponin assay also suggests that this value may fluctuate depending on the imprecision of the assay 6 and how well individuals are screened for reference interval studies. A significant proportion of persons have silent ischaemia which can skew the troponin distribution. 8,9 In addition, few troponin reference interval studies have been performed using samples collected from truly cardio-healthy individuals or using the same panel of samples. 6,7
Our study aimed to determine troponin 99th centile levels in an Australian reference population for currently available assays and to compare these values to those provided in the manufacturers' inserts. Nine laboratories measured troponin in serum and lithium-heparinized plasma collected from 111 apparently cardio-healthy reference individuals using eight cTn assays. At the same time imprecision was assessed at low-level troponin concentrations close to the 99th centile, and a method comparison was performed to determine analytic concordance at the 99th centile.
Materials and methods
Reference population subjects
Reference population subjects were 62 men and 49 women aged between 25 and 74 years, mainly Caucasian, and selected from the local Brisbane community after initially participating in a screening questionnaire. The questionnaire was used to exclude subjects with diabetes mellitus, hypertension, known cardiac disease or treated/known hyperlipidaemic individuals and those taking any cardiac medications, e.g. beta blockers, calcium channel blockers and angiotensin-converting enzyme (ACE) inhibitors. Selected participants then underwent testing for coronary artery disease by stress echocardiography, 10 and blood and urine were collected for routine chemistry testing. Ethics approval was obtained from the Princess Alexandra Hospital Ethics Committee to proceed with this study. Written consent was obtained from the reference subjects for blood and urine collections.
Reference population samples
Blood from reference population subjects was collected into Greiner PST (lithium-heparinized plasma) and SST (serum) tubes, centrifuged within 2 h of collection at 15°C and 3000 rpm for 10 min, separated and routine chemistry testing performed. Plasma and serum for troponin measurement was stored in 0.3–0.5 mL aliquots at −80°C within 8 h of blood collection. A random urine sample was collected from the same individuals.
Troponin imprecision profile samples
Precision samples included the manufacturer's quality controls (n = 2–6 depending on the assay), one low-level plasma pool and nine linearly-related dilutions of a cTnI or cTnT-positive serum in the concentration range of approximately 0.02–1.0 μg/L. Dilutions of the cTnI-positive sample were made in a cTnI-negative serum pool (cTnI <0.02 μg/L by Bayer Centaur TnI-UltraTM assay) prepared from blood collected from apparently healthy laboratory staff (12 subjects). The nine diluted samples were at 2%, 3%, 5%, 10%, 20%, 30%, 40%, 50% and 100% cTnI concentrations (approximately 1 μg/L). For precision testing by i-STAT, low-level plasma pool and dilutions of NIST SRM 2921 prepared in a cTnI-negative plasma pool (cTnI <0.02 μg/L by Centaur) were used.
For cTnT measurement, dilutions of the cTnT-positive sample were made in a cTnT-negative serum pool (cTnT <0.01 μg/L by Roche Elecsys 2010 assay) prepared from blood collected from apparently healthy laboratory staff (5 subjects). The nine diluted samples were at 1%, 2%, 3%, 5%, 10%, 20%, 40%, 50% and 100% cTnT concentrations (approximately 1 μg/L). Serum and plasma ‘diluent’ pools were also assayed for cTnI or cTnT. All precision samples were stored in 0.3–0.5 mL aliquots at −80°C.
Method comparison samples
Lithium-heparinized plasmas from 95 hospital patients undergoing routine cTnI testing and plasmas from five laboratory staff were stored frozen at −80°C in aliquots (0.3 mL) within 24 h of blood collection.
Frozen samples for reference interval, imprecision profile and method comparison testing were despatched by the coordinating laboratory on dry ice to participating laboratories where they were stored frozen at −20°C or lower until use. Samples for each daily run were thawed at room temperature, mixed and centrifuged at 3000 rpm for 5 min prior to assay.
General chemistry tests
Testing for general chemistry analytes including electrolytes, urea, creatinine, calcium, phosphate, liver enzymes, glucose, iron, ferritin, transferrin, cholesterol, triglyceride, HDL-cholesterol, calculated LDL-cholesterol and urine total protein was performed using Roche Diagnostics reagents and Modular P/DP (Roche Diagnostics, Sydney, Australia) analysers. Glycated haemoglobin (HbA1c) was measured by Variant II (Bio-Rad Laboratories, Sydney, Australia) and urine albumin by IMMAGE Protein System (Beckman–Coulter, Sydney, Australia).
Troponin assays
Nine laboratories participated in the troponin study, seven measuring cTnI and two measuring cTnT. Troponin I methods were Access 2 AccuTnI (Beckman-Coulter) Architect Stat Troponin-I ci8200 (Abbott Diagnostics, Sydney, Australia), AxSYM ADV (Abbott Diagnostics), Centaur TnI-UltraTM (Bayer Healthcare Diagnostics, Melbourne, Australia), Dimension RxL (Dade Behring, Sydney, Australia), i-STAT (Abbott Point of Care, Sydney, Australia) and Vitros ECi ES (Ortho-Clinical Diagnostics, Sydney, Australia) methods. Troponin T was measured using Elecsys 2010 and E-170 assays (Roche Diagnostics).
Protocols
Imprecision
All laboratories, except that using i-STAT assay, measured troponin in singlicate on the precision samples, ‘diluent’ pool and the manufacturer's quality controls on 10 separate days (Table 1). Study laboratories determined a low-level troponin imprecision profile by the measurement of the series of nine serum or plasma-based dilutions of a cTnI or cTnT-positive serum and the low-level plasma pool (except for i-STAT). During this time automated assays were recalibrated at least once using the same reagent and calibrator lots. For i-STAT two lots of cartridges were used and were within the manufacturer's specifications when tested with quality controls. The number of precision analyses per day per method ranged from 13–16 except for i-STAT. For precision testing by i-STAT, the low-level plasma pool was analysed in singlicate on 10 days by two i-STAT readers (n = 20). In addition, for testing of between-reader imprecision, dilutions of NIST SRM 2921 were made in a cTnI-negative plasma pool and singlicate measurements were made on the same day using two readers (n = 2).
Assay protocols for imprecision, reference interval and method comparison studies performed by each participating laboratory
*Measurement of reference interval and method comparison samples was alternated between two i-STAT readers over Days 1–10
Method comparison samples were assayed after the precision and reference interval studies for cTnT by Elecsys 2010
The same reagent lot was used in all cTn assays except for i-STAT, which used two lots of i-STAT cartridges (lot 1 on Days 1–9; lot 2 on Day 10)
Reference intervals
Matched serum and plasma samples from 11 reference interval subjects (12 on Day 10) were assayed daily, at the same time as the imprecision samples. A total of 222 samples (111 serum samples and 111 plasma samples) were assayed, each in singlicate, except for i-STAT that assayed the 111 plasma samples only, in singlicate (Table 1).
Method comparison
At the same time as the precision and reference interval samples were run, lots of 25 method comparison plasma samples were assayed on four days, except for Elecsys cTnT which assayed the samples after Day 10. The reference interval and method comparison measurements were alternated between the two i-STATS over the 10 days (Table 1).
Data analysis
Troponin concentrations were reported to the number of significant figures normally measured for each method. Between-run imprecision was determined for automated assays from the repeat, singlicate cTn measurement over 10 days of a low-level pool, the series of nine diluted cTn-positive samples, and manufacturer's quality controls (n = 2–6). The between-run standard deviation (SD) at each cTn concentration for the diluted series and low-level pool was calculated and applied to a variance function program (VFP Version 7.0, WA Sadler, Christchurch, New Zealand), to construct a method's imprecision profile. Troponin concentrations at 10% and 20% CV were interpolated from the plot.
The 99th centile for troponin was determined in plasma and serum from reference subjects (plasma only for i-STAT) for each method by Microsoft Excel software. Matched plasma and serum samples were compared by Wilcoxon matched-pairs signed-ranks test.
Method comparison of 100 plasma samples was by Passing‐Bablok regression analysis.
Results
Imprecision testing by study laboratories
The between-run imprecision of each automated troponin method was assessed by repeat troponin measurement of up to 16 samples over 10 days, which included assay of manufacturer's quality controls (Appendix A) and low-level serum or plasma cTn samples (Appendix B). Imprecision for manufacturers' controls was generally within quoted specifications and for the low-level plasma pool was less than 10% CV, except by Dimension RxL and one i-STAT reader. Troponin I values for the low-level pool ranged from 0.139 μg/L by i-STAT to 0.212 μg/L by Architect (Table 2).
Imprecision and 99th centile values determined by study laboratories for nine troponin assays and compared with manufacturers' data
*From the manufacturer's data on file or package insert, IFCC precision study performed by manufacturers in 2003,33 and available on IFCC C-SMCD website34
Data were obtained by study laboratories from a 10-day precision study of troponin using a low-level plasma pool, serum containing low levels of troponin at nine concentrations (except for Dimension RxL, over seven days, and i-STAT, which measured the patient plasma pool on 10 days using two readers; Appendix B) and diluent pool. cTn levels at 10% and 20% CV (95% confidence interval) were determined by imprecision profile except for E-170 and Elecsys 2010 where cTnT at 20% CV was <0.014 and <0.03 μg/L, respectively, and not performed for i-STAT due to insufficient data points
Lithium-heparinized plasma and serum samples from 108 cardio-healthy reference individuals who tested negative by stress echocardiography; 99th centile values are to the number of significant figures reported by the analyser; 77 samples were available for Dimension RxL measurement, and three samples were excluded from the Architect assay 99th centile (see text)
Values were above 10% CV at tested cTnI concentrations
**CV was 10% at 0.14 μg/L cTnI (n = 20 measurements of plasma pool)
NA, not available; WB, lithium-heparinized whole blood
Mean cTnI concentrations for 10 daily measurements of the linearly-related precision samples are shown in Appendix B together with the values expected by dilution. Values used to construct the imprecision profile for each method included from 70 to 100 measurements, depending on the analytical sensitivity of each assay, except for Dimension RxL with 56 cTnI values at seven levels, and for i-STAT, where there were insufficient replicate measurements over the low-level cTnI concentration range to provide a suitable imprecision profile. Precision samples with cTn values at or below a method's detection limit were generally excluded from the profile (see Appendix B for details). Figure 1 shows the imprecision profiles for seven assays and their 95% confidence intervals. Method precision at 10% and 20% CV was determined from the imprecision profile. Generally the 10% CV troponin concentration measured by study laboratories was greater than that quoted in the manufacturer's package insert except by AxSYM, 0.06 vs. 0.16 μg/L cTnI, and by E-170, 0.02 vs. 0.03 μg/L cTnT (Table 2). For the Dimension RxL, imprecision was greater than 10% CV at tested cTnI concentrations. Troponin concentration and 2SD limits at an imprecision of 20% CV are also shown in Table 2.
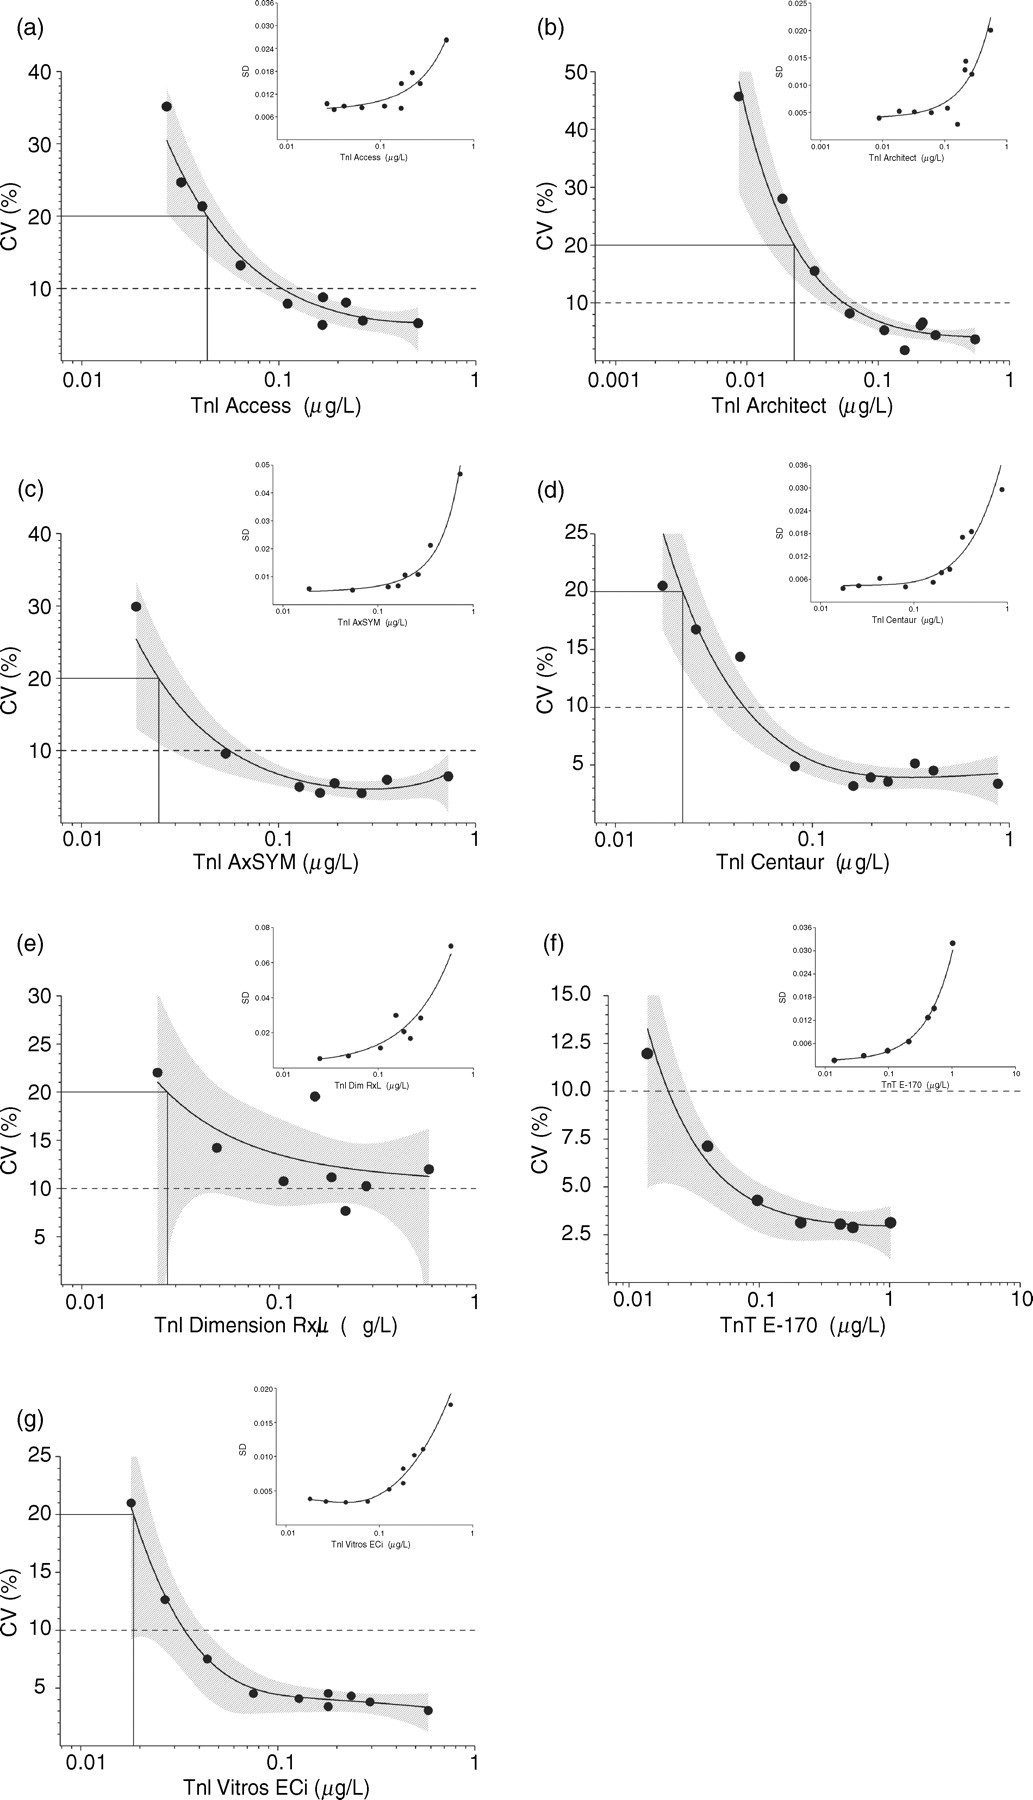
Imprecision profiles of % coefficient of variation (CV) and standard deviation (SD) versus troponin concentration (logarithmic scale) shown for seven troponin methods determined by measurement of low-level cardiac troponin (cTn) samples on 10 separate days (7 days using Dimension RxL). Number of cTn precision measurements ranged between 70 and 100 (56 for Dimension RxL), depending on a method's analytical sensitivity. The imprecision profile curve and 95% confidence interval (shaded area) were determined by a variance function program for Access (a), Architect (b), AxSYM (c), Centaur (d), Dimension RxL (e), E-170 (f) and Vitros ECi (g) assays. Troponin concentrations at 10% CV and 20% CV are indicated by dotted and solid horizontal lines, respectively
Ninety-ninth centile values determined by study laboratories
Of the 111 apparently cardio-healthy individuals who participated in the reference interval study, three were found to have cardiovascular abnormalities by stress echocardiography. These subjects showed either left bundle branch block and apical septum hypokinaesia at rest, angina and ST depression with apical/anterior wall motion abnormalities, or apical hypokinesia with likely subsegmental scar; none had troponin concentration above the 99th centile for any assay. Several subjects had an increased cardiovascular risk for some biochemical parameters. Approximately 20% of subjects had elevated total cholesterol (5.6–8.5 mmol/L) and LDL-cholesterol concentrations (3.6–6.1 mmol/L). Seven subjects had increased HbA1c values up to 6.6% (reference interval 4.0–6.0), three subjects had estimated glomerular filtration rate (eGFR) <60 mL/min/1.73 m 2 (57, 57 and 59) and one subject a borderline elevated urine albumin/creatinine ratio of 2.1 mg/mmol (reference cut-off <2.0).
The 99th centile level for troponin was determined using lithium-heparinized plasma and serum from 108 reference individuals, except for i-STAT which used plasma only, and Dimension RxL for which only 77 reference values were available. For all cTnI methods the distribution of reference values was skewed towards zero concentration with a proportion of the values at or below the method's limit of detection (Figure 2). cTnT concentrations by E-170 and Elecsys were below the limit of detection at <0.01 μg/L for both plasma and serum samples and the distribution was indeterminate. Minimal differences between the plasma and serum 99th centile were observed for Access (0.03 and 0.04 μg/L), Architect (0.020 and 0.021 μg/L) and Vitros ECi (0.016 and 0.015 μg/L) methods (Table 2). A more marked difference was observed using the Dimension RxL assay with the plasma and serum cTnI 99th centile at 0.06 and 0.03 μg/L, respectively. Distributions of troponin in matched plasma and serum samples were similar for Architect, AxSYM and Vitros ECi assays compared with statistically significant differences between plasma and serum (P value <0.001) for Access, Centaur and Dimension RxL assays (Figure 2). Determination of 99th centile limits according to gender gave the following cTnI serum (plasma) values for men (n = 61) and women (n = 47), respectively: 0.04 (0.03) μg/L and 0.03 (0.03) μg/L by Access; 0.015 (0.014) μg/L and 0.021 (0.018) μg/L by Architect; 0.022 (0.018) μg/L and 0.019 (0.027) μg/L by Centaur; 0.015 (0.015) μg/L and 0.015 (0.014) μg/L by Vitros ECi (not determined for other methods where cTn values were largely skewed towards the detection limit).
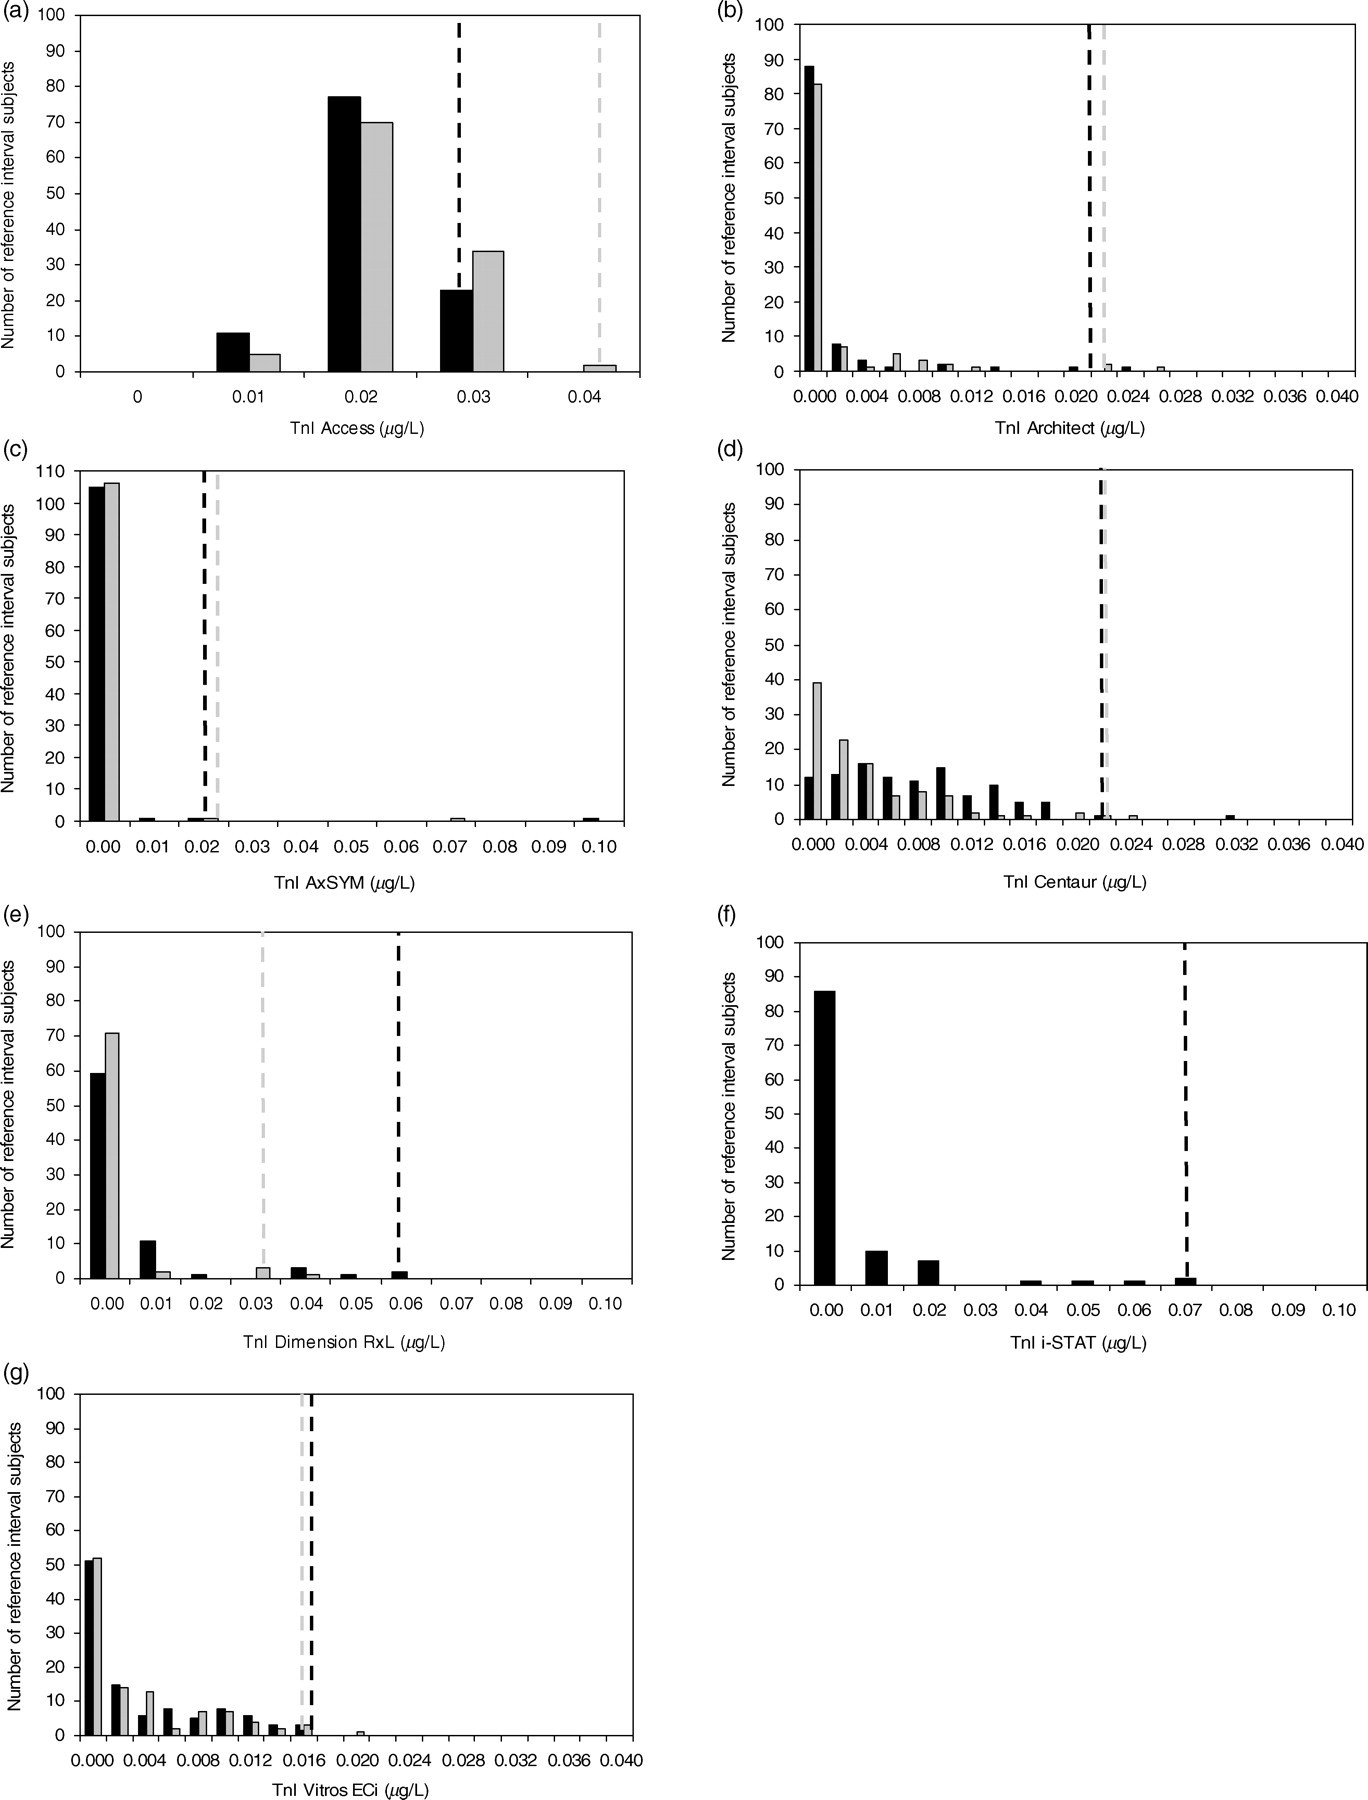
Distributions of plasma (▪) and serum (▪) troponin concentrations shown for seven cardiac troponin (cTn)I methods in the study reference population and corresponding plasma (–––) and serum (–––) 99th centile limits. cTnI methods are Access (a), Architect (b), AxSYM (c), Centaur (d), Dimension RxL (e), i-STAT (f) and Vitros ECi (g). Plasma and serum cTnT concentrations by E-170 and Elecsys were <0.01 μg/L (not shown)
Of approximately 1930 reference interval troponin measurements in 111 plasma and 111 serum samples by nine methods, results from three reference interval subjects were excluded due to cardiovascular abnormalities. An additional three sample values were excluded from the Architect reference interval calculation, two having plasma cTnI greater than four-fold above the 99th centile at 0.129 μg/L and 0.874 μg/L (corresponding serum cTnI was 0.070 μg/L and 0.696 μg/L, respectively), and one with a three-fold higher plasma value compared with serum (0.053 μg/L vs. 0.018 μg/L). Generally 99th centile values determined by study laboratories were lower than those quoted in manufacturers' package inserts (Table 2), except for cTnI by Architect at 0.020 μg/L compared with 0.012 μg/L and the same as the manufacturer's 99th centile for cTnT by Elecsys 2010 and E-170 at <0.01 μg/L. Imprecision at the 99th centile troponin level was 20% CV or greater for cTnI methods.
Method comparison
The μgmean cTnI value for method comparison sample measurements ranged from 0.85 μg/L by i-STAT and 0.88 μg/L by Access, to 1.59 μg/L by Centaur. Passing‐Bablok regression analysis of cTn concentrations for the 100 patient specimens, with the Access as the comparator assay (cTnI range: 0.02–13.4 μg/L), is shown in Figure 3. I-STAT cTnI gave closest agreement with Access cTnI (Figure 3f; regression slope 1.063; y-intercept −0.021; R 2 0.857). Of other method comparisons, closest agreement was between AxSYM and Dimension RxL cTnI methods (regression slope 1.00; y-intercept 0.00; R 2 0.988). Concordance between methods was evaluated at five troponin cut-off levels namely, the manufacturer's 99th centile and 10% CV level, study 99th centile and study 10% and 20% CV levels. The numbers of samples with troponin values above the selected cut-off level are shown in Table 3. Generally, at the study 99th centile and 20% CV level, more troponin values were above the cut-off compared with the manufacturer's 99th centile, except for Architect, where there were three and six additional values, respectively. At the study 99th centile the number of samples with troponin concentrations above this level were 74, 70, 65, 75, 58, 66, 58 and 77 measured by Access, Architect, AxSYM, Centaur, Dimension RxL, E-170, i-STAT and Vitros ECi assays, respectively. This compared with 69, 73, 61, 67, 54, 66, 58 and 71 samples with troponin concentrations above the manufacturer's quoted 99th centile level for the same methods. Sample classification by Elecsys 2010 and E-170 assays was the same. Using the study 20% CV troponin concentration as cut-off, the number of samples above this level were 69, 67, 65, 75, 63 and 76 by Access, Architect, AxSYM, Centaur, Dimension RxL and Vitros ECi assays, respectively. For 44 low-level plasma samples (cTnI: 0.02–0.11 μg/L by Access) and using the study 99th centile as cut-off, the number of samples above this level were 19, 17, 21 and 24 by Access, Architect, Centaur and Vitros ECi assays, respectively, compared with 12, 5, 5 and 10 by AxSYM, Dimension RxL, i-STAT and cTnT assays, respectively (Figure 4).
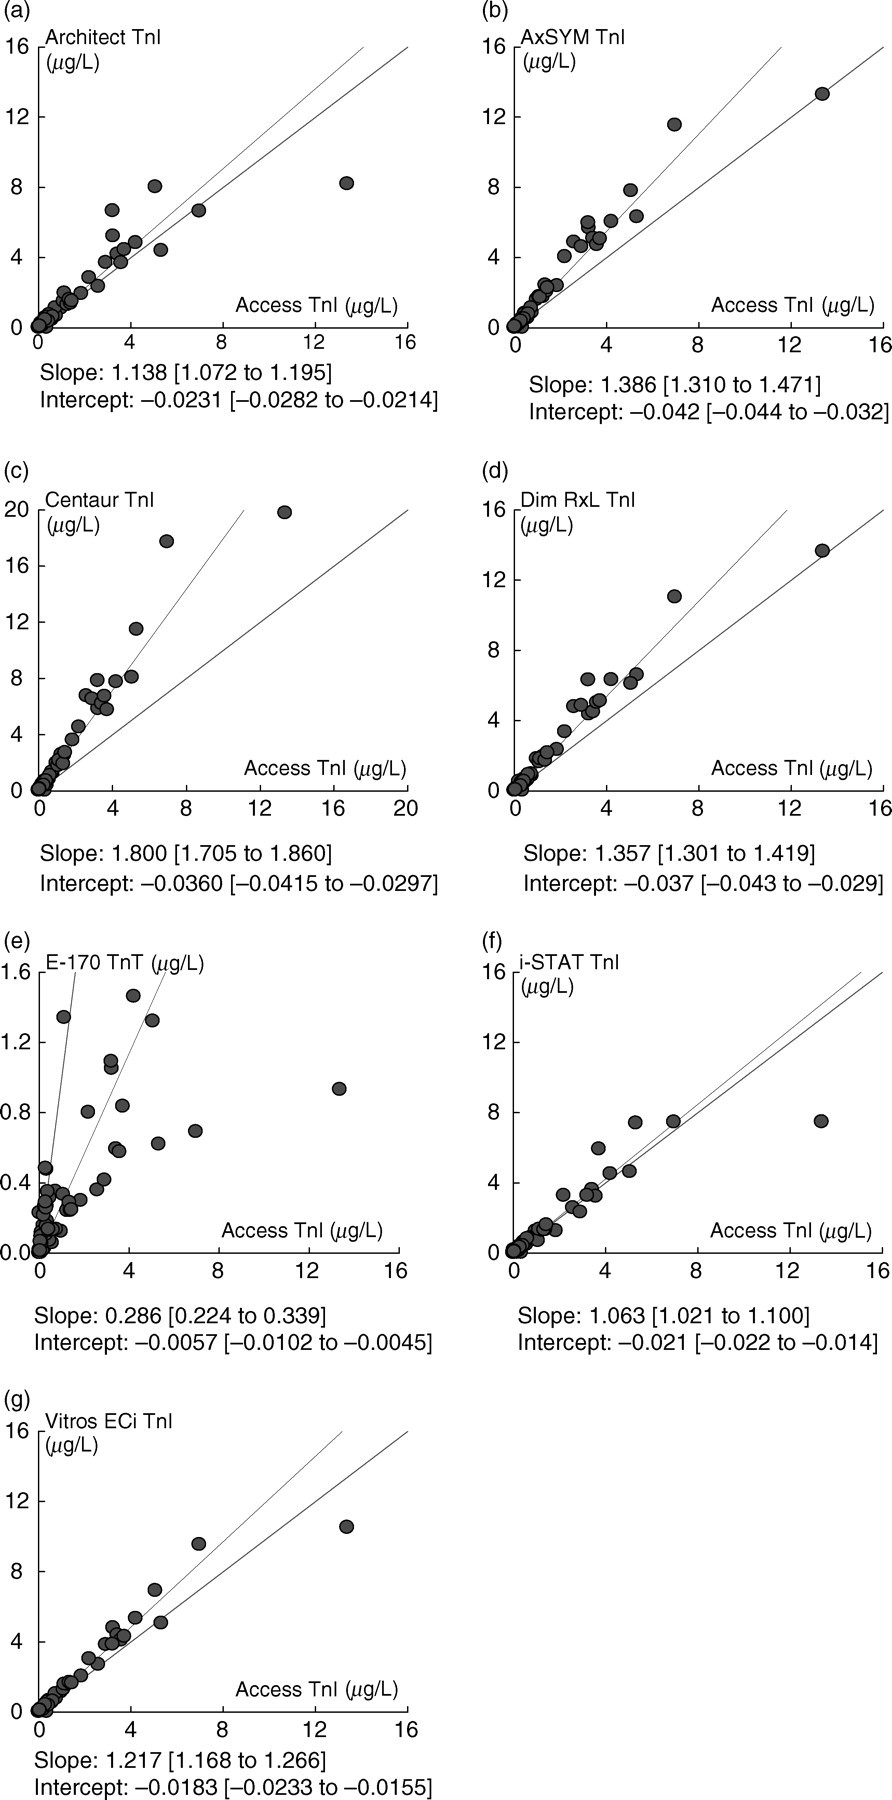
Passing‐Bablok regression analysis plots of cardiac troponin (cTn) concentrations for 100 plasma samples are shown for seven method comparisons (Access as predicate assay) namely: Architect (a), AxSYM (b), Centaur (c), Dimension RxL (d), E-170 cTnT (e), i-STAT (f), Vitros ECi (g). Values for regression slope, y-intercept and corresponding 95% confidence interval (given in brackets) are shown for each method comparison
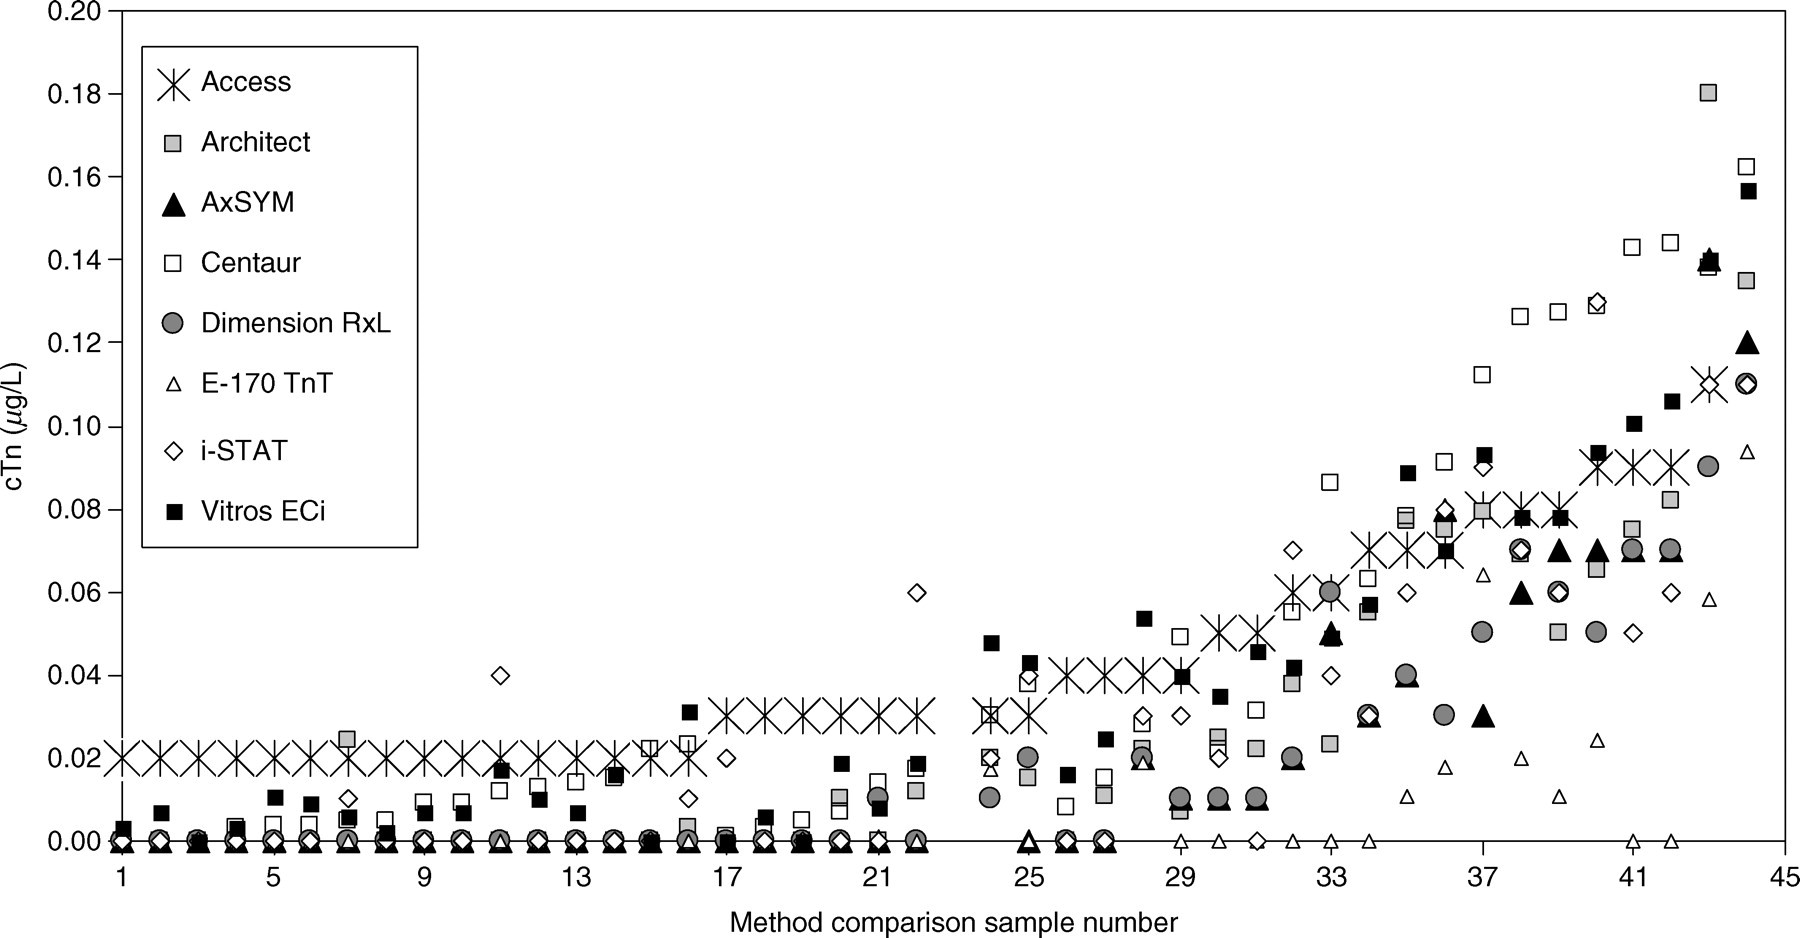
Cardiac troponin (cTn) concentrations for 44 low-level plasma samples, arranged in order of increasing Access cTnI concentration (up to 0.11 μg/L), are shown for seven cTnI methods and cTnT by E-170. Values for the other 56 samples (not shown) were generally above the 99th centile for all assays
Number of method comparison samples with troponin concentration above study 99th centile, manufacturer's 99th centile, study 20% coefficient of variation (CV) level, and study and manufacturer's 10% CV levels
*cTnT values >0.013 μg/L (CV 12%)
NA, not available
Discussion
The ESC and ACC recommend a single decision cut-off point for cTn based on the 99th centile of a reference population for the diagnosis of patients presenting with MI. 1 The recommendation of a CV of 10% or lower at the 99th centile aims to target the manufacturers to improve assay precision especially at low troponin concentration close to this cut-off. Previous proponents of the 10% CV as the decision cut-off for MI recently concluded, however, that their findings supported and added to other data showing that increases in the cTnI concentration even below the level of a 10% CV may offer important risk and outcome assessment for patients with ACS. 11 For risk stratification and prognosis, the clinical studies show that in the setting of both low- and high-risk ACS troponin concentration down to the assay's limit of detection is informative for worsened prognosis. 12–17 However, the laboratory is at a high risk of reporting falsely elevated troponin concentrations if the cut-off level is close to the detection limit. 18 The ‘newer generation’ troponin assays are reputed by the manufacturers to give improved analytical sensitivity and imprecision at the low end of the troponin measuring range close to the 99th centile value. When reporting down to these low troponin concentrations laboratories require adequate quality control procedures to monitor methods in this range for clinical accuracy. In our study, we determined the 99th centile for eight currently available troponin assays and at the same time assessed assay imprecision at the low end of the troponin measuring range.
The study highlights issues when using the 99th centile as the clinical cut-off, including, which 99th centile to use and how to define a ‘cardio-healthy’ reference population. In a recent population study of troponin, a proportion of Swedish elderly men with no cardiac symptoms at the time of blood collection went on to develop cardiac disease or had increased mortality at follow-up several years later. 9 Slightly elevated cTnI levels above a 99th centile of 0.021 μg/L (Access AccuTnI) were associated with signs of ongoing subclinical processes in the myocardium. In a separate study of American residents, the estimated population prevalence of cTnT elevation was 0.7% indicating low-level troponin elevation was associated with underlying cardiovascular disease or a high-risk phenotype for cardiovascular disease. 8 In our study 108 of the 111 reference subjects were found to be at a relatively low risk for cardiovascular disease and were included in determination of the 99th centile level. Although approximately 20% of subjects had elevated cholesterol and LDL-cholesterol concentrations, no correlation was observed between troponin concentration and cholesterol or age of the reference subject. This may have been due to the small number of subjects in this study. Two of the 108 subjects had eGFRs below 60 mL/min/1.73 m 2 , but troponin concentrations for both were below the 99th centile by all methods and were unlikely to have affected the 99th centiles. Other exclusion criteria for reference interval subjects include the presence of heterophile antibodies, which can cause falsely-elevated troponin concentrations 19 and were most likely the cause of two of three elevated cTnI reference values using the Architect assay, the other plasma elevation most probably due to a fibrin microclot. As shown here, the 99th centile value is not the same for all troponin I assays and this cannot be completely explained by differences in calibration. Although mean plasma troponin I sample values were approximately two-fold different between methods, with Access and i-STAT reading lowest and Centaur highest of the tested cTnI assays, plasma 99th centile levels were lower for Architect, AxSYM, Centaur and Vitros ECi assays compared with Access or i-STAT assays. Except for cTnT and Architect cTnI assays, we found 99th centile levels were lower for the reference population samples used in this study compared with the levels quoted by manufacturers which may reflect the source of the reference population and varying cardiovascular status (Table 2). Plasma versus serum 99th centile values by Dimension RxL were two-fold different and similar to values reported in larger reference population studies. 5,6 Analysis of the 99th centile level by gender was limited in this study, due to the small number of reference subjects, i.e. 47 women and 61 men. However, the apparent consistent lack of gender difference in the 99th centile level for tested methods suggests there was no sex-related difference in our cardio-healthy population, and men did not have higher levels as has been previously reported. 6
Apart from what defines a suitable reference population, a further issue with the 99th centile limit is the non-Gaussian distribution for the tested troponin I methods with a proportion of the values below the limit of detection (Figure 2). For cTnT, all values were below the limit of detection and the distribution is unknown. It is recommended that for non-parametric distributions at least 120 reference subjects are required 20 although Hickman and co-workers suggest at least 300 and probably 500 persons, 21 and Linnet proposes up to 700 are required for highly skewed distributions. 22 Interestingly, in a recently published evaluation of serum and plasma 99th centile values for three second-generation cTnI assays, in which serum from 2992 apparently healthy volunteers and plasma (heparin) from a separate group of 2000 healthy individuals aged 18–66 years were assayed, similar or higher 99th centile levels were obtained compared with those determined in our study. 23 Serum cTnI 99th centile levels were 0.04 μg/L, 0.025 μg/L and 0.034 μg/L for Access, Architect and Vitros ECi assays, respectively, compared with values of 0.04 μg/L, 0.021 μg/L and 0.015 μg/L for the same assays used here for only 108 apparently cardio-healthy subjects. The other 1% of subjects in the larger study had cTnI values as high as 0.31 μg/L, 0.24 μg/L and 0.11 μg/L cTnI by Access, Architect and Vitros ECi, respectively, 23 whereas this was not the case in our study. Hence, a smaller number of reference subjects may be adequate for establishing the 99th centile limit for troponin assays, provided subjects with subclinical coronary artery disease have been excluded, as was done here.
Missov and DeMarco 24 suggest that the plasma value for cTn in healthy subjects is 0.0001–0.0002 μg/L and results from a continuous microscopic loss of cardiomyocytes during normal life. Until normal troponin concentrations can be measured with high precision and are Gaussian-distributed, as suggested by Wu et al., 25 the 99th centile is a variable number that depends on the reference population used and the skewness factor of the distribution. Upper values in the reference distribution will show large variability which will impact on the precise location of the 99th centile. Depending on which 99th centile is used, different clinical classification is likely for a manufacturer's method.
In addition to the 99th centile as the clinical decision limit, other cut-offs have been suggested that take into account the imprecision of troponin measurement at low levels. Thomas et al., 26 after doing a between-laboratory review of troponin assay performance, suggested the clinical decision limit be the lowest concentration that could be reliably distinguished from the manufacturer's 99th centile. This was calculated to be the concentration at which the confidence limit was 3SD greater than or equal to the 99th centile reference limit. In the case of cTnI by Access, Thomas and co-workers obtained a decision limit of 0.07 μg/L, this being 3SD above the manufacturer's 99th centile of 0.04 μg/L. However, this approach is dependent on using the 99th centile which we have shown can be quite a variable number. An alternate suggestion for the clinical decision limit is the troponin concentration at 20% CV. Hickman et al. 27 have suggested that the troponin concentration corresponding to a CV of 20% is close enough to the clinical threshold to be used as the appropriate decision limit. We found study imprecision close to the 99th centile concentration to be around 20% CV. Although 99th centiles in general were different to those quoted by the manufacturers, imprecision results were remarkably consistent with those obtained in other laboratory studies. 26–28 For example, using the Access cTnI assay, Koerbin et al. 28 determined the concentrations at 20% and 10% CV to be 0.04 and 0.12 μg/L, and Thomas et al. 26 found it to be 0.02 and 0.11 μg/L, respectively, which compare with similar concentrations of 0.04 and 0.11 μg/L in our study. In another UK evaluation, two laboratories measured a series of serum pools in quadruplicate over five days. 29 For a total of 40 measurements by Access, low-level imprecision ranged from 23–29% CV at 0.033 to 0.056 μg/L cTnI.
The reported between-laboratory reproducibility of troponin precision suggests there is analytical validity for the reporting of troponin down to the 20% CV level. However, in so doing, both laboratories and clinicians should be familiar with an assay's measurement uncertainty especially at low troponin concentration. For example, an assay with a 99th centile at 0.04 μg/L and imprecision of 20% CV can be expected to give, for the repeat measurement of a sample with a concentration of 0.04 μg/L cTn, values in the range of 0.02–0.04 μg/L (−2SD) approximately 50% of the time and in the range 0.04–0.06 μg/L (+2SD) the other 50% of the time. Herein is the difficulty in specifying a cut-off rather than a continuum of cardiovascular risk with increasing cTn concentration. In addition, point-of-care testing assays for cTn may lack the analytical sensitivity and precision required at the 99th centile. 30 Although i-STAT cTnI assay showed good linearity on dilution (Appendix B), it did not detect as many low-level samples as being above the 99th centile compared with the troponin T assay or other more sensitive cTnI assays (Table 3; Figure 4). Provided laboratories and clinicians understand there is increased measurement uncertainty at low troponin concentrations and interpret results accordingly, in conjunction with the global evidence-based guidelines and the patient clinical signs and symptoms, there is likely to be more consistent reporting and interpretation of troponin results. 31
From the laboratory's perspective, additional quality procedures should also be implemented within the laboratory for reliable and reproducible measurement at low troponin concentrations. The laboratory should use appropriate quality controls to detect any assay drift or decreased precision performance of the assay at the low end of the troponin measuring range. Any factors that impact on assay imprecision, such as diminished analyser performance or between-reagent lot variability, are likely to contribute to increasing imprecision at the limit of detection and the 20% CV troponin levels. Reliable and reproducible performance of an assay at low levels requires the following laboratory quality procedures be implemented: (1) testing of low-level troponin samples during an initial assay evaluation and determination of troponin concentrations at 20% and 10% CV by imprecision profile; (2) daily monitoring of a negative control sample and a low-level control with a troponin concentration close to the 20% CV level (in-house or manufactured if available) to detect assay drift or deterioration of assay performance; (3) monitoring of longer-term assay reproducibility at low troponin concentration that takes into account new troponin reagent lots, changes in reagent formulation, and any suboptimal analyser performance; and (4) laboratory exchange of low-level troponin patients' samples to test for comparability of values using the same method until there are suitable, commutable external quality assurance materials available.
Ideally, in any comparison of methods and their concordance, clinical verification of patient outcomes and duplicate measurement of samples, to reduce random error from imprecision, provide greater clinical and analytical confidence in troponin assays. Neither of these was performed in this study and we are reliant on data from clinical studies to confirm use of appropriate troponin decision cut-offs that are both workable within the laboratory and adhere to evidence-based clinical guidelines. A patient sample evaluation and comparison of the number of samples above each method's 99th centile has given us some insight into differences between troponin assays (Figures 3 and 4). In our hands the newer generation assays, including Access, Architect, Centaur and Vitros ECi, gave more samples with values above study and manufacturer's 99th centiles, study 20% CV level and manufacturer's 10% CV level compared with the other tested methods. A comprehensive evaluation of nine cTn assays conducted in the UK also found that some assays were better than others at detecting levels of prognostic significance. 29 According to reported studies on clinical concordance, 4,32 first- and second-generation troponin assays may detect different troponin-positive patient groups due to their differing analytical sensitivities and antibody specificity, which may result in different clinical classification depending on the method used. Although Architect and AxSYM assays use the same combination of antibodies and gave similar 10% and 20% CV levels in this study, fewer patients would have been classified as troponin-positive using the AxSYM assay (Figure 4). Apart from differences in assay format and possible non-reactivity of some troponin forms in plasma, another explanation for the apparent discordant classification may be random measurement error. Given the greater imprecision at low troponin concentration for all tested methods, different classifications may have occurred if samples had been measured a second time. 18
As higher sensitivity troponin assays are developed by the manufacturers, laboratories can expect to see further lowering of imprecision and improved calibration between methods. At the same time we can anticipate that the 99th centile limits and the 10% and 20% CV levels will decrease further, given their history of continual lowering as more sensitive troponin assays are introduced.
Conclusions
Up-to-date data on the 99th centile level for troponin assays established using a cardio-healthy reference population are reported here. Levels were generally lower than those quoted in the manufacturer's package insert with imprecision at the 99th centile close to 20% CV. Therefore, depending on the selected reference population for troponin, there is likely to be variability in the 99th centile level. To ensure accurate reporting of low troponin concentration close to the 99th centile and 20% CV levels, troponin assays should be reliable and reproducible. As well as the analysis of manufacturers' usual quality controls, laboratories should ensure adequate monitoring of troponin assays close to these levels by use of appropriately low-level controls that will detect assay drift and any decreased assay imprecision. In addition, laboratories should alert clinicians to the measurement uncertainty of troponin assays when interpreting low-level results.
Footnotes
Acknowledgements
Thanks go to all study laboratories for their participation, and to the diagnostic companies that provided reagent kits free of charge for this study namely: Abbott Diagnostics, Abbott Point of Care, Bayer Healthcare Diagnostics, Beckman-Coulter Diagnostics, Dade Behring Diagnostics, Ortho-Clinical Diagnostics and Roche Diagnostics. Special thanks go to Dr Terry Pry for critical review of the manuscript, and to Bill Sadler for helpful advice on the statistical data analysis and critical review of the manuscript.
Participating Study Laboratories were: Pathology Queensland at QHPS-Central, Royal Brisbane and Women's Hospital, Brisbane; QHPS-The Prince Charles Hospital, Chermside; QHPS-Logan, Logan Hospital; QHPS-Rockhampton, Rockhampton Hospital; Alfred Pathology, Alfred Hospital, Melbourne; Bendigo Pathology, Bendigo Hospital; Mater Pathology Service, Mater Hospital, Brisbane; Northern Rivers Pathology, Lismore; PaLMS-Laboratory, Royal North Shore Hospital, Sydney, Australia.